. 2023 Jul 17;133(14):e162836.
doi: 10.1172/JCI162836.

RINT1 deficiency disrupts lipid metabolism and underlies a complex hereditary spastic paraplegia

Affiliations

RINT1 deficiency disrupts lipid metabolism and underlies a complex hereditary spastic paraplegia

Nathalie Launay et al. J Clin Invest. .

Abstract

The Rad50 interacting protein 1 (Rint1) is a key player in vesicular trafficking between the ER and Golgi apparatus. Biallelic variants in RINT1 cause infantile-onset episodic acute liver failure (ALF). Here, we describe 3 individuals from 2 unrelated families with novel biallelic RINT1 loss-of-function variants who presented with early onset spastic paraplegia, ataxia, optic nerve hypoplasia, and dysmorphic features, broadening the previously described phenotype. Our functional and lipidomic analyses provided evidence that pathogenic RINT1 variants induce defective lipid-droplet biogenesis and profound lipid abnormalities in fibroblasts and plasma that impact both neutral lipid and phospholipid metabolism, including decreased triglycerides and diglycerides, phosphatidylcholine/phosphatidylserine ratios, and inhibited Lands cycle. Further, RINT1 mutations induced intracellular ROS production and reduced ATP synthesis, affecting mitochondria with membrane depolarization, aberrant cristae ultrastructure, and increased fission. Altogether, our results highlighted the pivotal role of RINT1 in lipid metabolism and mitochondria function, with a profound effect in central nervous system development.

Keywords: Metabolism; Mitochondria; Neurological disorders; Neuroscience.


Conflict of interest statement

Conflict of interest: The authors have declared that no conflict of interest exists.

Figures

Figure 1
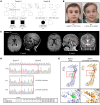
Figure 1. RINT1 variant features.
(A) Pedigrees of families A and B. Asterisks denote genotyped individuals. (B) Photograph illustrating dysmorphic features, notably low-set ears and strabismus, seen in patients P1 and P3. (C) Axial FLAIR and sagittal T1 MRI sequences of patient P1 showing posterior periventricular hyperintensities and thinning of the corpus callosum at 2 years (red arrows) and improvement of posterior periventricular white matter hyperintensity and signs of cerebellar atrophy compared with the previous study and optic chiasm atrophy (coronal T2 image) at 5 years (red arrows). (D) Sanger sequencing results for the RT–PCR products for a control individual and the patients revealing an in-frame deletion of 7 amino acids (p.Phe558_Gln564del) in patients P1 and P3. (E) 3D representations of the WT and mutated forms (p.Phe558_Gln564del) of RINT1. The structures were modelled with the Swiss-Prot server using the 3FHN model (Tripathi et al., 2009) as a template (Tip20p, homologue in S. cerevisiae).
Figure 2
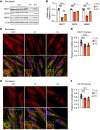
Figure 2. RINT1 mutations alter NRZ complex.
(A) Control (CTL) and patient (P1 and P3) fibroblasts were subjected to immunoblot analysis using the anti-RINT1, anti-ZW10, and anti-NBAS antibodies. The total amount of α-tubulin (α-tub) was used as a loading control. Blots run in parallel using identical samples are shown. (B) Quantification of RINT1, ZW10, and NBAS protein levels in patient fibroblasts (P1 and P3) relative to the controls (CTL, n = 6). (CF) Representative confocal images of control (CTL) and patient (P1 and P3) fibroblasts stained with the anti-Calnexin and anti-RINT1 antibodies (C) or the anti-Calnexin and anti-ZW10 antibodies (E). Scale bars: 10 μm. A zoomed-in view is shown for each image with a scale bar of 2 μm. (D and F) Colocalization between RINT1 (D), ZW10 (F), and Calnexin is expressed as Pearson’s coefficient measured for individual cells. n > 20 cells for each genotype. Patient (P1 and P3) and control (CTL, n = 3) fibroblasts. All data are shown as the mean ± SD. Results were obtained from 2 independent experiments. *P < 0.05, **P < 0.01, ***P < 0.001. All data analysis were performed using 1-way ANOVA followed by Tukey’s test for multiple comparisons.
Figure 3
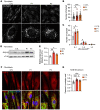
Figure 3. RINT1 mutations impair Autophagic Flux and lead to abnormal Golgi morphology.
(A) Representative Western blot showing LC3-II levels from control (CTL) and patient (P1 and P3) fibroblasts without or with Bafilomycin A1 (Baf A1). The total amount of β-actin was used as a loading control. (B) Quantification of LC3-II levels in patient fibroblasts (P1 and P3) relative to the controls (CTL, n = 6). (C) Representative images of Golgi apparatus of control (CTL) and patient (P1 and P3) fibroblasts incubated at 37°C. Scale bars: 5 μm. (D) Quantification of Golgi area in patient fibroblasts (P1 and P3) relative to control cells (CTL, n = 3). n > 50 cells for each genotype. All data are shown as the mean ± SD. Results were obtained from 2 independent experiments. *P < 0.05, **P < 0.01, ***P < 0.001. Analysis of data in B was performed using 2-way ANOVA followed by Tukey’s test for multiple comparisons. Data in D were analyzed using 1-way ANOVA followed by Tukey’s test for multiple comparisons.
Figure 4
Figure 4. RINT1 mutations alter LD size and number.
(A) Representative images of LDs in control (CTL) and patient (P1 and P3) fibroblasts at the basal level. LDs were stained with Oil red O. Scale bars: 20 μm. A zoomed-in view is shown for each image with a scale bar of 2 μm. (B and C) Quantification of the number (B) and average area (C) of LDs/cell observed in panel A. n > 50 cells for each genotype. Patient (P1 and P3) and control (CTL, n = 3) fibroblasts. (D) Control (CTL) and patient (P1 and P3) fibroblasts were subjected to immunoblot analysis using the anti-RAB18 antibody. The total amount of α-tubulin (α-tub) was used as a loading control. (E) Quantification of RAB18 protein level in patient (P1 and P3) fibroblasts relative to the controls (CTL, n = 6). (F) Representative confocal images of control (CTL) and patient (P1 and P3) fibroblasts labeled with the anti-Calnexin and anti-RAB18 antibodies. Scale bars: 10 μm. A zoomed-in view is shown for each image with a scale bar of 2 μm. (G) Colocalization between RAB18 and Calnexin is expressed as Pearson’s coefficient measured for individual cells. n > 20 cells for each genotype. Patient (P1 and P3) and control (CTL, n = 3) fibroblasts. All data are shown as the mean ± SD. Results were obtained from 2 independent experiments. *P < 0.05, **P < 0.01, ***P < 0.001. The data in B, E, and G were analyzed by 1-way ANOVA followed by Tukey’s test for multiple comparisons. The data in C were analyzed by 2-way ANOVA followed by Tukey’s test for multiple comparisons.
Figure 5
Figure 5. Impaired TG synthesis in fibroblasts and plasma from patients with RINT1 mutations.
(A and B) Lipidomic analysis of total neutral lipids in fibroblasts (A) and plasma (B) from patients P1 and P3 relative to control individuals (CTL, n = 5-6) (triacylglycerols (TG); diacylglycerols (DG); free cholesterol (FC); cholesterol esters (CE) and FC/CE ratio). (C) mRNA levels of DGAT1 and DGAT2 in patient fibroblasts (RINT1mut, n = 2) relative to the control fibroblasts (CTL, n = 4). All data are shown as the mean ± SD. Results were obtained from 2 independent experiments. *P < 0.05, **P < 0.01, ***P < 0.001. Analysis of data in A and B were performed using 1-way ANOVA followed by Tukey’s test for multiple comparisons. Data in C were analyzed using unpaired 2-tailed t test.
Figure 6
Figure 6. Oversynthesis of phospholipids in fibroblasts and plasma from patients with RINT1 mutations.
(A and B) Lipidomic analysis of total phospholipids and lysophospholipids in fibroblasts (A) and plasma (B) from patients (P1 and P3) relative to control (CTL, n = 5–6) individuals (phosphatidylcholine (PC); phosphatidylethanolamine (PE); phosphatidylserine (PS); PC/PE ratio; PC/PS ratio; lysophosphatidylcholine (Lyso-PC); lysophosphatidylethanolamine (Lyso-PE); lysophosphatidylserine (Lyso-PS); PC/Lyso-PC ratio; PE/Lyso-PE ratio; and PS/Lyso-PS ratio). (C) Increased PCYT2 and decreased PLA2G6 expression in patient fibroblasts (RINT1mut, n = 2) relative to control (CTL, n = 4) cells. (D) Patient fibroblasts (RINT1mut, n = 2) exhibited higher expression levels of SREBP-1c and FASn than control (CTL, n = 4) cells. All data are shown as the mean ± SD. Results were obtained from 2 independent experiments. *P < 0.05, **P < 0.01, ***P < 0.001. Analysis of data in A and B were performed using 1-way ANOVA followed by Tukey’s test for multiple comparisons. Data in C and D were analyzed using unpaired 2-tailed t test.
Figure 7
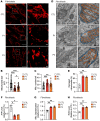
Figure 7. Pathogenic RINT1 variants lead to mitochondrial abnormalities.
(A) Representative images of mitochondrial network stained with MitoTracker Orange from control (CTL) and patient (P1 and P3) fibroblasts. Scale bar: 20 μm. A zoomed-in view is shown for each image; scale bar: 2 μm. (B) Quantification of the average mitochondrial size in control (CTL, n = 3) and patient (P1 and P3) fibroblasts. n > 20 cells for each genotype. (C) Quantification of mitochondrial number per cell in control (CTL, n = 3) and patient (P1 and P3) fibroblasts. n > 20 cells for each genotype. (D) Representative electron microscopy images displaying mitochondrial ultrastructure in control (CTL) and patient (P1 and P3) fibroblasts. Scale bar: 1 μm. A zoomed-in view is shown for each image; scale bar: 0.2 μm. Inter membrane space: blue; cristae: orange. (E) Percentage of damaged mitochondria in control (CTL, n = 3) and patient (P1 and P3) fibroblasts. n > 40 cells for each genotype. (FH) ATP content (F) and depolarized mitochondrial (G) levels in patient (P1 and P3) fibroblasts compared with control (CTL, n = 5) fibroblasts. (H) Quantification of the intracellular ROS using the H2DCFDA probe in patient (P1 and P3) fibroblasts compared with control (CTL, n = 5) fibroblasts. All data are shown as the mean ± SD. Results were obtained from 2 independent experiments. *P < 0.05, **P < 0.01, ***P < 0.001. Analysis of data were performed using 1-way ANOVA followed by Tukey’s test for multiple comparisons.
Figure 8
Figure 8. Glucose deprivation promotes LD accumulation and increases mitochondrial fragmentation.
(A) 3D rendering of a confocal image stack of control (CTL) and patient (P1 and P3) fibroblasts incubated with glucose (untreated) or without glucose (−Gluc) for 16 hours. Cells were labelled with an anti-TOMM20 antibody (mitochondria) and oil red O (LDs), and Imaris analysis was applied to detect LD-mitochondria surface contacts. Scale bar: 5 μm. A zoomed-in view is shown for each image; scale bar: 0.7 μm. (B) Quantification of the number of LDs per cell in the presence and absence of glucose. n > 50 cells for each genotype and condition. Patient (P1 and P3) and control (CTL, n = 3) fibroblasts. (C) Quantification of the percentage of LDs in contact with mitochondria per cell in control (CTL) and patient (P1 and P3) fibroblasts in the presence or absence of glucose. n > 50 cells for each genotype and condition. CTL=3. (D) Representative immunoblots of P-DRP1s616, P-DRP1s637, and DRP1 protein levels in control (CTL) and patient (P1 and P3) fibroblasts incubated with or without glucose (–Gluc). The total amount of α-tubulin (α-tub) was used as a loading control. (CTL n=6). Blots run in parallel using identical samples are shown. (E) Quantification of the P-DRP1S616/ P-DRP1S637 ratio relative to the control cells. All data are shown as the mean ± SD. Results were obtained from 2 independent experiments. *P < 0.05, **P < 0.01, ***P < 0.001. The data were analyzed by 2-way ANOVA followed by Tukey’s test for multiple comparisons.

References

    1. Olzmann JA, Carvalho P. Dynamics and functions of lipid droplets. Nat Rev Mol Cell Biol. 2019;20(3):137–155. doi: 10.1038/s41580-018-0085-z. - DOI - PMC - PubMed
    1. Gao M, et al. The biogenesis of lipid droplets: lipids take center stage. Prog Lipid Res. 2019;75:100989. doi: 10.1016/j.plipres.2019.100989. - DOI - PubMed
    1. Liu L, et al. Glial lipid droplets and ROS induced by mitochondrial defects promote neurodegeneration. Cell. 2015;160(1-2):177–190. doi: 10.1016/j.cell.2014.12.019. - DOI - PMC - PubMed
    1. Pelusi S, Valenti L. Hepatic fat as clinical outcome and therapeutic target for nonalcoholic fatty liver disease. Liver Int. 2019;39(2):250–256. doi: 10.1111/liv.13972. - DOI - PubMed
    1. Chen FJ, et al. CIDE family proteins control lipid homeostasis and the development of metabolic diseases. Traffic. 2020;21(1):94–105. doi: 10.1111/tra.12717. - DOI - PubMed

Publication types