. 2023 Aug 15;4(8):101127.
doi: 10.1016/j.xcrm.2023.101127. Epub 2023 Jul 17.

Picolinic acid is a broad-spectrum inhibitor of enveloped virus entry that restricts SARS-CoV-2 and influenza A virus in vivo

Affiliations

Picolinic acid is a broad-spectrum inhibitor of enveloped virus entry that restricts SARS-CoV-2 and influenza A virus in vivo

Rohan Narayan et al. Cell Rep Med. .

Abstract

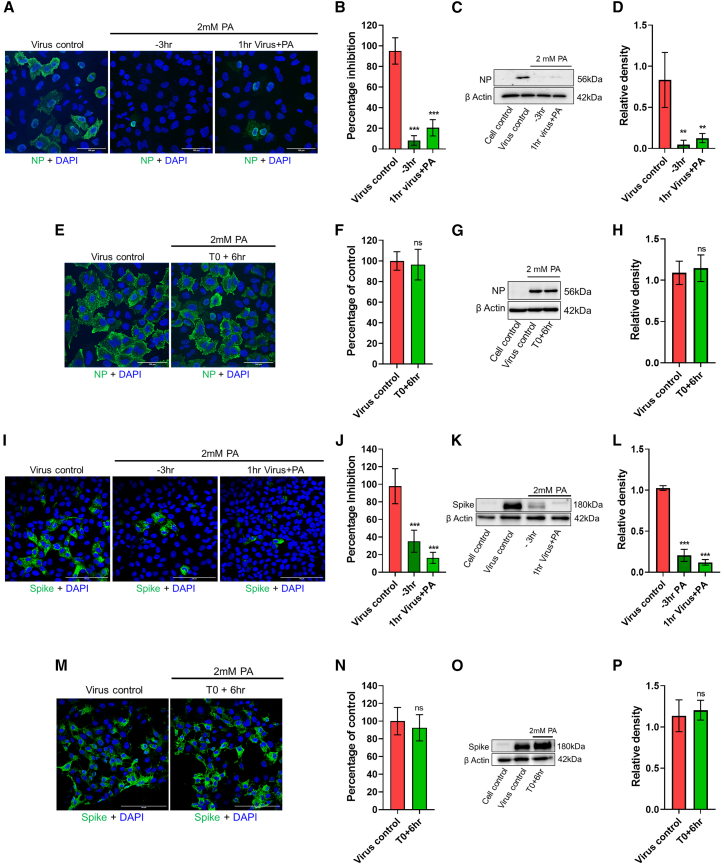
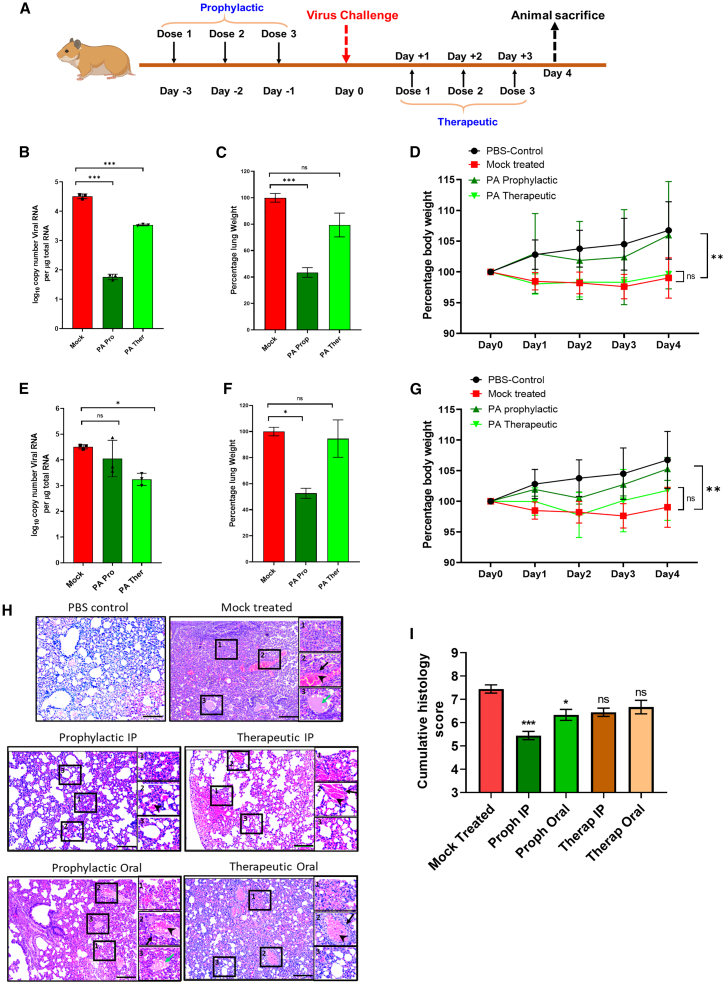
The COVID-19 pandemic highlights an urgent need for effective antivirals. Targeting host processes co-opted by viruses is an attractive antiviral strategy with a high resistance barrier. Picolinic acid (PA) is a tryptophan metabolite endogenously produced in mammals. Here, we report the broad-spectrum antiviral activity of PA against enveloped viruses, including severe acute respiratory syndrome coronavirus 2 (SARS-CoV-2), influenza A virus (IAV), flaviviruses, herpes simplex virus, and parainfluenza virus. Mechanistic studies reveal that PA inhibits enveloped virus entry by compromising viral membrane integrity, inhibiting virus-cellular membrane fusion, and interfering with cellular endocytosis. More importantly, in pre-clinical animal models, PA exhibits promising antiviral efficacy against SARS-CoV-2 and IAV. Overall, our data establish PA as a broad-spectrum antiviral with promising pre-clinical efficacy against pandemic viruses SARS-CoV-2 and IAV.

Keywords: SARS-CoV-2; antiviral; influenza; membrane fusion; picolinic acid; pre-clinical animal models; viral entry.


Conflict of interest statement

Declaration of interests The Indian Institute of Science has filed patents for the use of PA and its derivatives as broad-spectrum antiviral and listed S.T., R.N., A.B., and R.R. as inventors.

Figures

None
Graphical abstract
Figure 1
Figure 1
PA exhibits broad-spectrum antiviral activity against enveloped viruses (A) The chemical structure of picolinic acid (PA). (B) MDCK cells were pre-treated with increasing PA concentrations, infected with 0.001 MOI PR8 IAV. Results show percentage of infectious virus from supernatants 48 hpi quantified by plaque assay, along with cytotoxicity of the drug concentrations used. (C) Plaque assay results for 2 mM PA-treated MDCK cells infected with 0.001 MOI Cal/09 or HaLo IAV. (D) HEK293T-ACE2 cells were pre-treated for 3 h with increasing doses of PA as indicated and infected with 0.01 MOI SARS-CoV-2. Cells were collected at 48 hpi, and vRNA copy was estimated by qRT-PCR and plotted as a percentage of viral replication, with cytotoxicity. (E) Similar data in HEK293T-ACE2 cells using five SARS-CoV-2 VOCs treated with 2 mM PA, plotted as log10 vRNA copy number. (F and G) Datasets corresponding to Vero E6 cells infected with 0.001 MOI. (H and I) A549 cells were pre-treated with 2 mM PA for 3 h and infected with 0.1 MOI ZIKV or WNV. After 48 h, the infectious virus from the supernatant was quantified by plaque assay, and results are shown in (H) and (I). (J) A549 cells pre-treated with 2 mM PA were infected with different luciferase reporter viruses as indicated. Cells were harvested at 48 hpi, and luciferase expression was quantified using a TECAN plate reader. The data comprise 3 independent biological replicates, with datasets including 2–3 technical replicates. ∗p < 0.05; ∗∗p < 0.01; ∗∗∗p < 0.001; ns, non-significant, using Brown-Forsythe and Welch ANOVA with Dunnett’s T3 multiple comparison test or unpaired t test with Welch’s correction, wherever necessary. Error bars represent mean ± standard deviation (SD).
Figure 2
Figure 2
PA inhibits entry of influenza A virus and SARS-CoV-2 into host cells (A–D) In the time of addition assay, A549 cells were first pre-treated for 3 h with 2 mM PA (−3 h), infected with 5 MOI PR8 influenza A (IAV) in the presence of the drug, and collected 3 hpi. To test the direct effects of PA on virus particles, the virus inoculum was incubated with 2 mM PA for 1 h at 37°C and subsequently used for infection (1 h virus+PA). No additional PA was added here. (A and B) Confocal images showing viral NP-positive cells in green (A), and quantification of green cells (B). (C and D) Viral NP expression levels by western blot (C) and quantification of bands (D). (E–H) Untreated A549 cells were first infected with 5 MOI PR8 IAV, and treatment with 2 mM PA was done at 6 hpi (T0+6 h). Cells were then collected 3 h post-addition of the drug. Confocal images with quantification and western blot data are shown in (E) and (F) and (G) and (H). (I–P) Entry assays using 10 MOI SARS-CoV-2 in Vero E6 cells were followed as for IAV. Scale bar: 100 μm. The data comprise 3 independent biological replicates, with datasets including 2–3 technical replicates. ∗∗p < 0.01, ∗∗∗p < 0.001; ns, non-significant using two-tailed unpaired t test or Brown-Forsythe and Welch ANOVA with Dunnett’s T3 multiple comparison tests, where applicable. Error bars represent mean ± SD.
Figure 3
Figure 3
PA acts by targeting viral membrane and inhibiting viral-cellular membrane fusion (A) Schematic of virus-endosome fusion assay based on fluorescence self-quenching. Fluorescence associated with R18 probe-labeled virus particles is quenched due to dye-dye interactions. Upon virus entry, virus membrane fusion mediated by a drop in endosomal pH causes dispersion of the probe, resulting in increased fluorescence intensity due to de-quenching mediated by monomerization of the probe. (B) R18-labeled PR8 IAV particles were used to infect MDCK cells, and the increase in fluorescence intensity upon virus-endosome fusion was measured. (C and D) A549 cells pre-treated with 2 mM PA were infected with 10 MOI PR8 IAV on ice for 60 min, washed, and incubated at 37°C for another 60 min in the presence of the drug before fixing for IFA. (C) Confocal images show viral NP and cellular EEA-1 in green and red, respectively. The fluorescence intensity profile along the line regions of interest (ROIs; white) drawn from the nuclei was generated using Leica LAS X software (scale bar, 15 μm). (D) Shows Pearson’s correlation coefficients calculated from red and green channels. (E and F) TEM images for PR8 IAV particles treated with 2 mM PA for 1 h. Arrows indicate differences in viral membrane integrity between control and PA treatment. Statistics for (B) used one-way ANOVA with Dunnett’s multiple comparisons test at 60 min time point. An unpaired t test comparing medians was used in (D). The data comprise 3 independent biological replicates, with datasets including 2–3 technical replicates. Error bars represent mean ± SD.
Figure 4
Figure 4
PA does not affect infection by non-enveloped viruses (A) HeLa cells were either pre-treated for 3 h with 2 mM PA, infected with 10 MOI CVB3, and collected 3 h later (−3 h); treated during infection (T0); or virus and drug were incubated for 1 h and used for infection (1 h virus+PA). Data show CVB3 VP1 expression by western blot. (B) HeLa cells were infected with 10 MOI CVB3, PA treatment was done 6 hpi (T0+6 h), and cells were collected after 3 h. CVB3 VP1 expression by western blot is shown. (C) HeLa cells were pre-treated with increasing concentrations of PA and infected with 0.1 MOI CVB3, and 48 h later, the virus in supernatants was quantified by plaque assay. (D and E) HEK293T cells pre-treated with 2 mM PA were infected with RRV and, 12 hpi, were fixed and immunolabeled with rotavirus VP6 antibody. (D) shows representative IFA images showing virus-infected cells in green (scale bar, 200 μm), and percentage of infected cells was quantified by flow cytometry in (E). (F) HEK293T cells pre-treated with 2 mM PA were infected with 10 MOI Ad5-CMV-hACE2/RSV EGFP and harvested 24 h later, and GFP-positive cells were quantified by flow cytometry. (G) HEK293T cells pre-treated with 2 mM PA were infected with AAV6-EGFP particles in the presence of the drug at different volumes as indicated. After 48 h, GFP-positive cells were quantified by flow cytometry. (H) M. smegmatis cells in a 48-well plate were treated with increasing concentrations of PA as indicated, and OD600 measurements were taken up to 24 h. (I) Log-phase secondary bacterial cultures were treated with 1 mM PA at regular time intervals as indicated and infected with 10 MOI TM4 mycobacteriophage. OD600 measurements were taken up to 60 h. The data comprise 3 independent biological replicates, with datasets including 2–3 technical replicates. ∗∗∗p < 0.001; ns, non-significant using two-tailed unpaired t test or one-way ANOVA with Dunnett’s multiple comparisons wherever applicable. Error bars represent mean ± SD.
Figure 5
Figure 5
PA restricts IAV replication and pathogenesis in vivo (A) Schematic showing virus challenge and PA treatment schedule. (B) Body weight loss of animals upon infection and treatment monitored up to 14 dpi. Results show the mean percentage of body weight at day 0, n = 5 per group. (C) Survival of mice (n = 5 per group) was monitored for 14 dpi for all groups. (D) Plaque assay quantification of infectious virus titer from lungs (n = 5 per group). (E and F) Histology images for different groups and cumulative histology scoring (n = 5 per group). Criteria used for scoring and marked in the images include (1) peribronchiolar infiltration and necrosis, (2) vascular inflammation and infiltration with inflammatory cells, and (3) alveolar infiltration. An objective histopathological scoring system was performed by a veterinarian blinded to study groups. For (B), one-way ANOVA with Dunnett’s test was done comparing against the virus control group on day 5. Data shown are from 1 experiment. Statistics are shown for i.p. prophylactic (p = 0.0014) and oral prophylactic (p = 0.0252). For (C), log rank (Mantel-Cox) was performed. For (D), one-way ANOVA with Dunnett’s test was done comparing against the virus control group. Kruskal-Wallis multiple comparisons test was used in (F). ∗p < 0.05; ∗∗p < 0.01; ∗∗∗p < 0.001. ns, non-significant. Scale bar, 200μm. Error bars represent mean ± SE for (F). In all other data, error bars represent mean ± SD.
Figure 6
Figure 6
PA mitigates SARS-CoV-2 replication and pathogenesis in vivo (A) Schematic showing virus challenge and treatment schedule. (B–D) Dataset for PA administration via i.p. route showing (B) lung vRNA copy number (n = 3 per group), (C) total lung weight (n = 3 per group), and (D) body weight of animals up to 4 dpi (n = 4 per group). (E–G) Corresponding data for oral administration of PA. Bodyweight data are presented as the mean percentage of bodyweight measured at day 0 (n = 4 per group). (H and I) Histology images for all groups and clinical scoring, which was done based on the following criteria labeled within inset images: (1) alveolar edema, (2) vascular and perivascular infiltration, and (3) alveolar thickening and infiltration. Black arrows indicate vascular infiltration, arrowheads show perivascular infiltration, and green arrows show alveolar edema (n = 4 per group). An objective histopathological scoring system was performed by a veterinarian blinded to study groups. Data shown are from 1 experiment. One-way ANOVA with Dunnett’s multiple comparisons was performed. ∗p < 0.05; ∗∗p < 0.01. Kruskal-Wallis multiple comparisons test was used in (I). Scale bar, 200 μm. Error bars represent mean ± SE for (I). In all other data, error bars represent mean ± SD.

References

    1. Meganck R.M., Baric R.S. Developing therapeutic approaches for twenty-first-century emerging infectious viral diseases. Nat. Med. 2021;27:401–410. - PubMed
    1. Sanjuán R., Domingo-Calap P. Mechanisms of viral mutation. Cell. Mol. Life Sci. 2016;73:4433–4448. - PMC - PubMed
    1. Iketani S., Mohri H., Culbertson B., Hong S.J., Duan Y., Luck M.I., Annavajhala M.K., Guo Y., Sheng Z., Uhlemann A.C., et al. Multiple pathways for SARS-CoV-2 resistance to nirmatrelvir. Nature. 2023;613:558–564. - PMC - PubMed
    1. Sheu T.G., Fry A.M., Garten R.J., Deyde V.M., Shwe T., Bullion L., Peebles P.J., Li Y., Klimov A.I., Gubareva L.V. Dual resistance to adamantanes and oseltamivir among seasonal influenza A(H1N1) viruses: 2008-2010. J. Infect. Dis. 2011;203:13–17. - PMC - PubMed
    1. Lou Z., Sun Y., Rao Z. Current progress in antiviral strategies. Trends Pharmacol. Sci. 2014;35:86–102. - PMC - PubMed

Publication types