

Immune suppressive microenvironment in liver metastases contributes to organ-specific response of immunotherapy in advanced non-small cell lung cancer
- PMID: 37463790
- PMCID: PMC10357800
- DOI: 10.1136/jitc-2023-007218
Immune suppressive microenvironment in liver metastases contributes to organ-specific response of immunotherapy in advanced non-small cell lung cancer
Abstract
Background: The liver is a frequent site of metastases and liver metastases (LM) correlate with diminished immunotherapy efficacy in non-small cell lung cancer (NSCLC). This study aimed to analyze whether tumor response to immunotherapy differs between pulmonary lesions (PL) and LM in NSCLC and to explore potential mechanisms through multiomics analysis.
Methods: This observational longitudinal clinical cohort study included patients with NSCLC with LM receiving immunotherapy was conducted to evaluate organ-specific tumor response of PL and LM. We collected paired PL and LM tumor samples to analyze the organ-specific difference using whole-exome sequencing, RNA sequencing, and multiplex immunohistochemistry.
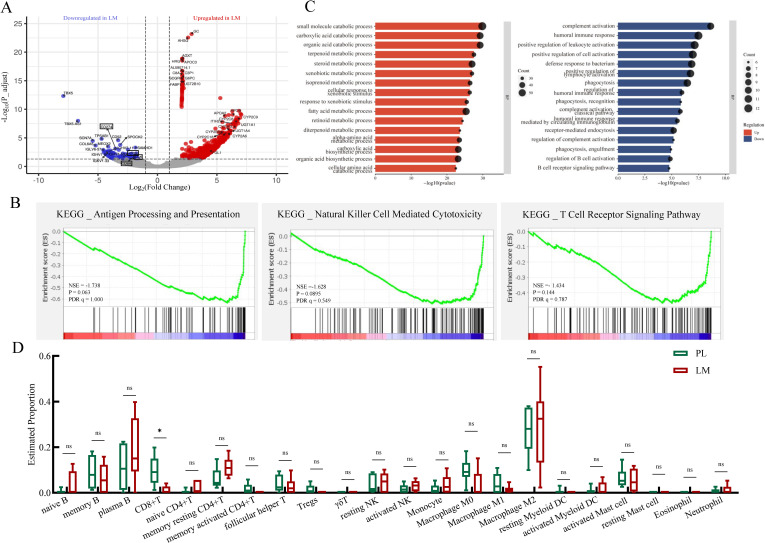
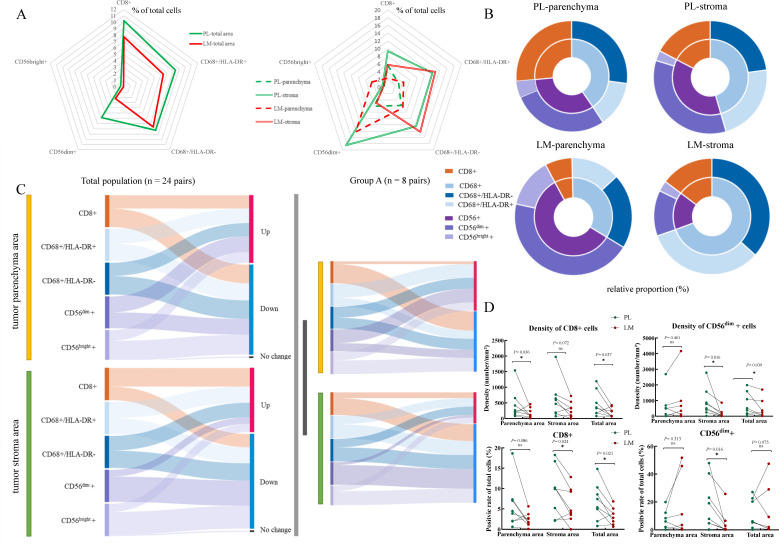
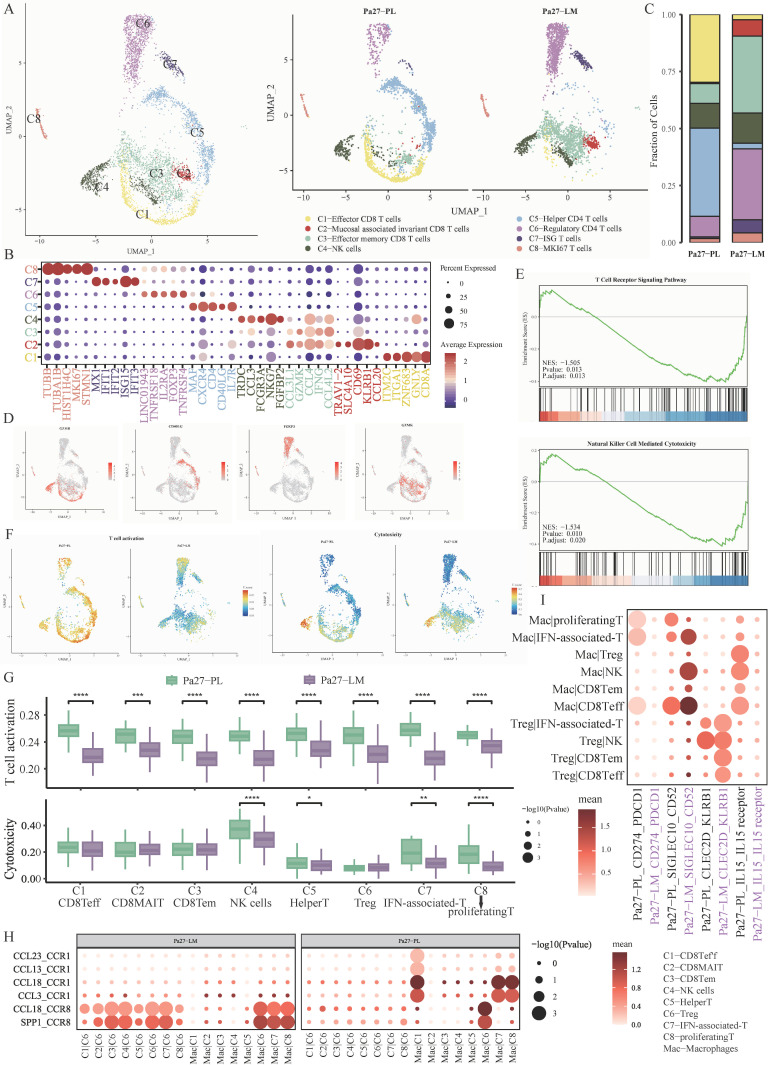
Results: A total of 52 patients with NSCLC with LM were enrolled to evaluate the organ-specific response of immunotherapy. The objective response rate (21.1% vs 32.7%) and disease control rate of LM were lower than that of PL (67.3% vs 86.5%). One-third of patients showed mixed response, among whom 88.2% (15/17) presented with LM increasing, but PL decreasing, while the others had the opposite pattern (p=0.002). In another independent cohort, 27 pairs of matched PL and LM tumor samples from the same individuals, including six simultaneously collected pairs, were included in the translational part. Genomic landscapes profiling revealed similar somatic mutations, tumor mutational burden, and neoantigen number between PL and LM. Bulk-RNA sequencing showed immune activation-related genes including CD8A, LCK, and ICOS were downregulated in LM. The antigen processing and presentation, natural killer (NK) cell-mediated cytotoxicity and T-cell receptor signaling pathway were enriched in PL compared with LM. Multiplex immunohistochemistry detected significantly lower fractions of CD8+ cells (p=0.036) and CD56dim+ cells (p=0.016) in LM compared with PL. Single-cell RNA sequencing also characterized lower effector CD8+ T cells activation and NK cells cytotoxicity in LM.
Conclusions: Compared with PL, LM presents an inferior organ-specific tumor response to immunotherapy. PL and LM showed limited heterogeneity in the genomic landscape, while the LM tumor microenvironment displayed lower levels of immune activation and infiltration than PL, which might contribute to developing precise immunotherapy strategies for patients with NSCLC with LM.
Keywords: Immunotherapy; Liver Neoplasms; Lung Neoplasms; Non-Small Cell Lung Cancer; Tumor Microenvironment.
© Author(s) (or their employer(s)) 2023. Re-use permitted under CC BY-NC. No commercial re-use. See rights and permissions. Published by BMJ.
Conflict of interest statement
Competing interests: QZ reports honoraria from AstraZeneca, Boehringer Ingelheim, BMS, EliLilly, MSD, Pfizer, Roche, and Sanofi, outside the submitted work. Y-LW reports personal financial interests: consulting and advisory services, speaking engagements of Roche, AstraZeneca, EliLilly, Boehringer Ingelheim, Sanofi, MSD, and BMS. LY is an employee of Nanjing Geenseeq Technology. All remaining authors declared no competing interests.
Figures


Similar articles
-
Comprehensive single-cell atlas of colorectal neuroendocrine tumors with liver metastases: unraveling tumor microenvironment heterogeneity between primary lesions and metastases.Mol Cancer. 2025 Jan 21;24(1):28. doi: 10.1186/s12943-025-02231-y. Mol Cancer. 2025. PMID: 39838423 Free PMC article.
-
Molecular heterogeneity of anti-PD-1/PD-L1 immunotherapy efficacy is correlated with tumor immune microenvironment in East Asian patients with non-small cell lung cancer.Cancer Biol Med. 2020 Aug 15;17(3):768-781. doi: 10.20892/j.issn.2095-3941.2020.0121. Cancer Biol Med. 2020. PMID: 32944405 Free PMC article.
-
Genomic and transcriptional alterations in first-line chemotherapy exert a potentially unfavorable influence on subsequent immunotherapy in NSCLC.Theranostics. 2021 May 13;11(14):7092-7109. doi: 10.7150/thno.58039. eCollection 2021. Theranostics. 2021. PMID: 34093873 Free PMC article.
-
Immunotherapy in NSCLC patients with brain metastases. Understanding brain tumor microenvironment and dissecting outcomes from immune checkpoint blockade in the clinic.Cancer Treat Rev. 2020 Sep;89:102067. doi: 10.1016/j.ctrv.2020.102067. Epub 2020 Jul 7. Cancer Treat Rev. 2020. PMID: 32682248 Review.
-
Evolving landscape of treatments targeting the microenvironment of liver metastases in non-small cell lung cancer.Chin Med J (Engl). 2024 May 5;137(9):1019-1032. doi: 10.1097/CM9.0000000000002981. Epub 2024 Jan 22. Chin Med J (Engl). 2024. PMID: 38251678 Free PMC article. Review.
Cited by
-
Clinical and dynamic circulating cytokines profile features of long-term progression-free survival benefit to immune checkpoint inhibitors in advanced non-small cell lung cancer.Cancer Immunol Immunother. 2025 Apr 17;74(6):173. doi: 10.1007/s00262-025-03984-7. Cancer Immunol Immunother. 2025. PMID: 40244472 Free PMC article.
-
Poor efficacy of immune checkpoint inhibitor treatment in advanced thymic carcinoma patients with liver metastases.Ther Adv Med Oncol. 2024 May 28;16:17588359241253127. doi: 10.1177/17588359241253127. eCollection 2024. Ther Adv Med Oncol. 2024. PMID: 38812990 Free PMC article.
-
Site-Specific Response and Resistance Patterns in Patients with Advanced Non-Small-Cell Lung Cancer Treated with First-Line Systemic Therapy.Cancers (Basel). 2024 Jun 4;16(11):2136. doi: 10.3390/cancers16112136. Cancers (Basel). 2024. PMID: 38893255 Free PMC article.
-
Dissociated response and treatment outcome with immune checkpoint blockade in advanced cancer.Sci Rep. 2024 Dec 30;14(1):32147. doi: 10.1038/s41598-024-84009-8. Sci Rep. 2024. PMID: 39738789 Free PMC article.
-
Selinexor Reduces the Immunosuppression of Macrophages and Synergizes With CD19 CAR-T Cells Against B-Cell Lymphoma.Cancer Sci. 2025 Sep;116(9):2388-2399. doi: 10.1111/cas.70123. Epub 2025 Jun 17. Cancer Sci. 2025. PMID: 40528279 Free PMC article.
References
Publication types
MeSH terms
LinkOut - more resources
Full Text Sources
Medical
Research Materials
Miscellaneous