. 2023 Jul 18;14(1):4020.
doi: 10.1038/s41467-023-39532-z.

Ancient dolphin genomes reveal rapid repeated adaptation to coastal waters

Affiliations

Ancient dolphin genomes reveal rapid repeated adaptation to coastal waters

Marie Louis et al. Nat Commun. .

Abstract

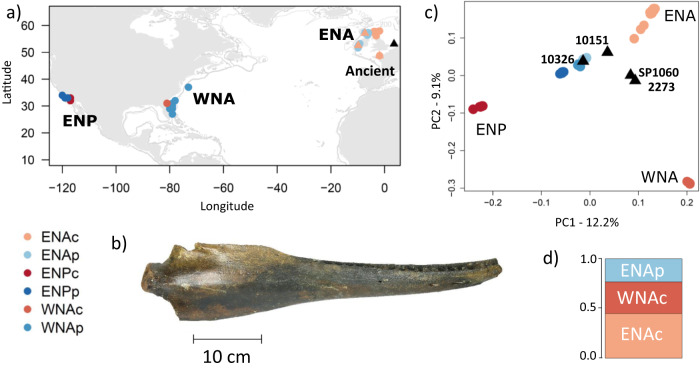
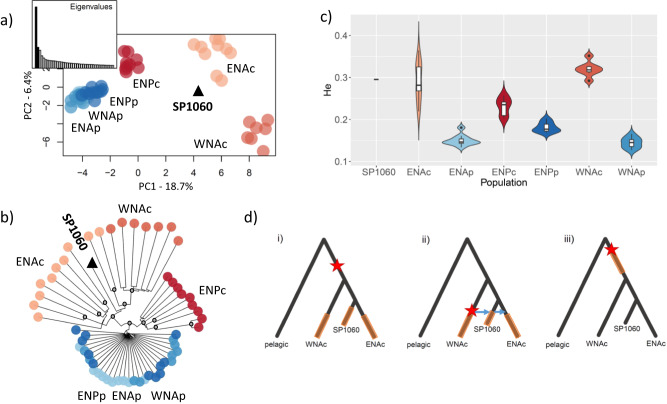
Parallel evolution provides strong evidence of adaptation by natural selection due to local environmental variation. Yet, the chronology, and mode of the process of parallel evolution remains debated. Here, we harness the temporal resolution of paleogenomics to address these long-standing questions, by comparing genomes originating from the mid-Holocene (8610-5626 years before present, BP) to contemporary pairs of coastal-pelagic ecotypes of bottlenose dolphin. We find that the affinity of ancient samples to coastal populations increases as the age of the samples decreases. We assess the youngest genome (5626 years BP) at sites previously inferred to be under parallel selection to coastal habitats and find it contained coastal-associated genotypes. Thus, coastal-associated variants rose to detectable frequencies close to the emergence of coastal habitat. Admixture graph analyses reveal a reticulate evolutionary history between pelagic and coastal populations, sharing standing genetic variation that facilitated rapid adaptation to newly emerged coastal habitats.


Conflict of interest statement

The authors declare no competing interests.

Figures

Fig. 1
Fig. 1. Sampling locations and ancestry of ancient and contemporary bottlenose dolphin individuals.
a Map of sample locations of the four ancient (black triangle) and 60 contemporary coastal (denoted with postscript ‘c’ and shown in shades of red) and pelagic (postscript ‘p’ and in shades of blue) bottlenose dolphins in the eastern North Atlantic (ENAc and ENAp), western North Atlantic (WNAc and WNAp) and eastern North Pacific (ENPc and ENPp). Calibrated radiocarbon-dated the age of the ancient samples is as follows in years before present (BP): NMR10326: 8,518-8,346, NMR2273: 7,745-7,572, NMR10151: 7,228-7,036, SP1060: 5,896-5,723; 'NMR' is not indicated on the figure for readability. b Mandible of a subfossil bottlenose dolphin (sample NMR10326) included in this study. c Principal component (PC) analysis of pseudo-haploid data from four ancient samples projected on the PCs of 60 contemporary samples, mapped to the killer whale (Orcinus orca) reference genome to avoid reference bias and removing transitions, showing first and second PCs based on 624,969 SNPs. The proportion of genetic variance captured by each component is indicated in the axes (see also Figs. S4–S8). d Ancestry proportions of sample SP1060 identified using factorial analysis. Source data are provided in the Source Data file.
Fig. 2
Fig. 2. Evolutionary relationships between the ancient individual SP1060 (5,979-5,626 years BP) and the North Atlantic contemporary bottlenose dolphin populations as inferred using qpBrute.
Solid arrows indicate the relationships between populations/samples and the numbers on their right side correspond to the estimated genetic drift represented by the arrow. This graph was the only one of all possible graph combinations presenting no outlier f-statistics (i.e. all |Z| were <3). Populations include eastern North Atlantic coastal (ENAc) and pelagic (ENAp) populations, western North Atlantic coastal (WNAc) and pelagic (WNAp) populations, and the outgroup is the killer whale (KW). Note that the drift value for SP1060 is inflated due to being a single and lower-coverage sample. This inflation is because all alleles found in SP1060 are treated as fixed, therefore singletons and rare alleles in SP1060 that were not shared or were rare in this ancestral population are treated as high frequency or fixed alleles, inflating estimates of drift along the branch to SP1060. Dashed lines are admixture edges and the arrows indicate the inferred direction of admixture, with the numbers reflecting the percentage of ancestry deriving from each lineage. The graph reveals a first split between the lineage that gave rise to the contemporary coastal populations and SP1060, and the lineage that gave rise to the majority of ancestry in contemporary pelagic populations. The WNA coastal and SP1060 are shown as independent lineages. The ENA coastal is depicted as a clade whose ancestry is a mixture of the two ancestral groups leading to SP1060 and WNA coastal. Ancient sample SP1060 is therefore not a direct ancestor of the contemporary ENA coastal dolphins. The ancestry of both North Atlantic contemporary pelagic populations appears to be an admixture of ~30% of the lineage giving rise to the coastal populations, and ~70% from a deeply divergent lineage. Source data are provided in the DataSuds repository.
Fig. 3
Fig. 3. Patterns of genetic variation of the SNPs under repeated selection to coastal habitat in contemporary common bottlenose dolphin individuals and ancient individual SP1060.
These include 2122 SNPs with no missing data in SP1060 out of the 7165 SNPs identified in ref. , mapped to the bottlenose dolphin reference genome. Populations include coastal and pelagic ecotypes from the eastern North Atlantic (ENAc and ENAp), western North Atlantic (WNAc and WNAp) and eastern North Pacific (ENPc and ENPp). a Principal component analysis including Eigenvalues; the proportion of genetic variance captured by each component is indicated in the axes; and b Neighbour-joining tree showing the genetic structure of the common bottlenose dolphin samples for this particular SNP set, with grey circles indicating bootstrap node support values higher than 95%. c Heterozygosity (He) estimated for all the sites under parallel linked selection for each population using angsd 0.921; the violin plots indicate the kernel probability density of the data, the box indicates the interquartile range, and the horizontal marker indicates the median of the data. There is only one data point for SP1060. Heterozygosity is significantly higher in coastal than pelagic populations as shown by two-sided t-tests or Wilcoxon tests in the ENP (ENPc n = 9, ENPp n = 11, t = 6.54, df = 12.07, P = 2.68e-05), ENA (ENAc n = 13, ENAp n = 10, W = 130, P = 1.75e-06) and WNA (WNAc n = 7, WNAp n = 10, t = 22.23, df = 10.01, P = 7.45e-10). Note that genome-wide coastal populations have less diversity than pelagic populations as described in ref. . SP1060 shows a mean He of 0.295 which is very close to the mean of 0.291 for ENAc. The same figure with all the data points can be found in Fig. S12b, d Illustrations of the three possible scenarios of parallel and non-parallel selection based on ref. . The star represents a beneficial mutation and the brown bars the period of time during which selection acted upon standing genetic variation. Scenario (i) highlights standing genetic variation originating in the ancestral population and then being targeted by selection independently in each derived population. Scenario (ii) corresponds to a scenario where standing genetic variation originated in one derived coastal population and was then shared through gene flow with the other coastal populations. Subsequently, selection acted independently in each coastal population to increase the frequency of the adaptive variants. Scenarios (i) and (ii) represent parallel selection. Scenario (iii) shows selection acting upon standing genetic variation in a shared ancestral population. This does not fit parallel selection due to the non-independence of adaptive allele frequencies in the derived populations. Source data are provided in the DataSuds repository and in the Source Data file.

References

    1. Barrett RDH, Schluter D. Adaptation from standing genetic variation. Trends Ecol. Evol. 2008;23:38–44. doi: 10.1016/j.tree.2007.09.008. - DOI - PubMed
    1. Waters JM, McCulloch GA. Reinventing the wheel? Reassessing the roles of gene flow, sorting and convergence in repeated evolution. Mol. Ecol. 2021;30:4162–4172. doi: 10.1111/mec.16018. - DOI - PubMed
    1. Roesti M, Gavrilets S, Hendry AP, Salzburger W, Berner D. The genomic signature of parallel adaptation from shared genetic variation. Mol. Ecol. 2014;23:3944–3956. doi: 10.1111/mec.12720. - DOI - PMC - PubMed
    1. Lee KM, Coop G. Population genomics perspectives on convergent adaptation. Philos. Trans. R. Soc. Lond. B Biol. Sci. 2019;374:20180236. doi: 10.1098/rstb.2018.0236. - DOI - PMC - PubMed
    1. Van Belleghem SM, et al. Evolution at two time frames: polymorphisms from an ancient singular divergence event fuel contemporary parallel evolution. PLoS Genet. 2018;14:e1007796. doi: 10.1371/journal.pgen.1007796. - DOI - PMC - PubMed

Publication types