. 2023 Jul 18;14(1):4308.
doi: 10.1038/s41467-023-39765-y.

Next generation pan-cancer blood proteome profiling using proximity extension assay

Affiliations

Next generation pan-cancer blood proteome profiling using proximity extension assay

María Bueno Álvez et al. Nat Commun. .

Abstract

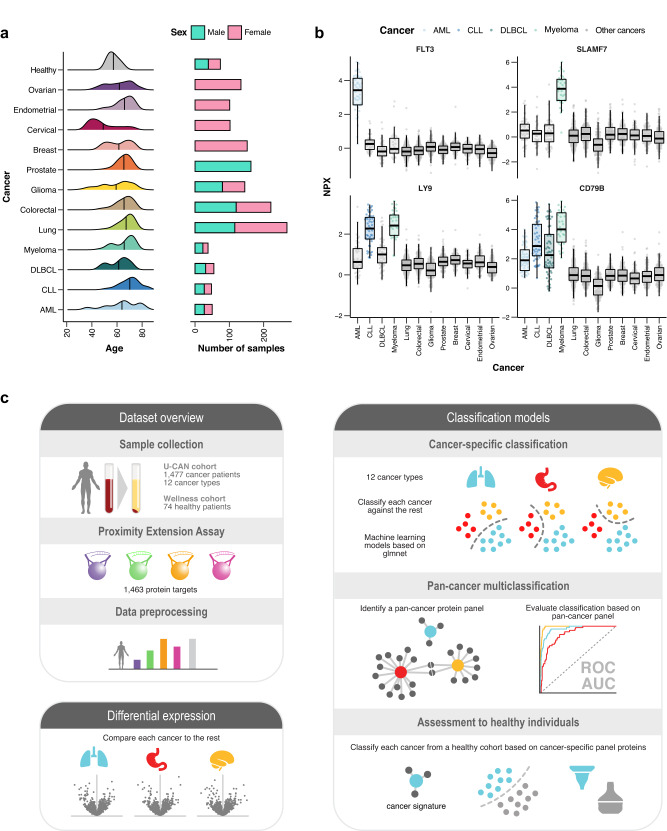
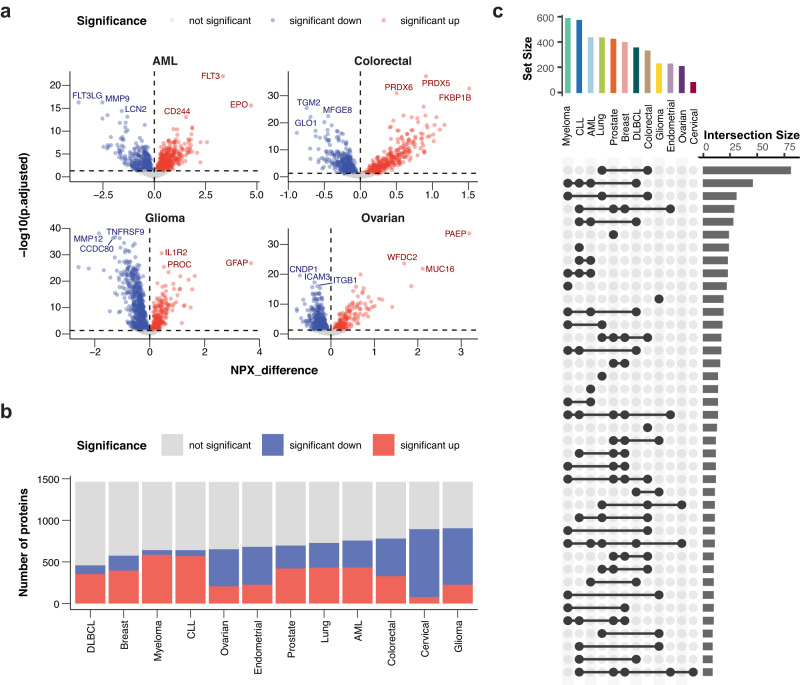
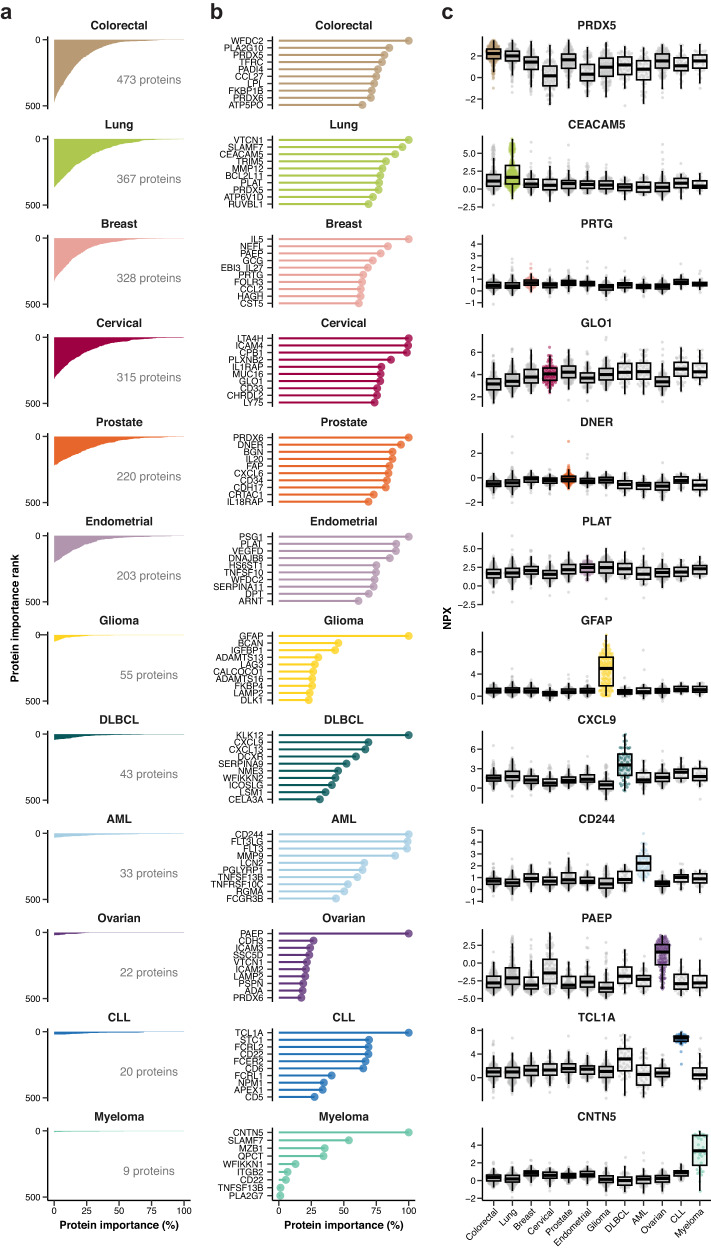
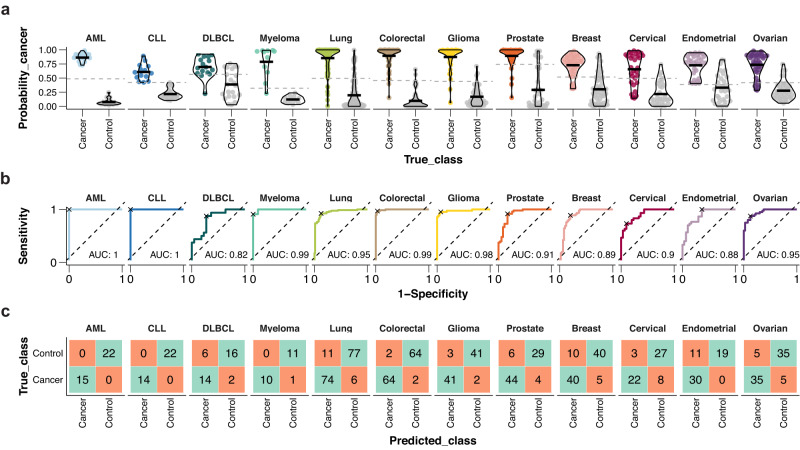
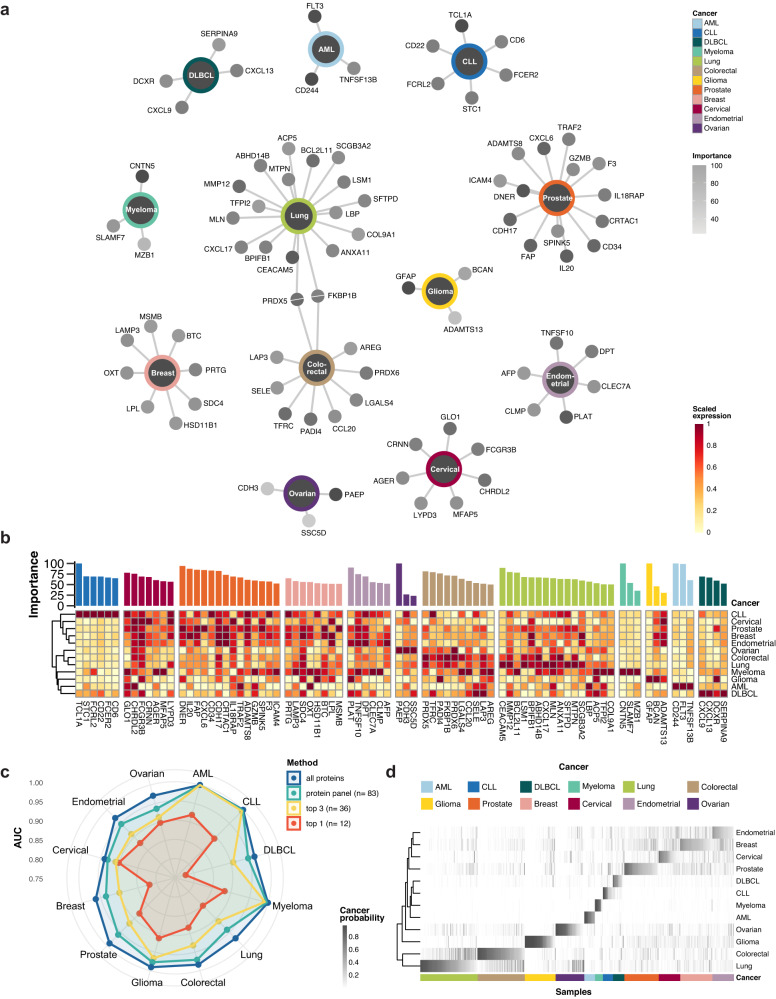
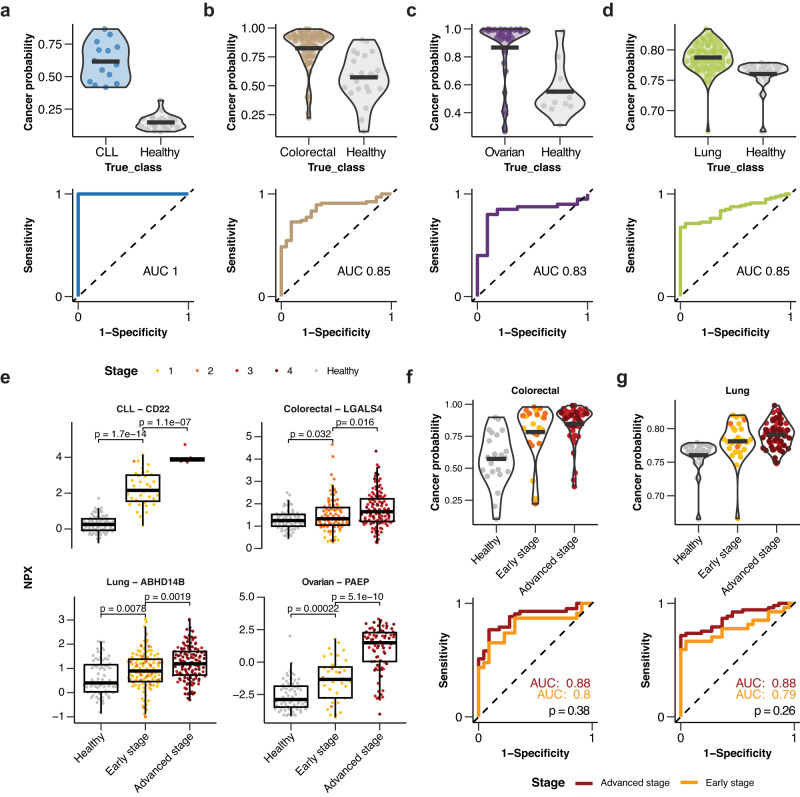
A comprehensive characterization of blood proteome profiles in cancer patients can contribute to a better understanding of the disease etiology, resulting in earlier diagnosis, risk stratification and better monitoring of the different cancer subtypes. Here, we describe the use of next generation protein profiling to explore the proteome signature in blood across patients representing many of the major cancer types. Plasma profiles of 1463 proteins from more than 1400 cancer patients are measured in minute amounts of blood collected at the time of diagnosis and before treatment. An open access Disease Blood Atlas resource allows the exploration of the individual protein profiles in blood collected from the individual cancer patients. We also present studies in which classification models based on machine learning have been used for the identification of a set of proteins associated with each of the analyzed cancers. The implication for cancer precision medicine of next generation plasma profiling is discussed.


Conflict of interest statement

The authors declare no competing interests.

Figures

Fig. 1
Fig. 1. Overview of the pan-cancer study.
a Age distribution and number of patients included for each cancer and the healthy cohort. b Examples of protein levels for four example proteins across the 12 cancer types. Boxplots summarize the median value, upper and lower hinges corresponding to the first and third quartiles, and whiskers indicating the minimum and maximum values within 1.5 times the IQR. Individual data points are presented for each cancer group, with n = 1462, n = 1402, n = 1462, and n = 1399 independent samples for CD79B, FLT3, LY9, and SLAMF7, respectively. c Schematic representation of the workflow used in this study. Blood plasma from 1477 cancer patients and 74 healthy individuals was analyzed using Proximity Extension Assay. Differential expression analysis and classification models was used to compare one cancer to all other cancers and identify cancer-associated proteins. The models for cancer classification were generated using machine learning techniques (70% of the data in training set). The resulting pan-cancer protein panel was used in a pan-cancer multiclassification strategy, and the performance tested against a test set (30% of the data) and ultimately compared against healthy individuals. Source data are provided as a Source data file. AML acute myeloid leukemia, CLL chronic lymphocytic leukemia, DLBCL diffuse large B-cell lymphoma.
Fig. 2
Fig. 2. Differential expression analysis.
a Volcano plots summarizing the differential expression results for AML, colorectal, glioma, and ovarian cancer. Corresponding results for all 12 cancers are shown in Fig. S2. P-values are calculated using a two-sided t-test, with Benjamini-Hochberg multiple hypothesis correction. b Barplot showing the number of proteins significantly upregulated, significantly downregulated, or with no significant differential expression for all cancer types. c Upset plot showing the number of upregulated proteins shared by the different cancer types. The top barplot shows the total number of upregulated proteins per cancer. Source data are provided as a Source data file. AML acute myeloid leukemia, CLL chronic lymphocytic leukemia, DLBCL diffuse large B-cell lymphoma.
Fig. 3
Fig. 3. Estimation of protein importance by the cancer classification models.
a Protein importance rank profiles for each cancer model. For each cancer, the first 500 proteins in the importance rank are included (y-axis), and the corresponding importance score is shown (x-axis). The total number of proteins with a positive score is indicated for each of the cancers. b Lollipop chart showing the top ten scoring proteins in each cancer model, with the exception of myeloma with only nine positive proteins. c Selected examples of upregulated proteins for each of the cancer types. The colored boxes indicate the cancer type where the protein is upregulated, and gray shading indicates the absence of upregulation. Boxplots summarize the median value, upper and lower hinges corresponding to the first and third quartiles, and whiskers indicating the minimum and maximum values within 1.5 times the IQR. Individual data points are presented for each cancer group, with n = 1462, n = 1402, n = 1457, n = 1413, n = 1432, n = 1476, n = 1402, n = 1432, n = 1462, n = 1389, n = 1389, and n = 1477, for PRDX5, CEACAM5, PRTG, GLO1, DNER, PLAT, GFAP, CXCL9, CD244, PAEP, TCL1A, and CNTN5, respectively. Source data are provided as a Source data file. AML acute myeloid leukemia, CLL chronic lymphocytic leukemia, DLBCL diffuse large B-cell lymphoma.
Fig. 4
Fig. 4. Performance of the classification models for each cancer on the test set.
a Cancer probabilities for samples in the test set per cancer. The optimal probability cutoffs are indicated with a dashed gray line. b ROC curves and corresponding AUC. The sensitivity and specificity corresponding to the optimal probability cutoff is marked with an x. c Confusion matrices summarizing the classification results for each cancer at the given probability cutoff. The optimal probability cutoff was calculated using the Youden method. Source data are provided as a Source data file. AML acute myeloid leukemia, CLL chronic lymphocytic leukemia, DLBCL diffuse large B-cell lymphoma.
Fig. 5
Fig. 5. Pan-cancer protein panel and multiclassification of the pan-cancer test cohort.
a Nework visualization of proteins included in the panel. Protein nodes are colored according to the importance score in the specific cancer. b Summarized expression profiles of panel proteins across the cancer types. For each protein, the scaled expression is calculated as the average NPX per cancer which is rescaled between 0 and 1. c Summary of the AUC for the different cancers based on models run with four different protein selections. “Top 1” and “top 3” refers to the one or three proteins with the highest importance scores for each of the individual 12 cancers models ran in the previous step, respectively, resulting in sets of 12 and 36 proteins as input to the multiclassification model. d Cancer probabilities for samples in the test set in the pan-cancer classification model using the panel of 83 proteins. Source data are provided as a Source data file. AML acute myeloid leukemia, CLL chronic lymphocytic leukemia, DLBCL diffuse large B-cell lymphoma.
Fig. 6
Fig. 6. Classification of cancer samples against a healthy cohort based on the selected protein panel.
Model results showing the cancer probability for cancer and healthy individuals from the test set (top) and the ROC curve with AUC score (bottom) for a CLL, b colorectal cancer, c ovarian cancer, d lung cancer. e Protein levels of four different proteins for cancer samples stratified into early (stage 1–2) or advanced (stage 3–4) stages as well as the healthy cohort. Boxplots summarize the median value, upper and lower hinges corresponding to the first and third quartiles, and whiskers indicating the minimum and maximum values within 1.5 times the IQR. Individual data points are presented for each cancer group, with n = 327, n = 114, n = 289, and n = 200, for ABHD14B, CD22, LGALS4, and PAEP, respectively. P-values are calculated using a two-sided t-test to compare the group means. Model results showing the cancer probability for cancer samples stratified by stage (early or advanced) and healthy individuals (top) and the ROC curve with AUC score (bottom) for f colorectal cancer and g lung cancer. The p-values are calculated using unpaired DeLong’s test. Source data are provided as a Source data file. CLL chronic lymphocytic leukemia.

References

    1. Crosby D, et al. Early detection of cancer. Science. 2022;375:eaay9040. doi: 10.1126/science.aay9040. - DOI - PubMed
    1. Cronin, K. A. et al. Annual report to the nation on the status of cancer, part 1: National cancer statistics. Cancer128, 4251–4284 (2022). - PMC - PubMed
    1. Ilic D, et al. Prostate cancer screening with prostate-specific antigen (PSA) test: a systematic review and meta-analysis. BMJ. 2018;362:k3519. doi: 10.1136/bmj.k3519. - DOI - PMC - PubMed
    1. Ladabaum U, Dominitz JA, Kahi C, Schoen RE. Strategies for colorectal cancer screening. Gastroenterology. 2020;158:418–432. doi: 10.1053/j.gastro.2019.06.043. - DOI - PubMed
    1. Yala A, et al. Optimizing risk-based breast cancer screening policies with reinforcement learning. Nat. Med. 2022;28:136–143. doi: 10.1038/s41591-021-01599-w. - DOI - PubMed

Publication types