. 2023 Jul 18;14(1):4283.
doi: 10.1038/s41467-023-39970-9.

An optimized Nurr1 agonist provides disease-modifying effects in Parkinson's disease models

Affiliations

An optimized Nurr1 agonist provides disease-modifying effects in Parkinson's disease models

Woori Kim et al. Nat Commun. .

Abstract

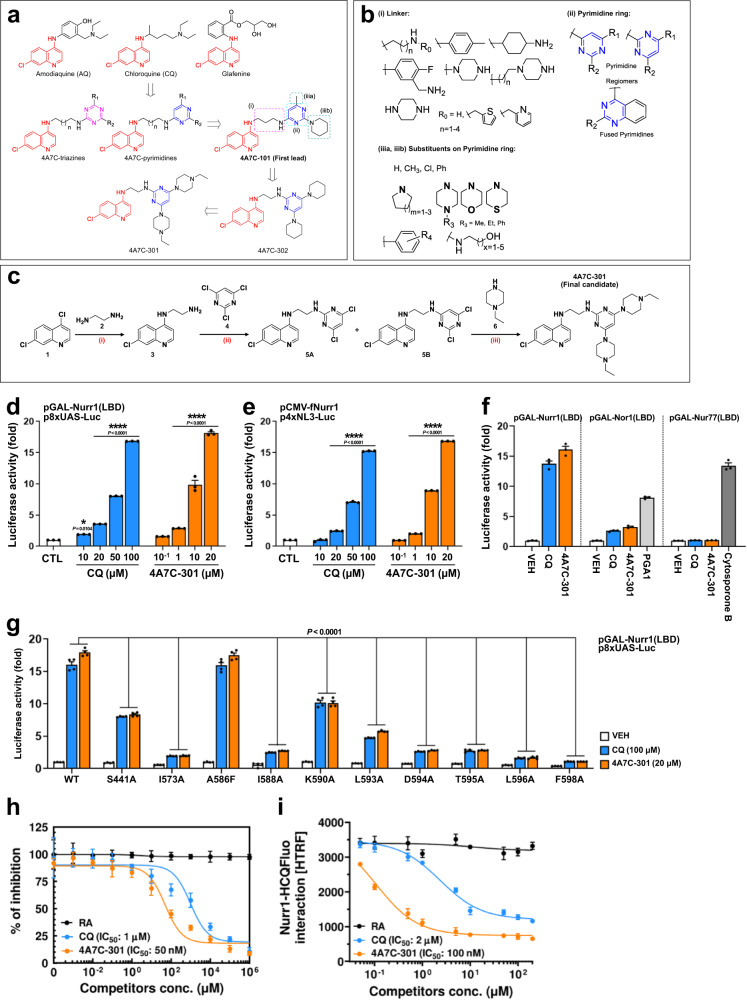
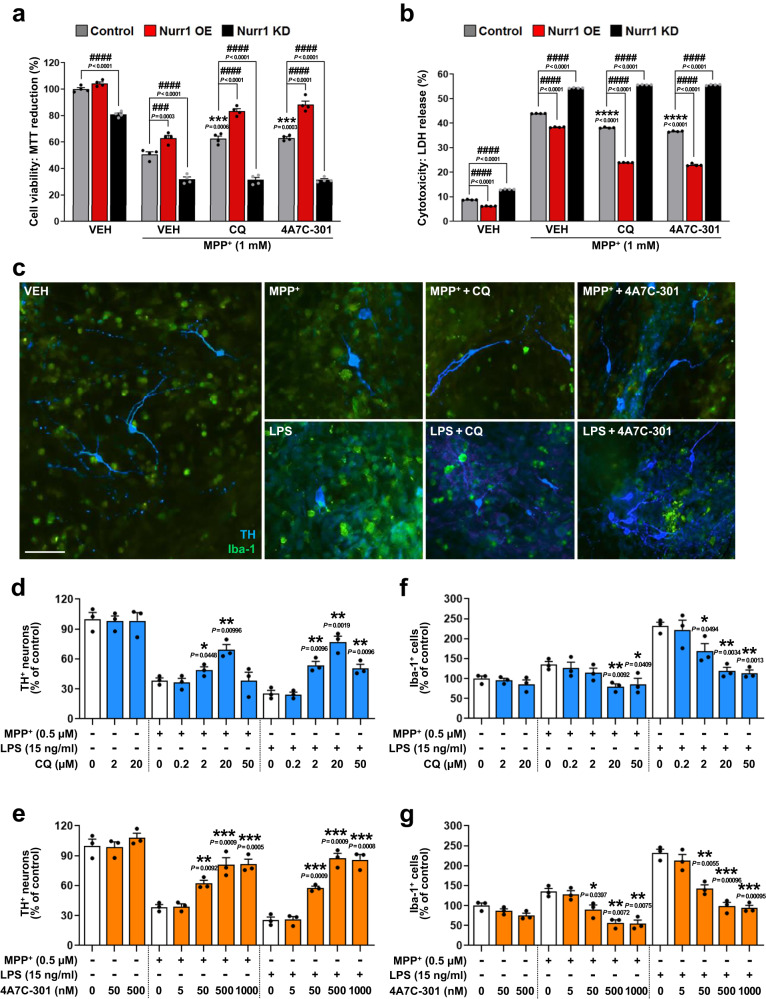
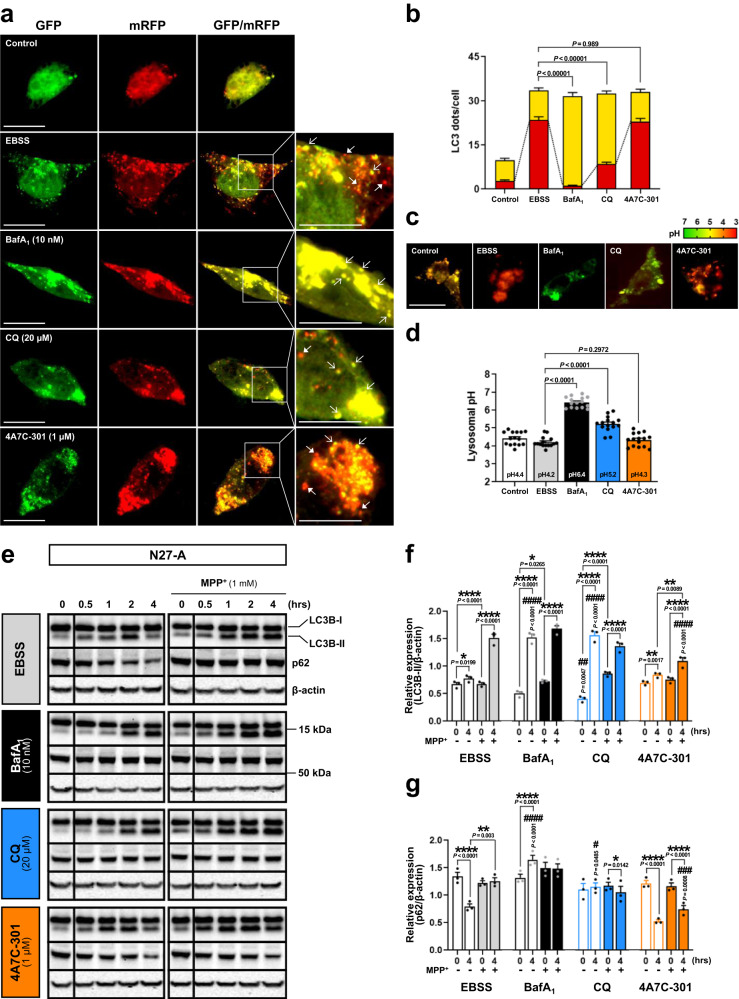
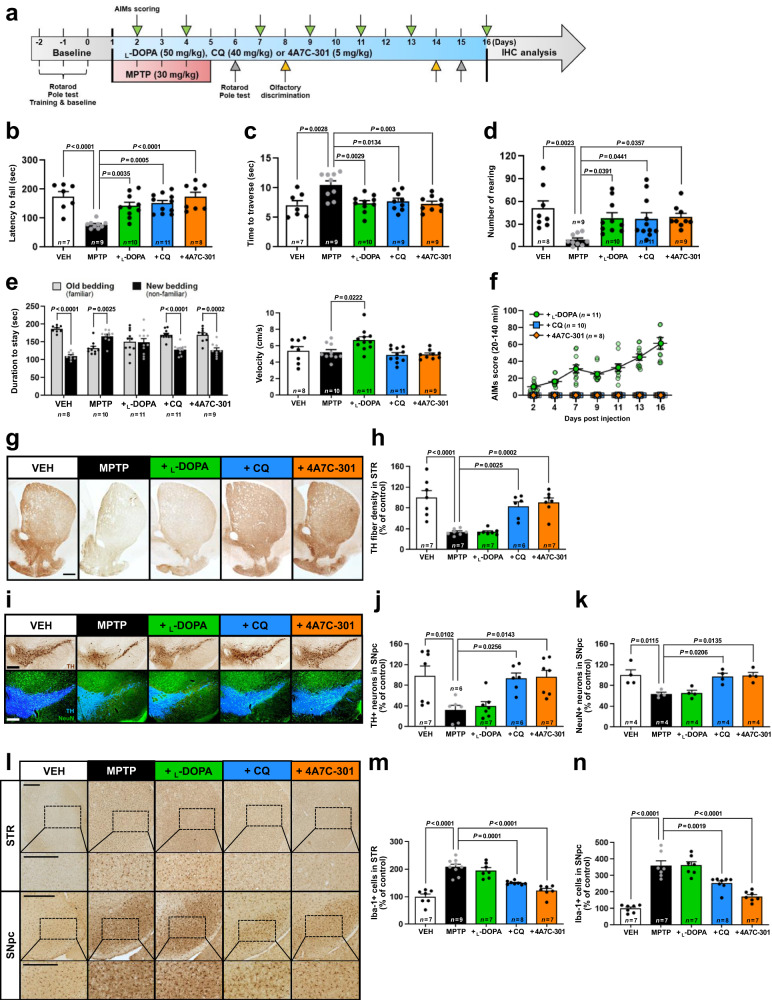
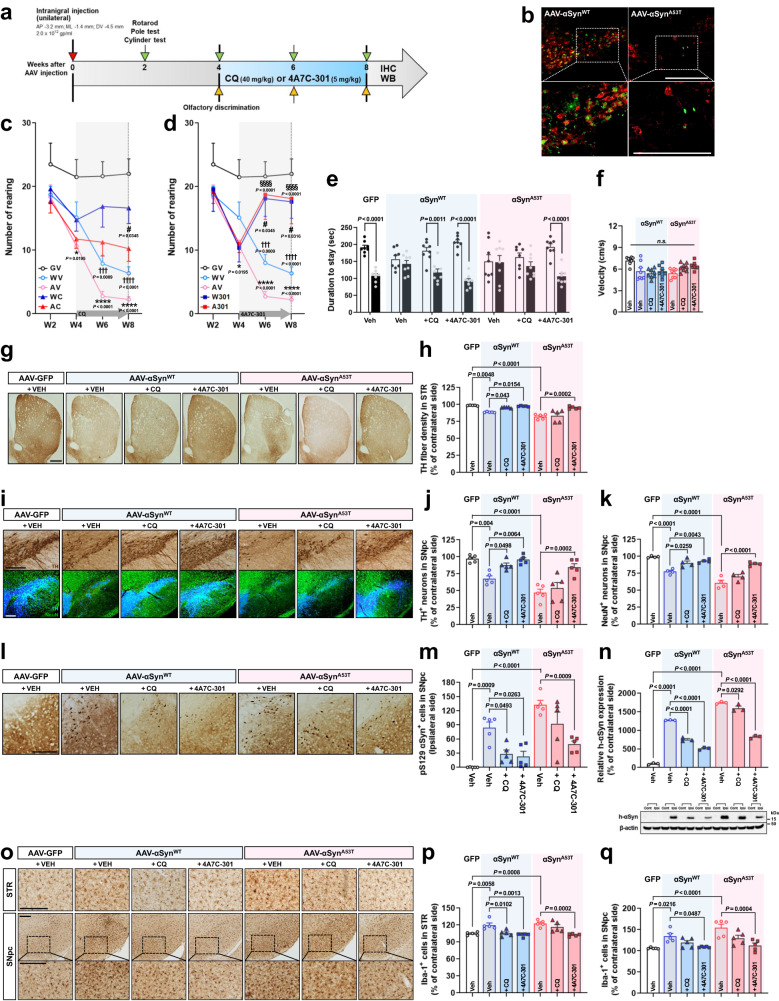
The nuclear receptor, Nurr1, is critical for both the development and maintenance of midbrain dopamine neurons, representing a promising molecular target for Parkinson's disease (PD). We previously identified three Nurr1 agonists (amodiaquine, chloroquine and glafenine) that share an identical chemical scaffold, 4-amino-7-chloroquinoline (4A7C), suggesting a structure-activity relationship. Herein we report a systematic medicinal chemistry search in which over 570 4A7C-derivatives were generated and characterized. Multiple compounds enhance Nurr1's transcriptional activity, leading to identification of an optimized, brain-penetrant agonist, 4A7C-301, that exhibits robust neuroprotective effects in vitro. In addition, 4A7C-301 protects midbrain dopamine neurons in the MPTP-induced male mouse model of PD and improves both motor and non-motor olfactory deficits without dyskinesia-like behaviors. Furthermore, 4A7C-301 significantly ameliorates neuropathological abnormalities and improves motor and olfactory dysfunctions in AAV2-mediated α-synuclein-overexpressing male mouse models. These disease-modifying properties of 4A7C-301 may warrant clinical evaluation of this or analogous compounds for the treatment of patients with PD.


Conflict of interest statement

W.K., M.T., S.V., S.K.K., R.K., A.T., D.S.R., and K.-S.K. are co-inventors of a pending U.S. utility patent application no. 18/013,155 that is assigned to the McLean Hospital Corporation and the University of Delhi. The patent application no. 18/013,155 describes and claims compounds including SPV-94 (4A7C-301) that are described in this manuscript and methods of using these compounds to treat neurodegenerative diseases. K.-S.K. is a co-founder of NurrOn Pharmaceutical, Inc., which has rights to develop compounds disclosed in this manuscript under a licensing agreement with The McLean Hospital Corporation. The remaining authors have no conflicts of interest.

Figures

Fig. 1
Fig. 1. Identification of 4A7C-301 as an optimized agonist for Nurr1 activation.
a, b Development of 4A7C-Pyrimidine conjugates as potent Nurr1 agonists from CQ based on the structure-activity relationship (SAR) sharing an identical scaffold, 4-amino-7-chloroquinoline (4A7C; indicated in red color); (i), (ii), (iiia)/(iiib) denote the sites of structural modifications on 4A7C-pyrimidines. c Synthetic scheme for 4A7C-301; Reaction conditions: (i) neat, 120 °C, 8 h, 90%; (ii) triethylamine, THF, 60 °C, 12 h, 28 % (5A), 53% (5B); (iii) neat, sealed-tube, 110 °C, 5 h, 65%. d, e Luciferase assays using Nurr1-LBD (c) or full-length Nurr1 (d) in SK-N-BE(2)C cells. *P < 0.05, ****P < 0.0001 compared to control (CTL), two-way ANOVA, Dunnett’s post-hoc test; n = 3 biologically independent samples per group. Data are mean ± s.e.m. f Luciferase assay determining the effect of CQ (100 µM) and 4A7C-301 (20 µM) using LBD of NR4A subfamily members in SK-N-BE(2)C cells. Prostaglandin A1 (PGA1, 10 µM) and cytosporone B (10 µM) were used as positive controls of Nor1- and Nur77-activation, respectively. n = 3 biologically independent samples per group. Data are mean ± s.e.m. g Luciferase assay using point-mutants on potential Nurr1-LBD binding residues in SK-N-BE(2)C cells. P < 0.0001 compared to CQ or 4A7C-301 treated wild-type (WT), two-way ANOVA, Dunnett’s post-hoc test; n = 4 biologically independent samples per group. Data are mean ± s.e.m. h Competition analysis of CQ or 4A7C-301 with [3H]-CQ for binding to Nurr1-LBD. Retinoic acid (RA) was used as a negative control. n = 3 biologically independent samples per group. Data are mean ± s.d. i, Time-resolved fluorescence resonance energy transfer (TR-FRET) assay showing dose-dependent competition of CQ or 4A7C-301 with fluorescence-labeled hydroxy-CQ (HCQFluo) for binding to Nurr1-LBD. n = 3 biologically independent samples per group. Data are mean ± s.d.
Fig. 2
Fig. 2. In vitro comparison of CQ and 4A7C-301 neuroprotective function via Nurr1.
a, b Cell viability analyzed by MTT (3-(4,5-dimethylthiazol-2-yl)-2,5-diphenyltetrazolium bromide) reduction (a) and cytotoxicity measured by lactate dehydrogenase (LDH) release (b) with Nurr1 OE and KD in N27-A cells. ***P < 0.001, ****P < 0.0001 compared to vehicle (VEH) treatment under Control conditions; ###P < 0.001, ####P < 0.0001 compared between each treatment group, two-way ANOVA, Tukey’s post-hoc test; n = 4 biologically independent samples per group. Data are mean ± s.e.m. c Representative TH (red) and Iba-1 (green) immunofluorescence images from MPP+- or LPS-treated VM neuron-glia co-culture in the absence or presence of CQ or 4A7C-301. Scale bar, 100 µm. dg Quantification of TH+ neurons (d, e) and Iba-1+ microglia (f, g) counted and transformed as percentage of vehicle (VEH) control, from CQ (d, f) or 4A7C-301 (e, g) treated condition. *P < 0.05, **P < 0.01, ***P < 0.001 compared to 0 nM, multiple unpaired two-tailed t test; n = 3 biologically independent samples per group. Data are mean ± s.e.m. from two biologically independent experiments.
Fig. 3
Fig. 3. CQ inhibits but 4A7C-301 protects autophagy.
a, b Autophagolysosome (APL) formation assay in N27-A cells. a Tandem mRFP-GFP-LC3 fluorescence images for APL detection. Scale bars, 20 µm. b Number of yellow LC3 dots and red LC3 dots per cell was counted from 10 random cells in each well from triplicates for each condition (total of 30 cells per each group). Two-tailed unpaired t test. Data are mean ± s.e.m. c, d Lysosomal pH detection in N27-A cells. c LysoSensor™ Yellow/Blue DND-160 fluorescence images. Scale bars, 20 µm. d Quantification from 5 random cells in each well from triplicates for each treatment group (total of 15 cells per each group). Two-tailed unpaired t test. Data are mean ± s.e.m. eg Western blot analyses for autophagic flux in N27-A cells. Autophagic flux markers LC3B and p62 expressions (e) and quantitation of their expression levels (f, g). *P < 0.05, **P < 0.01, ****P < 0.0001; #P < 0.05, ##P < 0.01, ###P < 0.001, ####P < 0.0001 compared to EBSS, two-way ANOVA, Bonferroni’s multiple comparisons; n = 3 biologically independent samples per group. Data are mean ± s.e.m.
Fig. 4
Fig. 4. Neuroprotective effects of CQ and 4A7C-301 in MPTP-induced male mice.
a Schematic representation of L-DOPA, CQ, and 4A7C-301 administrations to MPTP-induced male mice. bd Behavior tests involved in motor coordination and spontaneous movement assessed using rotarod (b), pole test (c), and cylinder test (d). One-way ANOVA, Tukey’s post-hoc test. Data are mean ± s.e.m. e Behavior test involved in olfactory dysfunction assessed using olfactory discrimination test. Left, duration of stay between new and old bedding. Two-way ANOVA, Bonferroni’s multiple comparisons. Data are mean ± s.e.m. Right, velocity during the session. One-way ANOVA, Tukey’s post-hoc test. Data are mean ± s.e.m. f Global AIMs score calculated by multiplying Basic and Amplitude AIMs scores (Supplementary Fig. 8f, g). Data are mean ± s.e.m. gk Immunohistochemical analyses of TH+ DA neurons (gj) and NeuN+ neuros (I, k) in the STR (g, h) and SNpc (ik). Scale bars, 500 µm. One-way ANOVA, Tukey’s post-hoc test. Data are mean ± s.e.m. ln Immunohistochemical analyses of Iba-1+ microglia by counting in the STR (m) and SNpc (n). Scale bars, 500 µm. One-way ANOVA, Tukey’s post-hoc test. Data are mean ± s.e.m.
Fig. 5
Fig. 5. 4A7C-301 exhibits robust neuroprotective effects on αSynWT- and αSynA53T-induced male mouse models.
a Schematic representation of CQ and 4A7C-301 administrations to AAV-αSyn-injected male mice. b Representative TH (red) and GFP (green) immunofluorescence images from two independent experiments in the SNpc of AAV-αSynWT- or -αSynA53T-injected mice. Scale bars, 500 µm. c, d Cylinder tests with CQ (c) or 4A7C-301 (d) treated group. †††P < 0.001, ††††P < 0.001 compared between GV and WV; *P < 0.05, ****P < 0.0001 compared between GV and AV; #P < 0.05 compared WV to WC or W301; §§§§P < 0.0001 compared AV to AC or A301. Two-way ANOVA, Tukey’s multiple comparisons; n = 8 per group. Data are mean ± s.e.m. GV, GFP + VEH; WV, αSynWT + VEH; AV, αSynA53T + VEH; WC, αSynWT + CQ; AC, αSynA53T + CQ; W301, αSynWT + 4A7C-301; A301, αSynA53T + 4A7C-301. e, f Olfactory discrimination test performed at 8 weeks after surgery. e Duration of stay between new and old bedding. Two-way ANOVA, Bonferroni’s multiple comparisons. Data are mean ± s.e.m. f Velocity during the session. n.s., not significant (P > 0.05), one-way ANOVA. Data are mean ± s.e.m. n = 8 per group. g, h Immunohistochemical analyses of TH+ neurons by densitometry in the STR. Scale bar, 500 µm. One-way ANOVA, Tukey’s post-hoc test; n = 5 per group. Data are mean ± s.e.m. ik Immunohistochemical analyses of TH+ DA neurons (I, j) and NeuN+ neuros (I, k) in the SNpc. Scale bars, 500 µm.One-way ANOVA, Tukey’s post-hoc test; j, n = 5 per group; k, n = 4 per group. Data are mean ± s.e.m. l Representative pS129 immunohistochemistry in the SNpc. Scale bars, 250 µm. m, Quantification of pS129 αSyn+ cells by counting. One-way ANOVA, Tukey’s post-hoc test; n = 5 per group. Data are mean ± s.e.m. n Western blot analyses of human-αSyn in the SNpc of AAV-αSyn-injected mice. Values are expressed as a relative expression compared to contralateral side. One-way ANOVA, Tukey’s post-hoc test; n = 3 per group. Data are mean ± s.e.m. oq Immunohistochemical analyses of Iba-1+ microglia by counting in the STR (p) and SNpc (q). One-way ANOVA, Tukey’s post-hoc test; n = 5 per group. Data are mean ± s.e.m. Scale bars, 250 µm.

Similar articles

Cited by

References

    1. de Lau LM, Breteler MM. Epidemiology of Parkinson’s disease. Lancet Neurol. 2006;5:525–535. doi: 10.1016/S1474-4422(06)70471-9. - DOI - PubMed
    1. Tysnes OB, Storstein A. Epidemiology of Parkinson’s disease. J. Neural Transm. (Vienna) 2017;124:901–905. doi: 10.1007/s00702-017-1686-y. - DOI - PubMed
    1. Poewe W, et al. Parkinson disease. Nat. Rev. Dis. Primers. 2017;3:17013. doi: 10.1038/nrdp.2017.13. - DOI - PubMed
    1. Saijo K, et al. A Nurr1/CoREST pathway in microglia and astrocytes protects dopaminergic neurons from inflammation-induced death. Cell. 2009;137:47–59. doi: 10.1016/j.cell.2009.01.038. - DOI - PMC - PubMed
    1. Pirooznia SK, Rosenthal LS, Dawson VL, Dawson TM. Parkinson disease: translating insights from molecular mechanisms to neuroprotection. Pharmacol. Rev. 2021;73:33–97. doi: 10.1124/pharmrev.120.000189. - DOI - PubMed

Publication types

MeSH terms

Substances