. 2023 Jul 18;14(1):4311.
doi: 10.1038/s41467-023-39646-4.

Allosteric activation of vinculin by talin

Affiliations

Allosteric activation of vinculin by talin

Florian Franz et al. Nat Commun. .

Abstract

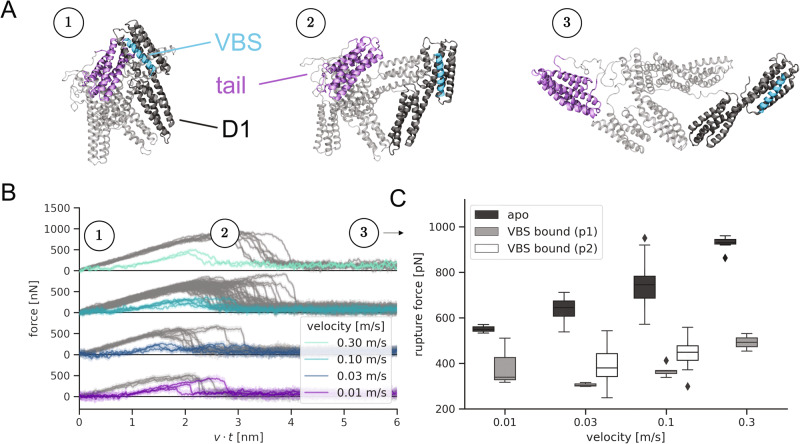
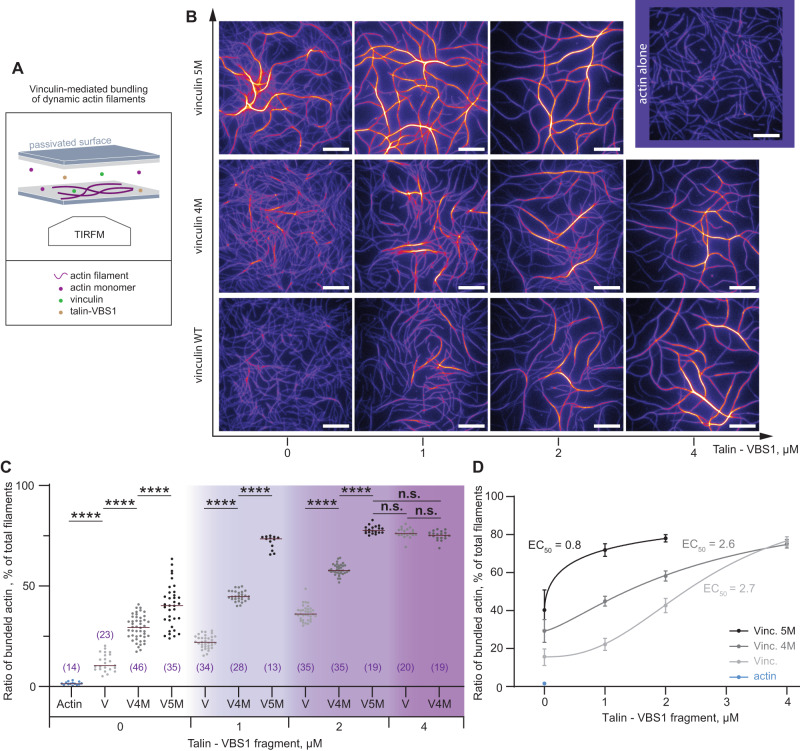
The talin-vinculin axis is a key mechanosensing component of cellular focal adhesions. How talin and vinculin respond to forces and regulate one another remains unclear. By combining single-molecule magnetic tweezers experiments, Molecular Dynamics simulations, actin-bundling assays, and adhesion assembly experiments in live cells, we here describe a two-ways allosteric network within vinculin as a regulator of the talin-vinculin interaction. We directly observe a maturation process of vinculin upon talin binding, which reinforces the binding to talin at a rate of 0.03 s-1. This allosteric transition can compete with force-induced dissociation of vinculin from talin only at forces up to 10 pN. Mimicking the allosteric activation by mutation yields a vinculin molecule that bundles actin and localizes to focal adhesions in a force-independent manner. Hence, the allosteric switch confines talin-vinculin interactions and focal adhesion build-up to intermediate force levels. The 'allosteric vinculin mutant' is a valuable molecular tool to further dissect the mechanical and biochemical signalling circuits at focal adhesions and elsewhere.


Conflict of interest statement

The authors declare no competing interests.

Figures

Fig. 1
Fig. 1. Vinculin’s head–tail interface regulates vinculin-VBS binding.
A Structural scheme of full-length vinculin (FLV) binding to a VBS under force (cyan helix). D1 domain (Vd1) is shown in orange, and the tail domain in purple. B End-to-end length of VBS1 at 200 pN bound to full-length vinculin (upper panel) and vinculin D1 domain (lower panel) as observed in MD simulations. The increase in extension from 4.0 nm to 5.2 nm corresponds to the first uncoiling transition of VBS1, used as a proxy for vinculin unbinding kinetics (first passage time, FPT). Data for other forces are shown in Fig. S1. C Expected rates (inverse MFPT, computed as shown in Figs S1D, E) to first transition as a function of force for FLV (blue) and Vd1 domain (orange). Data fitted to a Bell-Evans’s model (FLV: k0 = 2.6 × 10⁻⁷ s−1, x = 0.25 nm; Vd1: k0 = 4.5 × 10⁻⁸ s−1, x = 0.23 nm). Error bars are SEM. Data from N = 75 independent simulations. D Schematics of our single-molecule magnetic tweezers assay to measure FLV binding to talin under force. E Magnetic tweezers trajectories of R3IVVI in the presence of 20 nM FLV. At 8.5 pN (upper panel), talin folds and unfolds in equilibrium, and individual FLV binding events can be detected by a ~3 nm contraction of the talin polypeptide (red arrow) and the arrest in talin folding dynamics. At higher forces (12.5 pN, middle panel, and 15 pN, lower panel), the complex is less stable, and reversible binding (red) and unbinding (blue) events are observed as downward and upward ~3 nm steps, respectively. F Binding rates of FLV and Vd1 to R3IVVI. Data fitted to the Bell-Evans model assuming a positive force dependence for exposing the VBS and a negative force dependence for binding (see Methods). G Unbinding rates of FLV and Vd1. Data fitted to the Bell-Evans model (FLV: k0 = 6.6 × 10⁻³ s−1, x = 0.72 nm; Vd1: k0 = 6.8 × 10⁻⁶ s−1, x = 0.81 nm). H Binding probability of FLV and Vd1 measured over a 50 s time window. Data for FLV (FH) from N = 725 FLV binding and unbinding events on 15 talin molecules. Error bars are SEM in all cases. Data for Vd1 adapted from ref. . Source data are provided as a Source Data file.
Fig. 2
Fig. 2. Talin binding facilitates vinculin head–tail opening.
A Snapshots extracted from an exemplary trajectory to represent the opening transition during the force-probe MD simulations (see Fig. 1B and Methods). Force was applied directly to the VBS peptide (cyan) or to the talin binding site located on the vinculin D1 domain (dark gray). All simulations included full-length vinculin (Vh in gray, Vt in purple). B Force-extension traces for force application to VBS1 and pulling speeds between 0.01 and 0.3 m/s. As a reference, the force-extension curves for opening of the apo-state protein are shown in gray. C Quantification of the recorded rupture forces for the apo-state. For the VBS-complex rupture forces decreased drastically and two points of force application were investigated: (p1) on vinculin at the location of the talin binding site (light gray), which ensued slightly higher rupture forces, and (p2) directly on the VBS (black), which lead to the smallest observed rupture forces. Boxes show the quartiles of the data set, with whiskers extending to account for the rest of the distribution except for outliers. Source data are provided as a Source Data file.
Fig. 3
Fig. 3. Talin binding weakens the vinculin head-to-tail interaction.
A Magnetic tweezers recording showing the binding dynamics of full-length vinculin to talin R3IVVI at low forces over hours-long timescales. At 8.5 pN, FLV can remain bound to talin over ~1 h, indicating much slower unbinding kinetics than those corresponding to higher forces. B Magnetic tweezers recordings where the talin-vinculin complex is interrupted by a 40 pN force pulse after being bound for just a few seconds (left) or several seconds (right). Over short lifetimes, FLV unbinds on a sub-second timescale, while if the complex is left to mature at low forces, the interaction is reinforced, and it unbinds at 40 pN after a few seconds, indicating a much more stable complex. C Square-root histogram of unbinding times (tUb) at 40 pN. The distribution of unbinding times calculated with logarithmic binning shows two peaks, indicating two unbinding timescales, a fast one of ~0.4 s (t1) and a slower one of ~7.4 s (t2), suggesting two different binding modes. Data from N = 165 vinculin unbinding events measured on 12 talin molecules. D Unbinding time of FLV at 40 pN plotted as a function of the complex lifetime. The talin-vinculin interaction matures towards a more stable complex over a timescale of ~37 s. Error bars are SEM. E Unbinding kinetics of FLV (weak state, light blue; mature state, dark blue), the vinculin D1 domain (orange), and full-length vinculin head (gray). Data from N = 85 (weak), N = 42 (strong); N = 74 (D1), and N = 32 (FLVH) vinculin unbinding events. Bars indicate the average unbinding time, and error bars are SD. Significance levels from non-parametric Mann–Whitney test, NS P > 0.05; ****P < 10−4. (F) Kinetic diagram suggesting the binding mechanism of FLV to a VBS low force (left) and higher forces (right). At forces in the ~8 pN range, the interaction is reinforced over ~37 s, likely due to a partial opening of vinculin that stabilizes the talin-vinculin complex. At higher forces around ~15 pN, the maturation step is kinetically unfavorable due to the faster competing unbinding kinetics, and FLV only binds VBS in its weak mode. Source data are provided as a Source Data file.
Fig. 4
Fig. 4. Analysis of correlated motions and force distribution identified an overlapping set of residues that collectively weakens the D1-tail interface.
A The results of the analysis of correlated motions in the tensed protein. (Extracted from force-probe MD trajectories at 0.1 m/s using the 5 ns leading up to a force of 300 pN across the protein in each trajectory. For each map, the contributions from 20 independent trajectories were averaged.) Here, residues of the vinculin tail are represented along the x-axis, and residues of the D1 domain along the y-axis. The areas between the dotted lines illustrate the three areas in the D1 domain that are strongly affected by VBS-binding. B Changes in correlation coefficient per residue between apo state and complex, such that dark areas represent residues that experience a strong loss of correlation if in complex with VBS1. The colored circles represent the results of a weighted cluster analysis, intended to find clusters of correlation-losing residues. C Representation of the results from the cluster analysis (colored spheres) and FDA-network analysis (red and blue connections). The zoom-in on the right shows the interactions between head and tail residues (image based on the x-ray structure) that were identified by both methods to contribute to the lesser stability of the head–tail interactions. D Magnetic tweezers trajectories showing vinculin unbinding from talin R3IVVI at 40 pN for the WT (mature state, upper panel), the 4M mutant (middle panel), and the 5M mutant (lower panel). E Square-root histogram of unbinding times (tUb) at 40 pN for the 4M vinculin mutant. The single-peaked square-root histogram indicates a single-bound model. F Square-root histogram of unbinding times (tUb) at 40 pN for the 5M vinculin mutant. The 5M mutant also has a single-bound mode. G Unbinding times for WT vinculin (mature state, dark blue), 4 M (purple) and 5 M (light blue) mutant, the T12 mutant (teal), and D1 domain (orange). Data from N = 42 (WT mature); N = 84 (4 M); N = 59 (5 M); N = 40 (T12), and N = 70 (D1) vinculin unbinding events. Bars indicate average unbinding times, and error bars are SD. Significance levels for non-parametric Mann–Whitney test NS P > 0.05; ***P < 10−3; ****P < 10−4. Source data are provided as a Source Data file.
Fig. 5
Fig. 5. The 5M vinculin mutant forms stable actin filament bundles in the absence of talin.
A Schematic illustration of the experimental setup. (1) The passivated slides and coverslips were utilized to fabricate a chamber where (2) soluble proteins were injected at the onset of polymerization/bundling reaction, as revealed by TIRFM. B Representative images after 1 h polymerization of 0.6 µM Alexa-647 labeled actin alone, or in the presence 0.5 µM vinculin variants, or in the presence of 0.35 µM vinculin variants and 1, 2, or 4 µM talin VBS1. Scale bars, 10 µm. C The relative amount of actin bundles was shown, as a ratio between bundled actin and the total filament population. Statistical comparisons using the Holm–Šídák test, and one-way analysis of variance (ANOVA) showed significant variations among vinculin variants for their ability to generate actin bundles. Number of actin bundles per condition shown in parentheses. Horizontal bar is the average value. ****P < 10−4; NS.(V5M-VBS1 2 µM vs VWT-VBS1 4 µM) P = 0.9984. NS.(V5M-VBS1 2 µM vs V4M-VBS1 4 µM) P = 0.6842. NS.(VWT-VBS1 4 µM vs V4M-VBS1 4 µM) P = 0.9999. Data from N = 3 independent reconstitutions. D Counts in (C) were plotted as a function of talin-VBS1 concentrations and fitted with a four-parameter dose–response equation, the Hill-Langmuir equation (see Methods). The best fit of the overall dataset was obtained for 99.8% maximal bundle ratio and showed a significant difference in the half-maximal effective concentration, EC50. R2 ranged between 0.84 and 0.98, and was 0.95 for the overall dataset. Error bars represent SD. Source data are provided as a Source Data file.
Fig. 6
Fig. 6. Vinculin mutants mimicking VBS binding form centrally located adhesions distant from the cell edge.
A Images of MEF-vinculin-Null cells non-transfected, or transfected with GFP-wild-type vinculin, GFP-4M, or GFP-5M vinculin mutants. Cells were stained with β1 integrin antibody, phalloidin and DAPI. Scale bar: 20 μm. B The fractions of center focal adhesion divided by the total number of focal adhesions of the cells. C Quantification of the total number of focal adhesions per cell. D Quantification of the shortest distance of each focal adhesion to cell edge normalized to the equivalent cell radius. E Quantification of focal adhesion intensity normalized to the background intensity. Box and whisker plot: The box includes the upper and lower quartile. The lower and upper whisker represents the lower quartile −1.5 *interquartile range and upper quartile +1.5 *interquartile range, respectively. The line in the box represents the median and the dots represent the mean. Significance levels from two-sided t tests. NS (WT vs 4 M) P = 0.06; NS (WT vs 5 M) P = 0.44; **P < 0.01; ***P < 0.001; ****P < 10−4. Source data are provided as a Source Data file.

References

    1. Discher DE, Janmey P, Wang Y. Tissue cells feel and respond to the stiffness of their substrate. Science. 2005;310:1139–1143. doi: 10.1126/science.1116995. - DOI - PubMed
    1. Martino, F., Perestrelo, A. R., Vinarský, V., Pagliari, S. & Forte, G. Cellular mechanotransduction: from tension to function. Front. Physiol. 9 (2018). - PMC - PubMed
    1. Geiger B, Spatz JP, Bershadsky AD. Environmental sensing through focal adhesions. Nat. Rev. Mol. Cell Biol. 2009;10:21–33. doi: 10.1038/nrm2593. - DOI - PubMed
    1. Pasapera AM, Schneider IC, Rericha E, Schlaepfer DD, Waterman CM. Myosin II activity regulates vinculin recruitment to focal adhesions through FAK-mediated paxillin phosphorylation. J. Cell Biol. 2010;188:877–890. doi: 10.1083/jcb.200906012. - DOI - PMC - PubMed
    1. Choi CK, et al. Actin and α-actinin orchestrate the assembly and maturation of nascent adhesions in a myosin II motor-independent manner. Nat. Cell Biol. 2008;10:1039–1050. doi: 10.1038/ncb1763. - DOI - PMC - PubMed

Publication types