. 2023 Jul 18;14(1):4313.
doi: 10.1038/s41467-023-39935-y.

Distinct shared and compartment-enriched oncogenic networks drive primary versus metastatic breast cancer

Affiliations

Distinct shared and compartment-enriched oncogenic networks drive primary versus metastatic breast cancer

Zhe Jiang et al. Nat Commun. .

Abstract

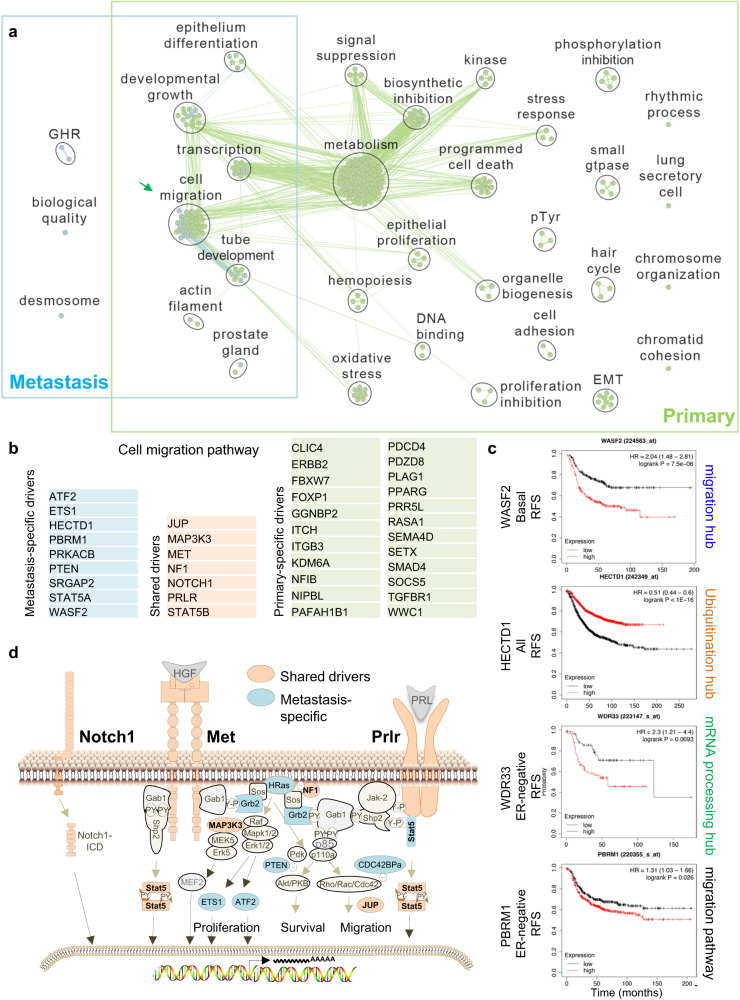
Metastatic breast-cancer is a major cause of death in women worldwide, yet the relationship between oncogenic drivers that promote metastatic versus primary cancer is still contentious. To elucidate this relationship in treatment-naive animals, we hereby describe mammary-specific transposon-mutagenesis screens in female mice together with loss-of-function Rb, which is frequently inactivated in breast-cancer. We report gene-centric common insertion-sites (gCIS) that are enriched in primary-tumors, in metastases or shared by both compartments. Shared-gCIS comprise a major MET-RAS network, whereas metastasis-gCIS form three additional hubs: Rho-signaling, Ubiquitination and RNA-processing. Pathway analysis of four clinical cohorts with paired primary-tumors and metastases reveals similar organization in human breast-cancer with subtype-specific shared-drivers (e.g. RB1-loss, TP53-loss, high MET, RAS, ER), primary-enriched (EGFR, TGFβ and STAT3) and metastasis-enriched (RHO, PI3K) oncogenic signaling. Inhibitors of RB1-deficiency or MET plus RHO-signaling cooperate to block cell migration and drive tumor cell-death. Thus, targeting shared- and metastasis- but not primary-enriched derivers offers a rational avenue to prevent metastatic breast-cancer.


Conflict of interest statement

C.M.P. is an equity stockholder and consultant of BioClassifier LLC; C.M.P. is also listed as an inventor on patent applications for the Breast PAM50 Subtyping assay. There is no direct relationship between these PAM50 patents and the Intellectual Property and content of this study. The other authors declare no conflict of interest.

Figures

Fig. 1
Fig. 1. Sleeping Beauty (SB) mutagenesis screens on Rb-deficient background identify overlapping oncogenic alterations in mammary and lung tumors.
a Setup of SB screens using MMTV-Cre:Rbf/f:T2/Onc3a:R26-lsl-SB11 and MMTV-Cre:Rbf/f:T2/Onc3b:R26-lsl-SB11 mice to identify primary mammary tumors and lung metastases driven by SB transposons on Rb-deficient background. b Macroscopic lung tumors detected by stereomicroscope were dissected and subjected to ligation-mediated PCR and deep sequencing. c PCR-based analysis of primary tumors to identify the 283 bp Rb-floxed allele (lanes 1–3) and 260 Rb deletion product following Cre-mediated recombination (lanes 1 and 3, but not 2). Source data are provided as a Source data file. Representative histology (d) and pie distribution (e) of primary and lung lesions. Pleomorphic/Squamous cell carcinoma (P/SCC), Adenosquamous carcinoma (ASC), Papillary/ Micropapillary (P/MP), poorly differentiation adenocarcinoma (PDA), Cribriform (CF). Scale bar, 100 μm. f Top gene-centered Common Integration Sites (gCIS) identified in primary (top) and lung (bottom) tumors following SB screens on Rb-deficient background. All gCISs are listed in Supplementary Fig. 1A and shown in Supplementary Data 1 and 2. S-specific gCIS are highlighted in red, and percentage in primary and lung lesions is tabulated. Representative gCIS functionally analyzed herein are marked in green (top – Fbxw7) and blue (bottom – Wdr33, Srgap2, Fbxw4, Pten, Cdc42bpa, and Mtmr3). g Venn diagram for significant gCISs identified in primary and lung lesions and the 7 S-drivers. Arrows point to direction of transposons. h Schematic structure of the NF1 gene locus and relative location of CIS in primary tumors and lung metastasis. > denotes SB integration in the 5′ to 3′ direction of the gene; <denotes reverse direction.
Fig. 2
Fig. 2. Clonal relationship between gCISs in primary and lung lesions and their interactions in each compartment.
a Schematic structure of the cMET gene and relative location of gene-centered Common Integration Sites (gCIS) in primary tumors and lung metastasis. > denotes SB integration in the 5′ to 3′ direction of the gene and <denotes reverse direction. b Nucleotide-resolution integration site analysis of SB transposons in primary and lung lesions from the same mice in 4 different animals in the cMET gene. For example, mouse 31 (pair #1) has an identical integration site in a primary tumor and in 9 different lung metastases. Pairs #2–4 have a single lung metastasis each with identical integration site as in the primary tumors. c Summary of clonal relationship observed between primary lesions and metastases in 6 different gCISs (details in Supplementary Data 5). d A schematic representation of clonal relationship between primary and lung lesions. For gCIS analysis, tumor biopsies and whole macro-metastasis were subject to ligation-mediated PCR and next-generation DNA sequencing. If a tumor biopsy (a) contains a disseminating clone that gives rise to a large metastasis – and deep sequencing detects the same integration sites in both compartments, clonal relationship can be established. On the other hand, if a tumor biopsy (b) with disseminating metastatic clone is not analyzed for gCIS, or (c) does not spawn a disseminating clone, clonality cannot be demonstrated. e String analysis for interaction among gCISs in primary- and metastasis-specific gCIS. Demarcated are cMET hubs found in both compartments (black circles), as well as Rho signaling/cell migration (blue), protein ubiquitination (orange) and pre-mRNA processing (green) hubs identified in metastasis-only gCISs.
Fig. 3
Fig. 3. g:Profiler uncovers cell migration as a common biological process in primary and metastatic gCISs comprising all 7 S-drivers.
a g:Profiler of gCISs in primary vs metastases using gene ontology (GO) for biological processes. Demarcated are overlapping pathways including ‘cell migration’ in both compartments. b Lists of the P- M- and S-gCISs in the ‘cell migration’ pathway. All 7 shared oncogenic gCISs (Fig. 1g) are included in the ‘cell migration’ pathway. c Kaplan–Meier relapse-free survival (RFS) curves of selected genes from the cell migration pathway, ubiquitination pathway and pre-mRNA processing hubs (Fig. 2e) as well as the metastasis-specific ‘cell migration’ pathway (b), using kmplot.com. RFS curves for other genes from these pathways are shown in subsequent figures and supplemental Fig. S2. d Schematic presentation of oncogenic pathways induced by gCISs on the MET, Prolactin receptor (PRLR) and NOTCH1 pathways, promoting cell proliferation, survival and migration through transcriptional, protein-protein interactions and post-translational modifications. S-gCIS are in orange; M-gCIS in light blue.
Fig. 4
Fig. 4. Impact of high cMET but not RAS pathway activity on clinical outcome of triple-negative breast cancer patients in cooperation with RB-loss.
a Expression of a cMET signature, MET24, developed for hepatocellular carcinomas (HCC), in indicated molecular breast cancer subtypes, with highest level in basal-like breast cancer. In a, d, i, P = 0.0000 denotes P < 0.0001, using PRISM and two-tailed, unpaired t test; error bars represent SD. b Kaplan–Meier disease-free (DFS) and overall (OS) survival curves for breast cancer patients segregated based on MET24 signature level. HR denotes hazard ratio. P values in b, e, h calculated by Log-rank (Mantel–Cox) test. c cMET signature expression in 6 and 4 different triple-negative breast cancer (TNBC) subtype classification with highest expression in BL1 together with RBKO high, PI3K-, MYC-, WNT-, RAS- and RHOA-signaling high and PTEN and TP53 loss. MET24-high samples overlap with the most aggressive TNBC lesions (demarcated by the red box), defined by PTEN-loss and 5 miRNA-low (PTENlow/miRlow, red) as described. BL1 Basal-like 1, BL2 Basal-like 2, M mesenchymal, MSL mesenchymal stem–like, IM immunomodulatory, LAR luminal androgen receptor, UNS unspecified. d Levels of MET24 and RAS signatures in the different TNBC subtypes. MET24 is significantly higher in BL1 versus other subtypes; RAS pathway activation is seen in BL1, BL2 and MSL. e Kaplan–Meier OS curves showing MET but not RAS pathway activity identifies TNBC with unfavorable prognosis. f Kaplan–Meier OS curve showing MET pathway-high identifies BL1 TNBC patients with exceedingly poor prognosis. g OS curve of an independent cohort showing MET pathway-high segregates BL1 but not all TNBC patients into relatively fair versus poor prognosis. h Effect of RB loss, MET signature high or both on OS of TNBC patients in the SCAN-B 327 TNBC cohort. Analysis of two additional cohorts is shown in supplementary Fig. S3. i Heat map and graphic presentation of MET24, RAS and RHOA signature levels in breast cancer cell lines classified by PAM50. Cell lines marked in red were used to characterize gCISs; those marked by asterisks were used to test the effect of RB depletion on cell migration.
Fig. 5
Fig. 5. Effect of selected genes targeted by gCISs on tumorigenesis and cell migration.
a Incidence of microscopic mammary tumors in MMTV-Cre:Rbf/f:Fbxw7f/f female mice relative to single mutant mice. Left, whole mount stained mammary gland from a representative MMTV-Cre:Rbf/f:Fbxw7f/f mouse with multiple microscopic tumors (arrows). Right, quantification of mammary tumors in indicated mice. P value calculated by one-way ANOVA, Tukey’s multiple comparison test. b Incidence of microscopic lung lesions in MMTV-Cre:Rbf/f:Ptenf/f mice relative to single mutant mice. Left, cross section through a representative lung; arrow points to a large lung lesion. Right, number of lung mets in indicated mouse strains. Error bars represent SD; P value calculated by one-way ANOVA, Tukey’s multiple comparison test. c Kaplan–Meier Disease-free survival curves for breast cancer patients with high RBKO pathway (loss; left), low PTEN mRNA level (center), or RBKO high (loss) plus PTEN mRNA low (right) compared to all other genotypes. HR hazard ratio. P values calculated by Log-rank test. d Western blot analysis for expression of indicated M-targets in different TNBC cell lines: MDA-MB-231; MDA-MB-436; MDA-MB-468; Hs578t; and HER2-enriched SKBR3. e Effect of shRNA-mediated FBXW7, CDC42BPA, SRGAP2 or MTMR3 depletion on cell migration (scratch-wound assays) in indicated TNBC lines. P values calculated by unpaired, two-tailed student t-test. * denotes P = 0.0313 by one-sided t test. f CDC42BPA depletion counteracts the effect of Rho-kinase inhibitor, fasudil, on pMLC2 phosphorylation and cell migration. Top, MDA-MB-231 cells stably transduced with empty or CDC42BPA lenti-shRNA virus were treated with fasudil (25uM) or vehicle alone followed by western blots for CDC42BPA, anti-pMLC2-Thr18/Ser19 or total MLC2 with tubulin as loading control. Middle, statistical analysis on three independent biological replicates (see supplemental Fig. S7d). Bottom, statistical analysis on 9 independent scratch assays (see supplemental Fig. S7e). P values by unpaired two-tailed student t-tests. g Effect of RB depletion on TNBC cell migration in indicated cell lines. Error bars represent SD. h Effect of FBXW7 depletion on primary tumor formation of MDA-MB-436 cells following orthotopic transplantation into immune-deficient NSG mice (≥6 mice per group). P values calculated by one-way ANOVA, Tukey’s multiple comparison test. i, j. Effects of CDC42BPA or MTMR3 depletion on primary tumor formation and metastases of MDA-MB-436 cells following orthotopic transplantation into NSG mice (≥6 mice per group). Shown are primary tumor weights at end point (left) and number of lung mets (right) from multiple lung sections. P values calculated by one-way ANOVA, Tukey’s multiple comparison test. Source data are provided as a Source data file.
Fig. 6
Fig. 6. Effects of FBXW4 and WDR33 on breast cancer cell growth and tumorigenesis.
a Growth suppression by adenovirus-FBXW4 in MCF7 luminal and MDA-MB-231 TNBC cells, determined by MTT ([3-(4,5-Dimethylthiazol-2-yl)−2,5-Diphenyltetrazolium Bromide]) assays. All P values were determined by two-tailed, unpaired t test; error bars represent SD. b Induction of senescence (senescence-associated β-galactosidase assays; blue; arrows) by adenovirus-FBXW4 in MCF7 cells. Scale bar, 50 μm. Right, quantification of results from a representative experiment. c Suppression of cell migration (scratch-wound assays) by adenovirus-FBXW4 in MDA-MB-231 TNBC cells. d Left, western blot analysis demonstrating efficient depletion of FBXW4 via lenti-shRNA (clone #3) versus control, Empty Vector (EV). Right, effect of FBXW4 depletion via shRNA clones on cell proliferation (MTT assays). * denotes P < 0.05 by two-tailed student t-test (n = 3). e Induction of cell migration following FBXW4 depletion in MCF7 cells. f Significant increase in tumor formation following orthotopic transplantation of FBXW4 depleted MCF7 cells into NSG mice (8 mice per group) versus control, EV-transduced MCF7 cells. g Kaplan–Meier disease-free survival (DFS) curve of breast cancer patients expressing low vs high FBXW4 mRNA levels. P value by Log-rank (Mantel–Cox) test. h Western blots showing that transient (left) or stable (center) depletion of FBXW4 increases BCL2 expression whereas FBXW4 over-expression decreases BCL2 levels in indicated cells. Representative blots of 3 biological experiments each. i Western blots showing that stable knockdown of FBXW4 increases MRPL37 and suppresses p27KIP1 expression. Representative blots of 3 biological experiments. j Left, generation of MDA-MB-231 TNBC cell lines over-expressing WDR33 via recombinant lentivirus. Right, induction of cell proliferation following WDR33 over-expression as determined by MTT assays. Representative experiment of 3 biological experiments each performed in triplicates. k Left, generation of a WDR33-knocked-down MDA-MB-468 TNBC cells. Right, top, WDR33 depletion reduced cell proliferation by MTT assays (right, top) but had no effect on cell migration in wound scratch assays (Right, bottom). Representative experiment of 3 biological experiments each performed in triplicates. Source data are provided as a Source data file.
Fig. 7
Fig. 7. Primary-, metastatic- and shared-oncogenic pathways in human breast cancer.
a Heat map for activity of 26 pathways in primary vs metastatic breast cancer of all patients in the test cohort. In bold are pathways that are significantly and robustly different between primary lesions and metastases. Highlighted in red are pathways that are also altered in the validation and two additional cohorts (supplementary Fig. S9b, c). P values represent difference between primary and metastases by unpaired two-tailed t-test; ∆Mean, difference in mean in the two compartments. P = 0.0000 denotes P < 0.0001. Differences in pathway activity were calculated;  color scale denotes pathway activity. b Jitter plots showing combined results from four different cohorts for M-enriched (RhoA; PI3K), S- (RAS, RB-loss, MET) and P-enriched (STAT3, EGFR, TGFβ) pathways. Significance was calculated by student T-test and Mann–Whitney test (M). P values calculated by unpaired two-tailed t-test. c Heat map for activity of the 26 pathways in paired primary vs metastatic basal-like, HER2, Luminal A and Luminal B. For Luminal A, the validation cohort is also shown. Color scale denotes pathway activity. Additional analysis of the validation cohort is shown in supplementary Fig. S9b.
Fig. 8
Fig. 8. Impact of RB-loss plus high RHO-signaling on prognosis, and effect of pharmacological inhibition of shared (RB-loss; MET-high) plus metastasis-enriched (RHO-high) oncogenic pathways on proliferation and migration of TNBC cells.
a Kaplan–Meier survival curves of TNBC patients expressing high RhoA signaling, RBKO high (loss) or both in three different clinical cohorts: SCAN-B 327 TNBC, FUSCC 360TNBC, and METABRIC 205TNBC. The entire analysis including other genes is shown in supplementary Fig. S3. b Representative IncuCyte proliferation assays comparing the effect of indicated inhibitors of RB-deficient cells (WEE1 kinase inhibitor, MK1775, 0.125 μM; Aurora A kinase inhibitor, Alisertib, 1.25 μM), MET (Tivantinib, 0.5 μM) and RHO signaling (Arp2/3 inhibitor, CK666, 120uM) alone and in combinations (additional analysis shown in supplementary Fig. S11). P values calculated by Welch’s T-test: ***P < 0.0001 (MK1775 vs MK1775/Tivantinib). Error bars in b, c represent SD. c Representative IncuCyte migration assays over 72 h comparing the effect of indicated inhibitors of RB-loss (WEE1 kinase inhibitor, MK1775, 0.2 μM; Aurora A kinase inhibitor, Alisertib, 0.3 μM), MET (Tivantinib, 1 μM) and RHO signaling (Arp2/3 inhibitor, CK666, 100 μM) alone and in combinations (n = 4 biological experiments each performed in triplicates; additional analysis shown in supplementary Fig. S11). P values calculated by Welch’s T-test: *P = 0.027 (Tivantinib vs MK1775/Tivantinib); **P = 0.0017 (CK666 vs CK666/MK1775); **P = 0.0031 (CK666 vs CK666/Alisertib). Source data are provided as a Source data file. d A model depicting the oncogenic relationship between primary and metastatic breast cancer and impact on cancer progression and prevention. Subtype-specific shared-oncogenic drivers (S-divers) promote both primary and metastatic breast cancer (e.g. RB loss, p53-loss, MET, ER and HER2 gain/over-expression), and cooperate with primary (P-) enriched drivers (TGFβ, EGFR, STAT3 signaling) to promote primary breast cancer or with metastasis (M-) enriched drivers (RhoA, PI3K signaling) to induce metastatic disease. The S-drivers are subtype specific—e.g. ER pathway is elevated in both luminal P- and M-lesions, but not other subtypes such as TNBC. Combination therapy against two subtype-specific S-drivers, or an S-driver plus RHOA or PI3K signaling (M-enriched) may efficiently prevent metastatic dissemination.

References

    1. Valastyan S, Weinberg RA. Tumor metastasis: molecular insights and evolving paradigms. Cell. 2011;147:275–292. doi: 10.1016/j.cell.2011.09.024. - DOI - PMC - PubMed
    1. Nathanson, S. D. et al. Mechanisms of breast cancer metastasis. Clin. Exp. Metastasis39, 117–137 (2022). - PMC - PubMed
    1. Esposito M, Ganesan S, Kang Y. Emerging strategies for treating metastasis. Nat. Cancer. 2021;2:258–270. doi: 10.1038/s43018-021-00181-0. - DOI - PMC - PubMed
    1. Gui P, Bivona TG. Evolution of metastasis: new tools and insights. Trends Cancer. 2022;8:98–109. doi: 10.1016/j.trecan.2021.11.002. - DOI - PubMed
    1. Bernards R, Weinberg RA. A progression puzzle. Nature. 2002;418:823. doi: 10.1038/418823a. - DOI - PubMed

Publication types