. 2023 Jul 18;14(1):4288.
doi: 10.1038/s41467-023-39564-5.

Salicylic acid metabolism and signalling coordinate senescence initiation in aspen in nature

Affiliations

Salicylic acid metabolism and signalling coordinate senescence initiation in aspen in nature

Jenna Lihavainen et al. Nat Commun. .

Abstract

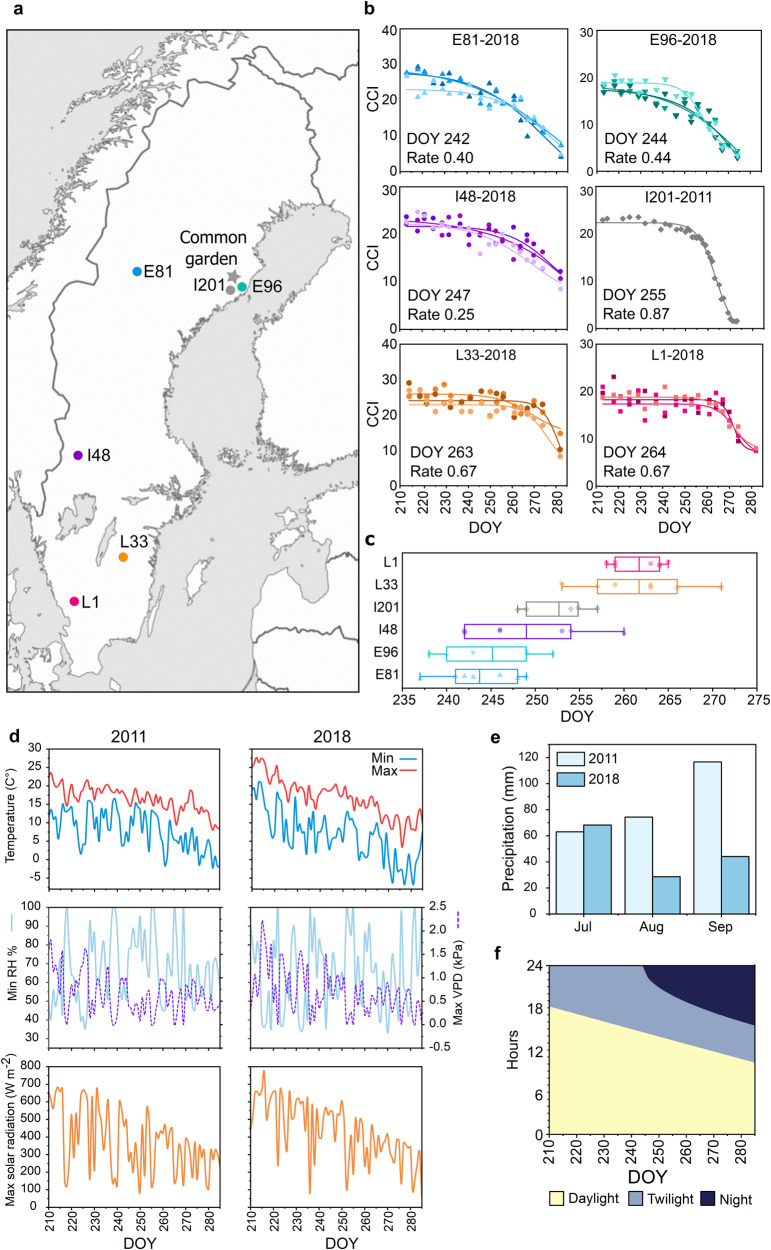
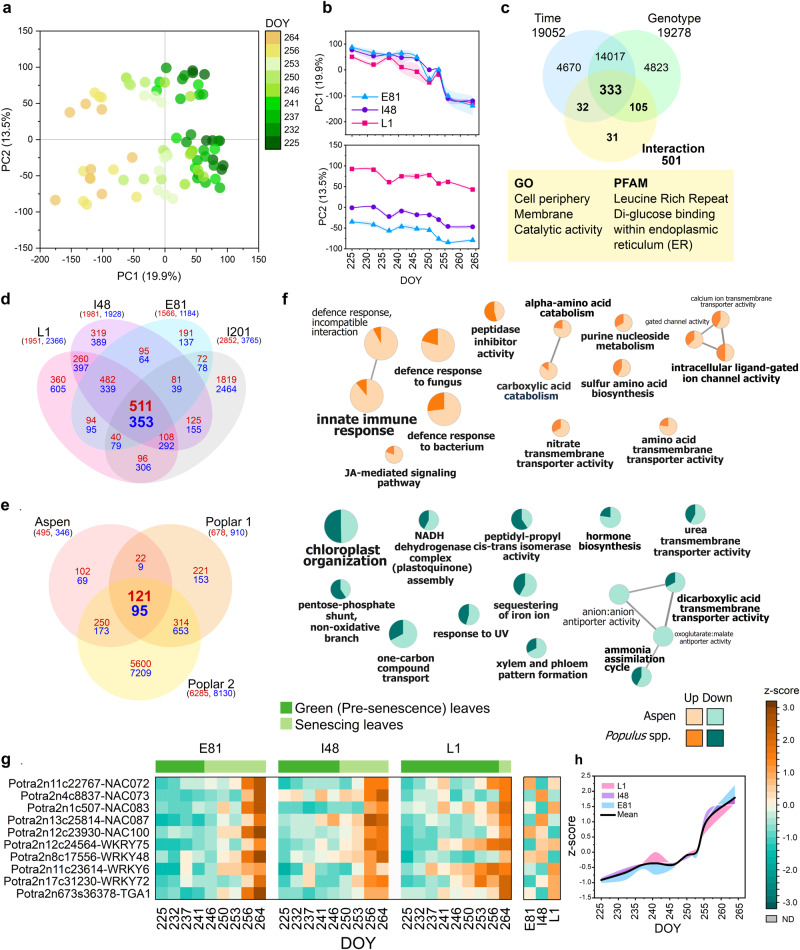
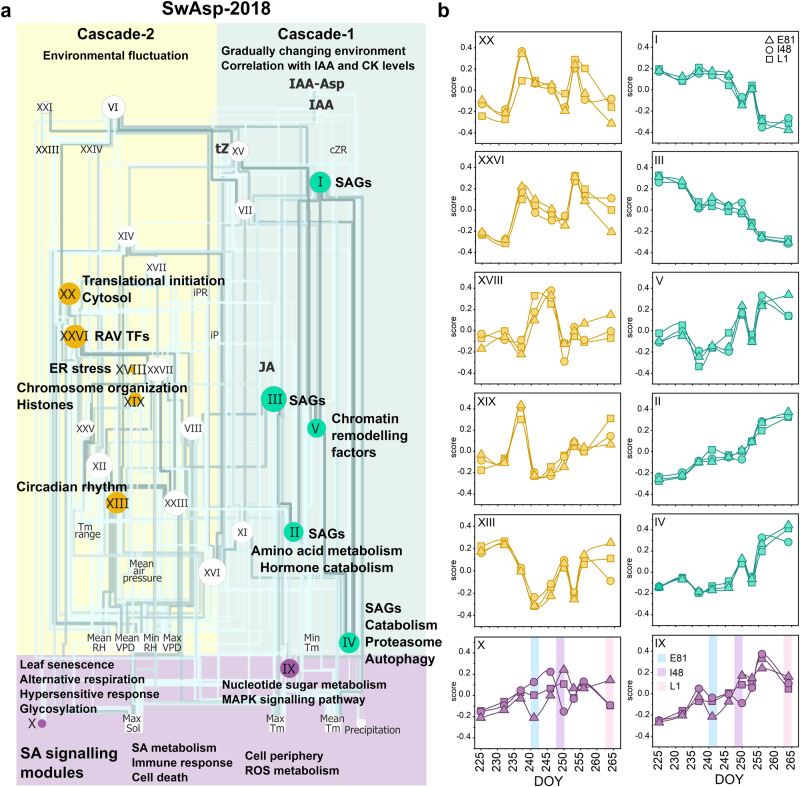
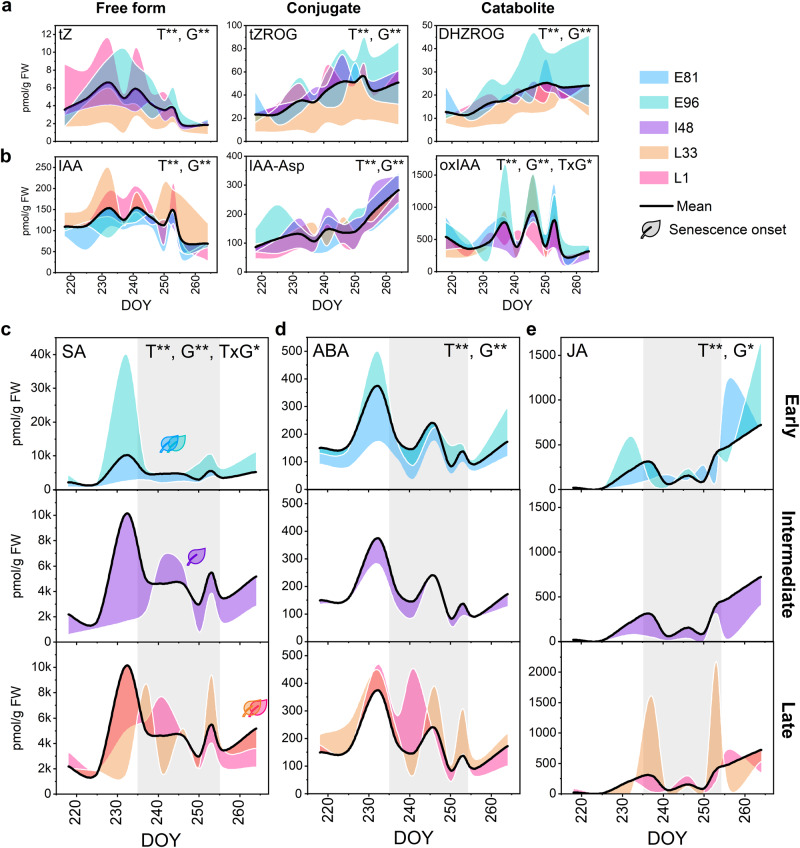
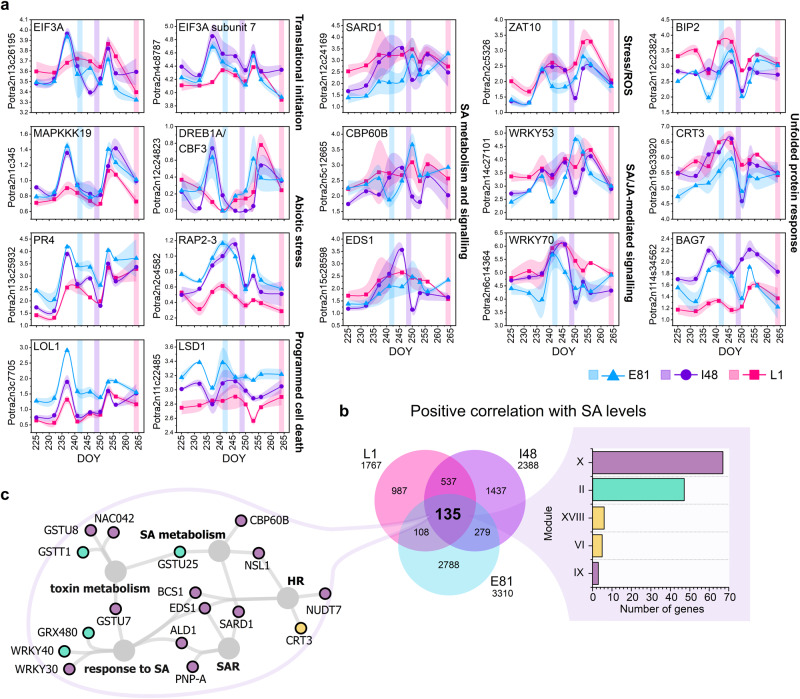
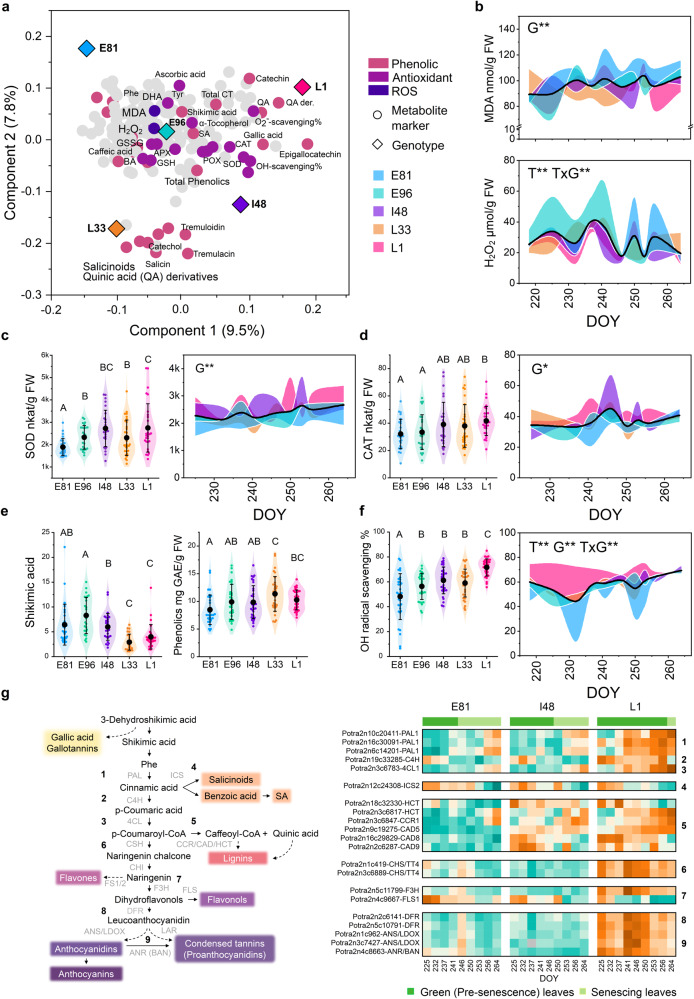
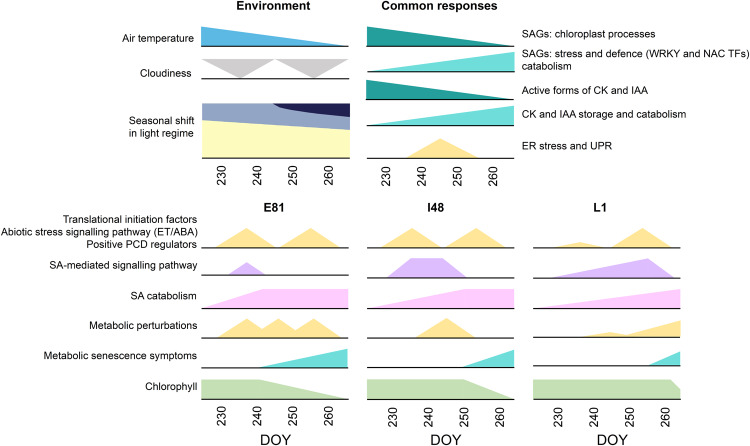
Deciduous trees exhibit a spectacular phenomenon of autumn senescence driven by the seasonality of their growth environment, yet there is no consensus which external or internal cues trigger it. Senescence starts at different times in European aspen (Populus tremula L.) genotypes grown in same location. By integrating omics studies, we demonstrate that aspen genotypes utilize similar transcriptional cascades and metabolic cues to initiate senescence, but at different times during autumn. The timing of autumn senescence initiation appeared to be controlled by two consecutive "switches"; 1) first the environmental variation induced the rewiring of the transcriptional network, stress signalling pathways and metabolic perturbations and 2) the start of senescence process was defined by the ability of the genotype to activate and sustain stress tolerance mechanisms mediated by salicylic acid. We propose that salicylic acid represses the onset of leaf senescence in stressful natural conditions, rather than promoting it as often observed in annual plants.


Conflict of interest statement

The authors declare no competing interests.

Figures

Fig. 1
Fig. 1. Autumn senescence phenotypes.
Swedish aspen (SwAsp) genotypes originating from the south (L1, L33), central (I48) and north (E81, E96) of Sweden were grown in a common garden in Sävar near Umeå (marked with a star, a). Genotype I201 is local to Umeå, situated at Umeå University campus, and its clones are part of the Umeå aspen collection grown in a common garden in Sävar (a). The onset and the rate of autumn senescence were determined based on the chlorophyll content index (CCI). Chlorophyll curves (CCI values as a mean of five leaves) are shown for the campus tree, I201, in autumn 2011 and for the three replicate trees of SwAsp genotypes in autumn 2018 (b). The variation in senescence onset date over the two study years is shown in a box plot representing mean (solid line), 25 and 75% quartiles and minimum and maximum values (whiskers) (c). Points present data over the two study years, data are from one parent tree in 2011 and four clonal replicates in the UmAsp collection in 2018 of genotype I201 (n = 5), and from three to four replicates of the SwAsp genotypes in each study year (n = 7, except n = 6 in E96). Minimum and maximum air temperature (C°), minimum relative air humidity (RH %), maximum vapour-pressure deficit (VPD, kPa) and maximum solar radiation (W m−2) in autumn 2011 and 2018 (d) in Umeå. Precipitation (monthly sum, mm) in autumn 2011 and 2018 (e) and the seasonal shift in the light environment in Umeå (f). Source data are provided as Source Data files.
Fig. 2
Fig. 2. Global transcriptome patterns in three SwAsp genotypes in autumn 2018 and meta-analysis of up- and downregulated genes during autumn in Populus spp.
Principal Component Analysis (PCA) scores plot (a) and time-dependent plots of the major principal component (PC) scores (b) of leaf transcriptome in three SwAsp genotypes in autumn 2018. The main variation in the transcriptome was explained by time (225–264 DOY, the day of the year) during autumn (PC1) and based on genotype (PC2). Data are mean ± SE (shadowed area), n = 3 in each time point per genotype, except n = 2 in 237 DOY in genotype I48. Venn diagram depicts the number of genes with significant time, genotype and interaction (time × genotype) effects (c). The enriched Gene Ontology (GO) and PFAM (protein family and domain) terms for the gene set with a significant interaction effect determined based on Likelihood Ratio Test (LRT, c). Venn diagram displays the overlap of up- and downregulated (log2 fc > 1.0) genes in autumn in four genotypes of aspen (P. tremula, d), and in comparison with two data sets in poplar (P. trichocarpa) (e). The lists of up- and downregulated genes in poplar leaves were obtained from Leaf Senescence Database(Poplar 1) and from Lu et al. (Poplar 2). The number of upregulated genes is in red, downregulated in blue, and shared genes between the data sets in bold. The enriched GO terms for biological processes of consistently up- and downregulated genes during autumn in aspen and in Populus spp. (f). The GO term nodes are coloured based on the proportion of shared genes in aspen and Populus spp. The expression patterns of senescence-enhanced WRKY, NAC and TGA transcription factors during autumn in three SwAsp genotypes (g, h). The data in the heatmap are mean expression normalised to z-score and the line graph shows the average expression of heatmap genes during autumn in each genotype relative to the overall mean, coloured area presents the difference between the genotype mean and the overall mean. The list of SAGs and GO term enrichment results are in Supplementary Data 2. Source data are provided as Source Data files.
Fig. 3
Fig. 3. Network analysis reveals two interlinked transcriptional regulatory cascades that respond to environmental cues and hormonal signals during autumn.
Weighted gene co-expression network analysis (WGCNA) was performed with transcriptome data from three aspen genotypes during autumn 2018. Network visualisation is based on the correlation between eigengenes (the signature expression pattern of the identified gene modules), weather parameters (past 24 h) and phytohormone levels (a) using a hierarchical layout in Cytoscape. Significant correlations (P-value < 0.05 two-sided in all genotypes) are depicted by edges that are coloured based on the correlation coefficient, darker shades depicting higher absolute Pearson r (a). The size of each node is proportional to its degree, larger node size depicting higher connectivity. Enriched Gene Ontology (GO) terms and Kyoto Encyclopedia of Genes and Genomes (KEGG) pathways in the gene modules are shown (a, see details in Supplementary Data 4). Cascade-1 comprises of modules that display gradual expression changes during autumn. Genes that are repressed or induced during autumn are regarded as senescence-associated genes (SAGs, see details in Fig. 2 and Supplementary Data 1). Modules in cascade-2 show transient expression changes (a). The two cascades are interlinked and connected with two gene modules (IX, X) enriched with genes involved in salicylic acid (SA) metabolism and signalling (a). The patterns of selected eigengenes in three SwAsp genotypes (b), n = 3 in each time point per genotype, except n = 2 at 237 DOY in genotype I48. A shaded vertical line represents senescence onset in each genotype that coincide with the transient down-regulation of the two SA signalling modules (b). Modules are numbered based on the descending number of assigned genes and coloured based on the assigned cascade (a, b). See details and all eigengene patterns in Fig. S11. Source data are provided as Source Data files. ER endoplasmic reticulum, SAGs senescence-associated genes, tZ trans-zeatin, iP isopentenyl adenine, IAA indole-3-acetic acid, IAA-Asp Indole-3-acetic acid-aspartate.
Fig. 4
Fig. 4. Aspen genotypes show different dynamics of salicylic acid levels during autumn.
The levels of trans-zeatin (cytokinin, CK) metabolites (a), auxin (IAA) metabolites (b), salicylic acid (SA, c), abscisic acid (ABA, d) and jasmonic acid (JA, e) in the leaves of five SwAsp genotypes in autumn 2018 (all detected hormones in Fig. S8). The grey area represents the main stress period during autumn presented by the transcriptional responses (cascade-2 Fig. 3). The effects of time (T, nine time points 218–264 DOY), genotype (G) and their interaction (T×G) were tested with two-way ANOVA (FDR adjusted P-value < 0.01**, <0.05*). Metabolite levels are expressed relative to the mean, coloured area presents the difference between the genotype mean and the overall mean (n = 2–3) in each time point per genotype, see the details of n and statistical test results in Supplementary Data 14. Source data are provided as Source Data files. tZ trans-zeatin, tZROG trans-zeatin-O-glucoside riboside, DHZROG dehydrozeatin-O-glucoside riboside, oxIAA 2-oxindole-3-acetic acid, IAA-Asp Indole-3-acetic acid-aspartate.
Fig. 5
Fig. 5. Endogenous levels of salicylic acid affect the transcriptional response in aspen leaves.
The expression patterns of selected genes involved in translational initiation, abiotic stress responses, programmed cell death (PCD), the salicylic acid (SA)-mediated signalling pathway and unfolded protein response (UPR) (a). Data are mean ± SE (shadowed area), n = 3 in each time point per genotype, except n = 2 in I48 on 237 DOY. A shaded vertical line represents senescence onset in each genotype. Venn diagram displays the number of genes with significant positive correlation with SA levels in the three aspen genotypes (b). Bar chart shows the assigned modules and cascades for the genes with significant correlation (Pearson r, P-value < 0.05 two-sided) with SA levels in three genotypes (b). Gene ontology (GO) term network was constructed with genes with positive correlation with SA levels in three genotypes (c). Significantly enriched GO terms are shown, and the nodes (genes) are coloured based on the cascade the genes were assigned to. See the expression patterns of additional genes related to the biological processes in Fig. S16, extended GO term network in Fig. S18 and the list of genes with significant correlation with SA in aspen genotypes in Supplementary Data 15. Source data are provided as Source Data files.
Fig. 6
Fig. 6. Network analysis displays a connection between salicylic acid catabolite levels and metabolic responses during autumn.
Principal component analysis (PCA) including 183 metabolic markers in the leaves of five SwAsp genotypes in autumn 2018 (a). Time-dependent patterns of the first (PC1 17.4%) and the third principal components (PC3 7.5%) displaying variation across time points (b, see PC1 vs. PC2 in Fig. S20). Data are mean ± SE (shadowed area), n = 2–3 in each time point per genotype, see the details for n in a particular genotype and time point are in Source Data files and Supplementary Data 14. Genotypic levels of salicylic acid (SA) catabolite: 2,3-dihydroxybenzoic acid (2,3-OH-BA), during autumn (c). Violin plot shows the data points (n = 25 in E96, n = 26 in L33, n = 29 in E81 and L1, and n = 30 in I48), black dot presents the mean, and the whiskers SD (c). Temporal patterns of selected metabolite levels and the metabolic network structure visualised with the consistent metabolite relationships in all five genotypes in autumn 2018 (between 218–264 DOY, (d). Metabolite levels in SwAsp leaves are expressed relative to the mean, coloured area presents the difference between the genotype mean and the overall mean (d). The significant relationships (edges with P-value < 0.05 two-sided) are shown and coloured based on the correlation coefficient (darker colour depicts higher absolute Pearson r), the edges common for all five genotypes are shown (d). The size of the node is proportional to its degree, larger node size depicting higher connectivity. Diamond shapes mark up- and downregulated metabolites in senescing/late-senescence phase leaves compared to green leaves (Fig. S21, Supplementary Data 16). Venn diagram (e) depicts the number of metabolite markers with significant time (T, nine time points 218–264 DOY), genotype (G) and interaction (T × G) effects determined with two-way ANOVA (FDR adjusted P-value < 0.01**, <0.05*), Post-Hoc test for genotype were performed with Fisher’s Least Significant Difference (LSD), different letters present significantly different means (P < 0.05 two-sided, details in Supplementary Data 14). Heatmap shows the expression of genes involved in the metabolic processes in three SwAsp genotypes (f). Values are mean VST-counts normalised to z-scores. Source data are provided as Source Data files and Supplemental Data sets.
Fig. 7
Fig. 7. Senescence phenotypes are related to the capacity of the genotype to induce and sustain enzymatic and metabolic antioxidant systems.
OPLS-DA (Orthogonal Projections to Latent Structures Discriminant Analysis) plot (the first two predictive components) shows the separation of five SwAsp genotypes based on the profile of 183 metabolite markers (a). ROS and metabolites with profound antioxidant functions are coloured (a). The temporal patterns of malondialdehyde (MDA nmol/g FW) and hydrogen peroxide (H2O2 µmol/g FW) levels (b). The temporal patterns and overall activities of superoxide dismutase (SOD, c) and catalase (CAT, d). The levels of shikimic acid (precursor) and total phenolics (e) and the hydroxy radical (OH) scavenging capacity (%) of the leaf extracts (f). Phenylpropanoid pathway and the expression of putative genes encoding enzymes in the pathway (g) in three SwAsp genotypes (z-score normalised values, mean n = 2–3 in each time point per genotype). Levels and activities through the time course in each genotype (mean, n = 3) are presented relative to the overall mean, coloured area represents the difference between the genotype mean and the overall mean. Violin plots display all data points during the study period in each genotype (218–264 DOY, n = 25 in E96, n = 26 in L33, n = 29 in E81 and L1, and n = 30 in I48), black dot represents the mean and whiskers standard deviation (±SD). The effects of time, genotype and their interaction were tested with two-way ANOVA (FDR adjusted P-value < 0.05*, <0.01**). The different letters mark significantly different means between the genotypes (Fisher’s Least Significant Difference LSD, P-value < 0.05 two-sided). See the details of statistical analyses in Supplementary Data 14 and other ROS markers in Fig. S23. Source data are provided as Source Data files and Supplemental Data sets.
Fig. 8
Fig. 8. Aspen genotypes show similar transcriptional and metabolic responses leading to senescence onset at different times during autumn.
Simplified illustration of environmental parameters and transcriptional and metabolic responses in aspen leaves in autumn 2018. Genotypes showed mainly similar changes in the expression of senescence-associated genes (SAGs) and in the levels of cytokinin (CK) and auxin (IAA) metabolites, that correlated with decreasing air temperature during autumn. In addition, the expression of genes related to endoplasmic reticulum (ER) stress and unfolded protein response (UPR) was enhanced in mid-autumn irrespective of genotype. At the transcriptional level, the expression of genes involved in translational initiation, abiotic stress signalling in response to ethylene (ET) or abscisic acid (ABA) and programmed cell death (PCD) was enhanced, and genes related to salicylic acid (SA) metabolism and signalling pathway repressed at different times during autumn in aspen genotypes and those responses preceded and coincided with senescence onset, respectively. At the metabolite level, genotypes showed enhanced SA catabolism and perturbed primary metabolism before the onset. Typical metabolic senescence symptoms appeared around the same time as the chlorophyll content started to rapidly decline marking the initiation of nutrient recycling and senescence.
Fig. 9
Fig. 9. Salicylic acid metabolism and signalling pathway coordinate the onset of autumn senescence in nature.
a Environmental variation leads to the re-wiring of transcriptional network and upregulation of genes encoding cytoplasmic translation initiation factors (TIFs/eIFs), ethylene (ET)-, abscisic acid (ABA)- and other abiotic stress-responsive genes along with positive programmed cell death (PCD) regulators. This response and other stress responses (ER stress, ROS formation) predominantly predispose the trees for senescence onset (pro-senescence factors). Gradually- and slowly-developing senescence symptoms and abrupt perturbations escalate the metabolic constraints resulting in senescence onset if counteractive defence responses that are largely mediated by salicylic acid (SA) signalling are not activated and maintained (anti-senescence factors). b Hypothetical model displays the connections and potential mediators between biological processes involved in the regulation of autumn senescence onset. Genotypic sensitivity to external and internal cues is likely associated with receptor proteins at the interface of signal perception. ER stress in autumn can hinder the maturation and establishment of receptors and thus signal transduction. The SA signalling pathway can promote protein glycosylation and protein folding via an ER-quality control (ERQC) system that alleviates ER stress. In addition, the SA signalling pathway can antagonise abiotic stress signalling activated before senescence onset and promote cellular respiration and redox status. Hence, we propose that autumn senescence onset in aspen is conditional upon the activation of pro-senescence factors in response to environmental conditions and evoked metabolic stress, whereas the timing of chlorophyll depletion can be delayed to a certain extent by upregulation of SA levels and the associated transcriptional programme that promote defence mechanisms. The de-regulation of SA metabolism and signalling thereby compromises cellular functions potentiating pro-senescence factors to initiate autumn senescence and developmental PCD in aspen leaves.

Similar articles

Cited by

References

    1. Gepstein S. Leaf senescence - not just a ‘wear and tear’ phenomenon. Genome Biol. 2004;5:212. doi: 10.1186/gb-2004-5-3-212. - DOI - PMC - PubMed
    1. Woo HR, Kim HJ, Nam HG, Lim PO. Plant leaf senescence and death – regulation by multiple layers of control and implications for aging in general. J. Cell Sci. 2013;126:4823–4833. - PubMed
    1. Woo HR, Kim HJ, Lim PO, Nam HG. Leaf senescence: systems and dynamics aspects. Annu. Rev. Plant Biol. 2019;70:347–376. doi: 10.1146/annurev-arplant-050718-095859. - DOI - PubMed
    1. Buchanan-Wollaston V, et al. The molecular analysis of leaf senescence – a genomics approach. Plant Biotechnol. J. 2003;1:3–22. doi: 10.1046/j.1467-7652.2003.00004.x. - DOI - PubMed
    1. Buchanan-Wollaston V, et al. Comparative transcriptome analysis reveals significant differences in gene expression and signalling pathways between developmental and dark/starvation-induced senescence in Arabidopsis. Plant J. 2005;42:567–585. doi: 10.1111/j.1365-313X.2005.02399.x. - DOI - PubMed

Publication types