. 2023 Jul 18;14(1):4297.
doi: 10.1038/s41467-023-40086-3.

HCK induces macrophage activation to promote renal inflammation and fibrosis via suppression of autophagy

Affiliations

HCK induces macrophage activation to promote renal inflammation and fibrosis via suppression of autophagy

Man Chen et al. Nat Commun. .

Abstract

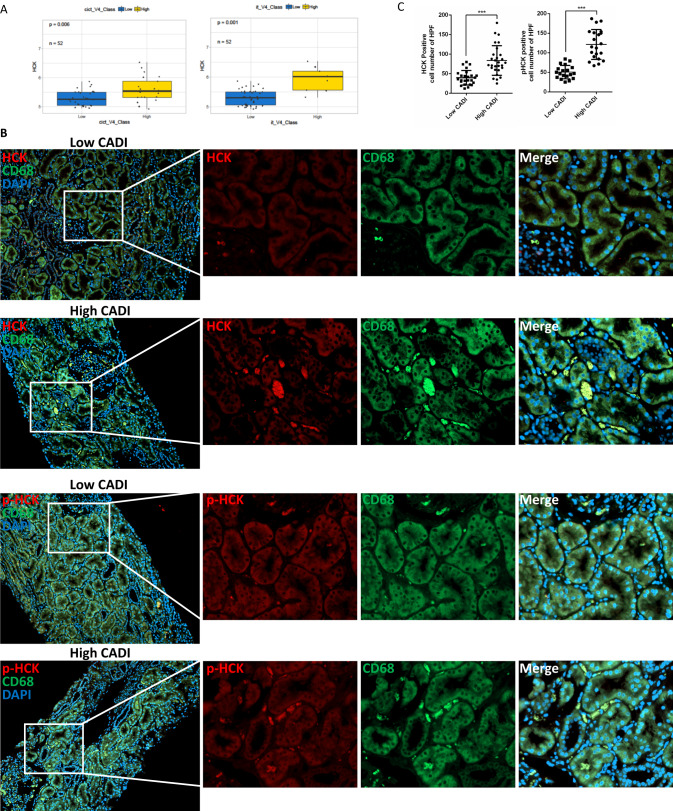
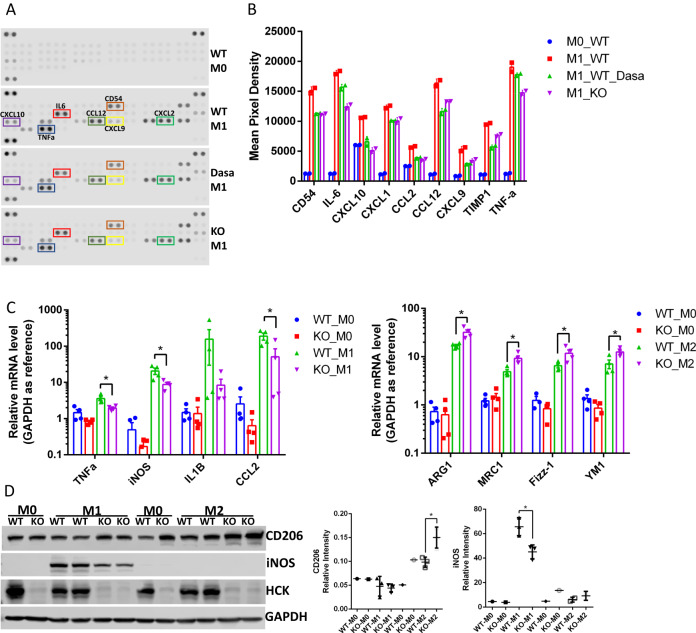
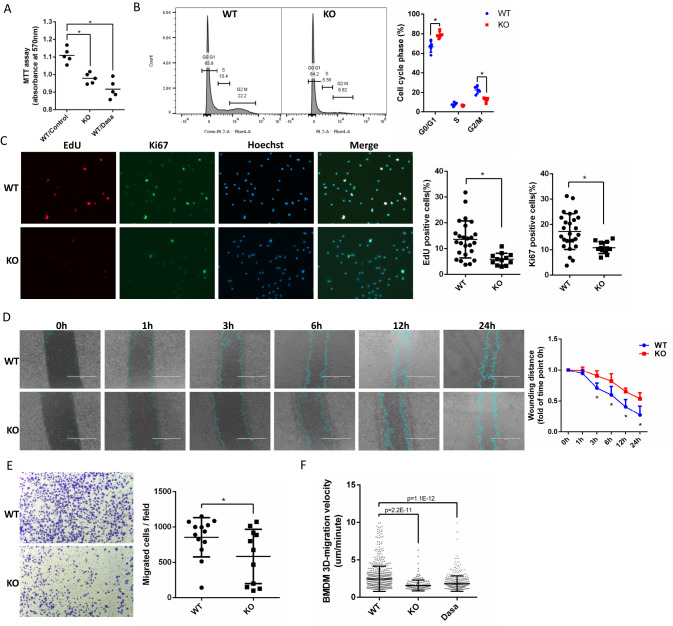
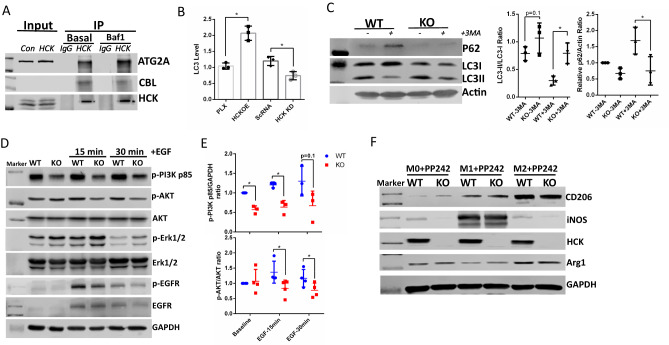
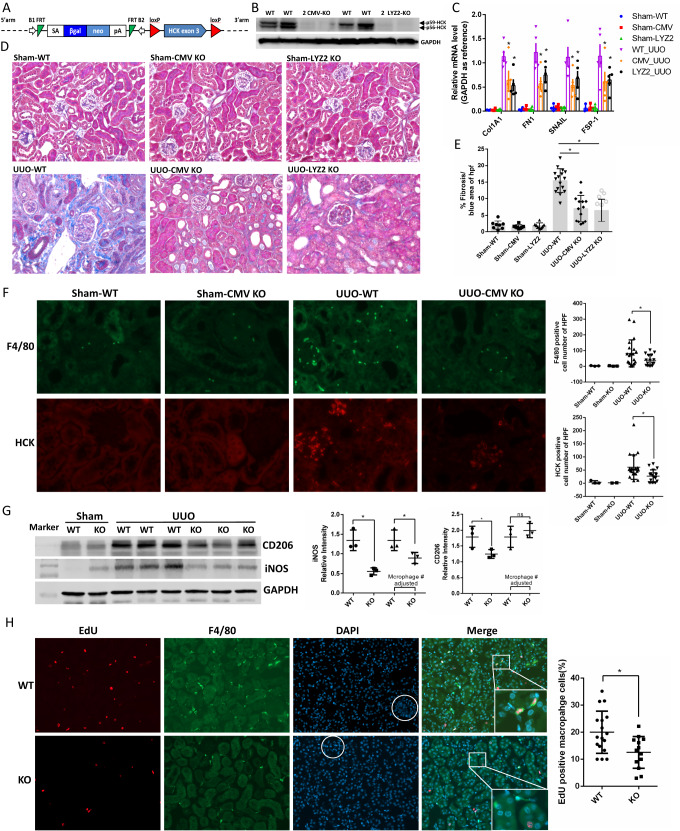
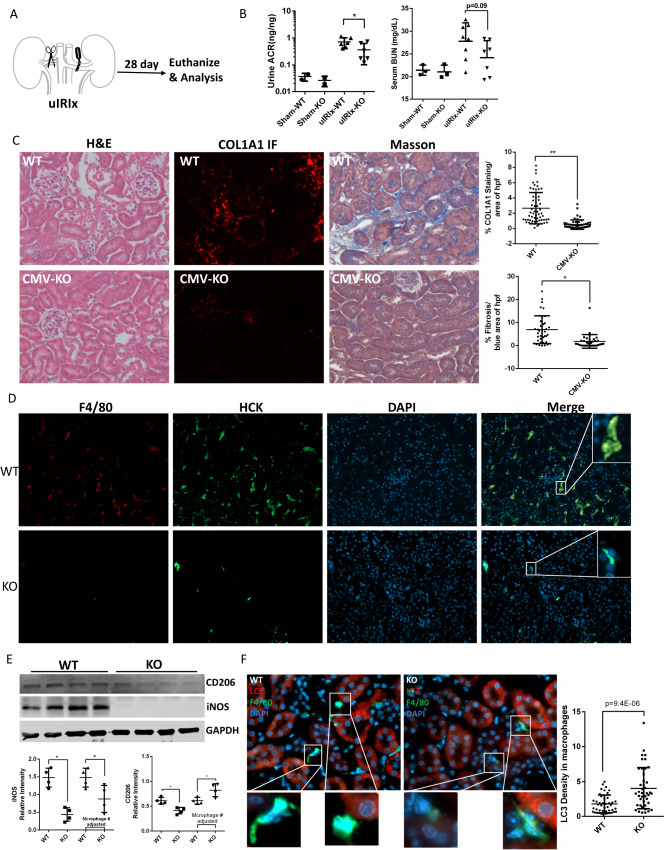
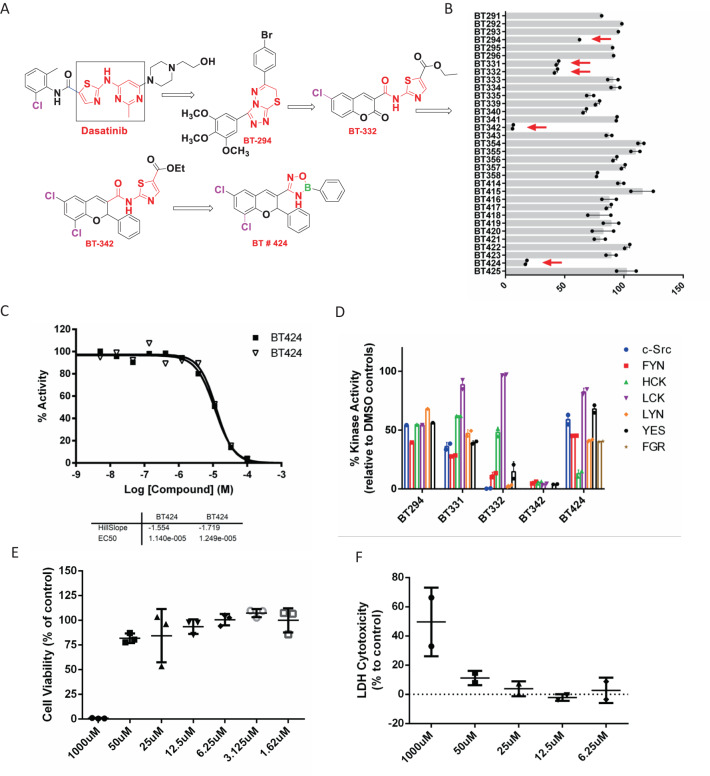
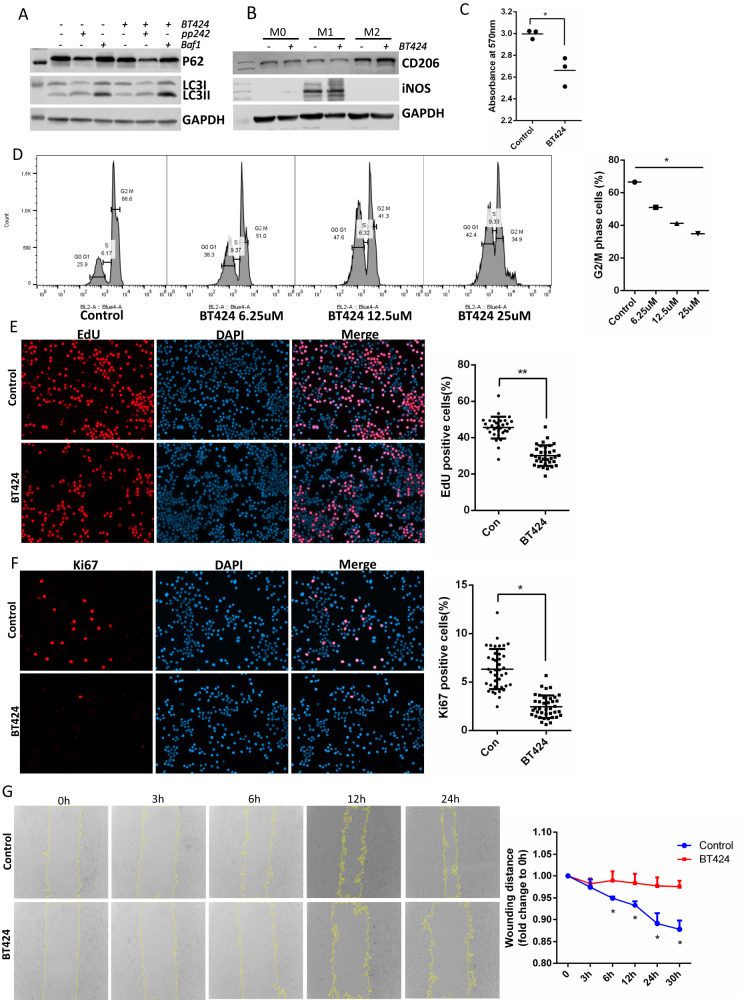
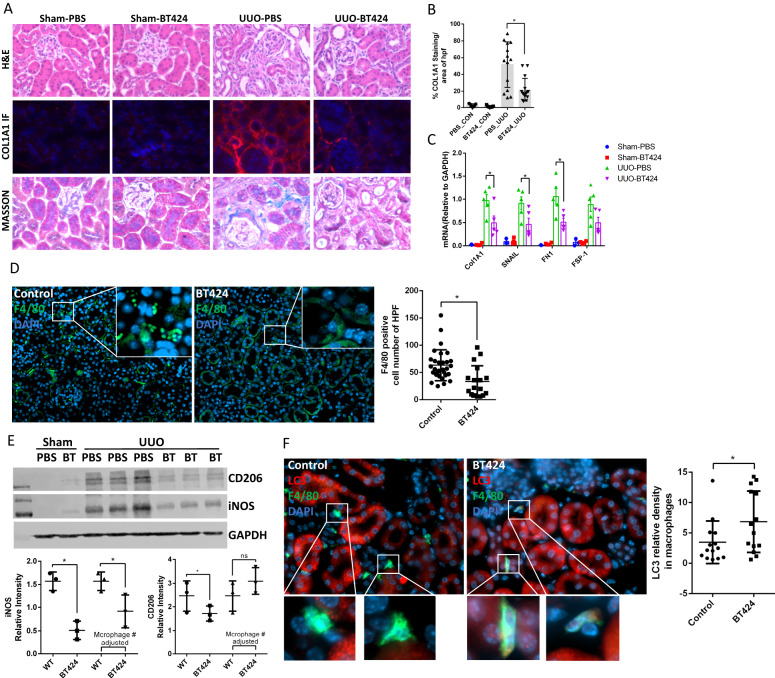
Renal inflammation and fibrosis are the common pathways leading to progressive chronic kidney disease (CKD). We previously identified hematopoietic cell kinase (HCK) as upregulated in human chronic allograft injury promoting kidney fibrosis; however, the cellular source and molecular mechanisms are unclear. Here, using immunostaining and single cell sequencing data, we show that HCK expression is highly enriched in pro-inflammatory macrophages in diseased kidneys. HCK-knockout (KO) or HCK-inhibitor decreases macrophage M1-like pro-inflammatory polarization, proliferation, and migration in RAW264.7 cells and bone marrow-derived macrophages (BMDM). We identify an interaction between HCK and ATG2A and CBL, two autophagy-related proteins, inhibiting autophagy flux in macrophages. In vivo, both global or myeloid cell specific HCK-KO attenuates renal inflammation and fibrosis with reduces macrophage numbers, pro-inflammatory polarization and migration into unilateral ureteral obstruction (UUO) kidneys and unilateral ischemia reperfusion injury (IRI) models. Finally, we developed a selective boron containing HCK inhibitor which can reduce macrophage pro-inflammatory activity, proliferation, and migration in vitro, and attenuate kidney fibrosis in the UUO mice. The current study elucidates mechanisms downstream of HCK regulating macrophage activation and polarization via autophagy in CKD and identifies that selective HCK inhibitors could be potentially developed as a new therapy for renal fibrosis.


Conflict of interest statement

The authors declare no competing interests.

Figures

Fig. 1
Fig. 1. HCK’s expression was associated with inflammation and fibrosis in allograft biopsies.
A The expression of HCK was up-regulated in high i + t and ci+ct scores (>=2 vs. <2) vs low scores in allograft biopsies at 12 months after transplantation. B IHC Staining of phosphorylated-HCK, HCK and CD68 in high chronic allograft damage index (CADI) and low CADI allograft kidneys. C Quantification (n = 4 biopsies/group; 5-6 random fields/biopsy) of the phosphorylated-HCK and HCK positive cells in the high and low CADI biopsies. i, interstitial inflammation; t, tubulitis. ci, interstitial fibrosis; ct, tubular atrophy. ***p < 0.001. Source data are provided as a Source Data file.
Fig. 2
Fig. 2. Inhibiting HCK activity by inhibitor and HCK KO regulated macrophage polarization in BMDM and Raw264.7.
A Cytokine antibody array was performed with cultured medium from control, dasatinib treated and HCK KO BMDMs. B Quantification of cytokines with the average of two dots pixel density from cytokine assay. qPCR (C) and western blot (D) demonstrated that HCK KO decreased M1 and increased M2 macrophage polarization in BMDM cells. BMDM were isolated from WT and HCK KO mice and induced with LPS/IFNγ or IL-4 after culture for 7 days. C, D *p < 0.05. Dasa: dasatinib. Source data are provided as a Source Data file.
Fig. 3
Fig. 3. Inhibiting HCK activity and HCK KO decreased macrophage proliferation, and migration in BMDM and Raw264.7.
A BMDM cells of WT and HCK KO and dasatinib treatment were tested with MTT assay for cell proliferation. B Representative image and quantification of propidium Iodide (PI) stain detected with flow cytometric to measure cell cycle for WT and HCK KO BMDM. C Click-iT™ Edu cell proliferation assay and Ki67 IF staining were performed to measure WT and HCK KO BMDM proliferating. D Scratch assay was performed in BMDM cells for WT and HCK KO to measure cell migration. The blue lines are the scratch edge of the cells generated by the software when to measure the scratch distance. E 3D transwell assay with Matrigel® Matrix to measure cell migration for WT and HCK KO in BMDMs. F 3D-random migration analysis was performed with long time live cell imaging for BMDMs with WT, HCK KO and dasatinib treatment. (AE) *p < 0.05. Source data are provided as a Source Data file.
Fig. 4
Fig. 4. HCK regulated macrophage polarization through autophagy.
A Endogenous HCK interacted with autophagy proteins ATG2A and CBL in macrophage cell line Raw264.7 by IP/WB. B Overexpression of HCK inhibited autophagy flux as more LC3 HiBiT reporter remained. HCK knockdown promoted autophagy flux as less LC3 HiBiT reporter remained. C HCK KO could promote autophagy by increasing LC3II/LC3I and decrease P62 levels with and without 3-MA treatment in mice BMDM cells. Western blots (D) and quantification (E) showed phospho-PI3K and phospho-AKT decreased in HCK KO BMDMs. However, there were no significant differences for phospho-Erk1/2 and phospho-EGFR with HCK KO. F Effect of HCK KO was abrogated in autophagy inducing by PP242 treatment. Baf1: bafilomycin A1. 3-MA: 3-methyladenine. Source data are provided as a Source Data file.
Fig. 5
Fig. 5. HCK knockout globally and in myeloid cell ameliorated kidney fibrosis in a murine UUO model.
A Schematic diagram shows the strategy of loxP-HCK knock-out mice developed in EuMMCR. B Western blot demonstrated HCK global (CMV) and myeloid cell specific (LYZ2) KO in BMDM from mice. C mRNA levels of pro-fibrotic markers were decreased in HCK global and myeloid cell KO UUO kidneys compared to WT mice. D Representative Masson’s trichrome staining images from sham operated & UUO kidneys of WT, CMV KO and LYZ2 KO mice at 7 days post-UUO. E Morphometric quantification (n = 5 animals; 5 random fields/animal) of the fibrosis positive area for Masson stain. F Immunofluorescence (IF) stain indicated F4/80 positive macrophage and HCK both dramatically decreased in HCK KO UUO kidneys. G Western blot to show M1 and M2 macrophage markers and quantification of band intensity and adjusted by macrophage number in UUO kidneys. H Representative images and quantification (n = 5 animals; 5 random fields/animal) of IF staining for EdU positive F4/80 macrophages in UUO kidneys. (C, E, F, G and H) *p < 0.05. Source data are provided as a Source Data file.
Fig. 6
Fig. 6. HCK knockout reduced kidney fibrosis in uIRIx model with regulation of macrophage activation.
A Schematic diagram of strategy of uIRIx models. B Urine ACR and serum BUN for WT and HCK KO uIRIx mice. C Representative images of H&E, COL1A1 IF and Masson trichrome staining from WT and KO uIRIx kidneys. Morphometric quantification (n = 5 animals; 5 random fields/animal) of the COL1A1 (top) and Masson (lower) positive area. D Representative IF staining images and quantification of from kidneys of HCK and F4/80 macrophage from WT and HCK KO uIRIx kidneys. E Western blot and quantification of M1 and M2 macrophage markers from WT and HCK KO mice kidneys at 28 days post uIRIx. F Representative IF staining images and quantification of LC3 in macrophages from WT & HCK KO uIRIx kidneys. B, C and E *p < 0.05 with t test. Source data are provided as a Source Data file.
Fig. 7
Fig. 7. Development of selective HCK inhibitors and identification of BT424 as a specific HCK inhibitor.
A SAR study of dasatinib to design selective HCK inhibitors. B Screen HCK specific inhibitors for all our designed compounds. Five inhibitors (BT294, 331, 332, 342 and 424) with high efficiency of HCK inhibitions are highlighted in red arrows. C HCK inhibition profiling for BT424 with 10 dose 1:3 serial dilution. D Inhibition of all SFKs for 6 candidate HCK inhibitors at 50uM. SFKs inhabitation assay was performed at Reaction Biology Corp. Values were shown for % of enzyme activity compared to DMSO control. Cell proliferation (E) and cytotoxicity (F) were measured by MTT assay and release LDH with various concentration of BT424 for 24 h in Raw264.7 cells. Source data are provided as a Source Data file.
Fig. 8
Fig. 8. HCK inhibitor BT424 regulated macrophage activation and autophagy in vitro.
Western blot to show BT424 regulation of autophagy (A) and macrophage polarization (B) in Raw264.7 macrophage cell line. C MTT assay was tested for BT424 treatment with gradient dosages for cell proliferation in Raw264.7. D Representative of flow cytometric image and quantification for propidium Iodide (PI) stain to measure cell cycle for control and BT424 treatment in Raw264.7 cells. E Click-iT™ EdU cell proliferation assay and Ki67 IF staining (F) were performed to measure proliferation of Raw264.7 with control and BT424 treatment. G Scratch assay was performed in Raw264.7 cells for control and BT424 treatment. The yellow lines are the scratch edge of the cells generated by the software when to measure the scratch distance. CG *p < 0.05, D with ANOVA test, others with t test. Baf1: bafilomycin A1. Source data are provided as a Source Data file.
Fig. 9
Fig. 9. Inhibition of HCK by BT424 reduced renal fibrosis process in UUO model by regulating macrophage activation and autophagy.
A Representative images of H&E, COL1A1 IF and Masson trichrome stain from sham operated & UUO kidneys of BT424- or vehicle-treated mice. B Morphometric quantification (n = 5 animals; 3-4 random HPFs/animal) of the COL1A1 IF stain positive area. C mRNA levels of pro-fibrotic markers at 7 days post-UUO by qPCR. D IF stain showed F4/80 positive macrophage dramatically decreased in BT424 treated UUO kidneys. E Western blot assay demonstrated macrophage makers in 7 days post-UUO kidneys. Quantification for bands intensity and adjusted by macrophage cell numbers. F IF stain showed LC3 intensity was increased in F4/80 positive macrophage in BT424 treated UUO kidneys. BF t test *p < 0.05. Source data are provided as a Source Data file.

References

    1. Jha V, et al. Chronic kidney disease: global dimension and perspectives. Lancet. 2013;382:260–272. doi: 10.1016/S0140-6736(13)60687-X. - DOI - PubMed
    1. Mosser DM, Edwards JP. Exploring the full spectrum of macrophage activation. Nat. Rev. Immunol. 2008;8:958–969. doi: 10.1038/nri2448. - DOI - PMC - PubMed
    1. Harris RC, Neilson EG. Toward a unified theory of renal progression. Annu. Rev. Med. 2006;57:365–380. doi: 10.1146/annurev.med.57.121304.131342. - DOI - PubMed
    1. Schroder K, Tschopp J. The inflammasomes. Cell. 2010;140:821–832. doi: 10.1016/j.cell.2010.01.040. - DOI - PubMed
    1. Nathan C, Ding A. Nonresolving inflammation. Cell. 2010;140:871–882. doi: 10.1016/j.cell.2010.02.029. - DOI - PubMed

Publication types