. 2023 Jul 18;14(1):4312.
doi: 10.1038/s41467-023-39965-6.

Mislocalization of pathogenic RBM20 variants in dilated cardiomyopathy is caused by loss-of-interaction with Transportin-3

Affiliations

Mislocalization of pathogenic RBM20 variants in dilated cardiomyopathy is caused by loss-of-interaction with Transportin-3

Julia Kornienko et al. Nat Commun. .

Abstract

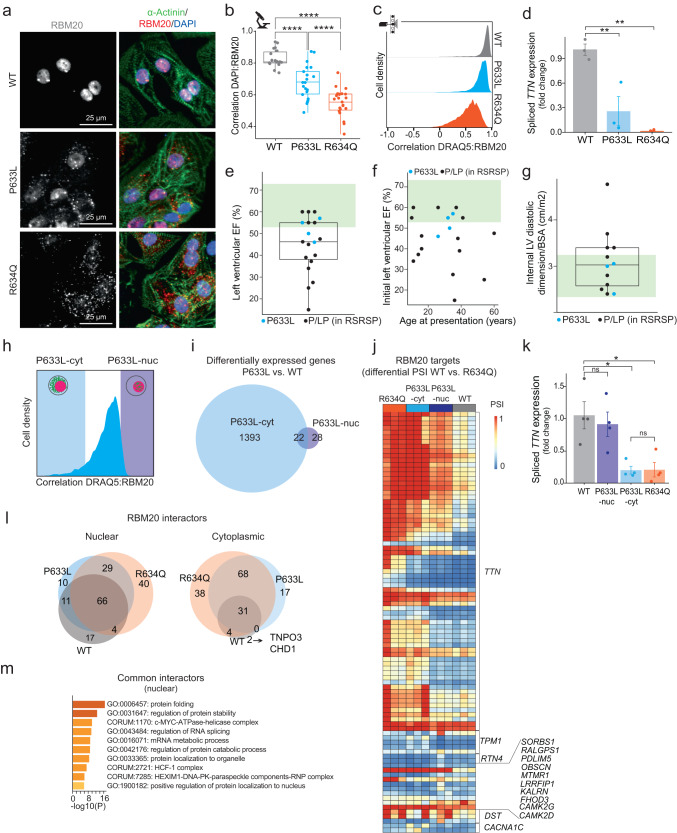
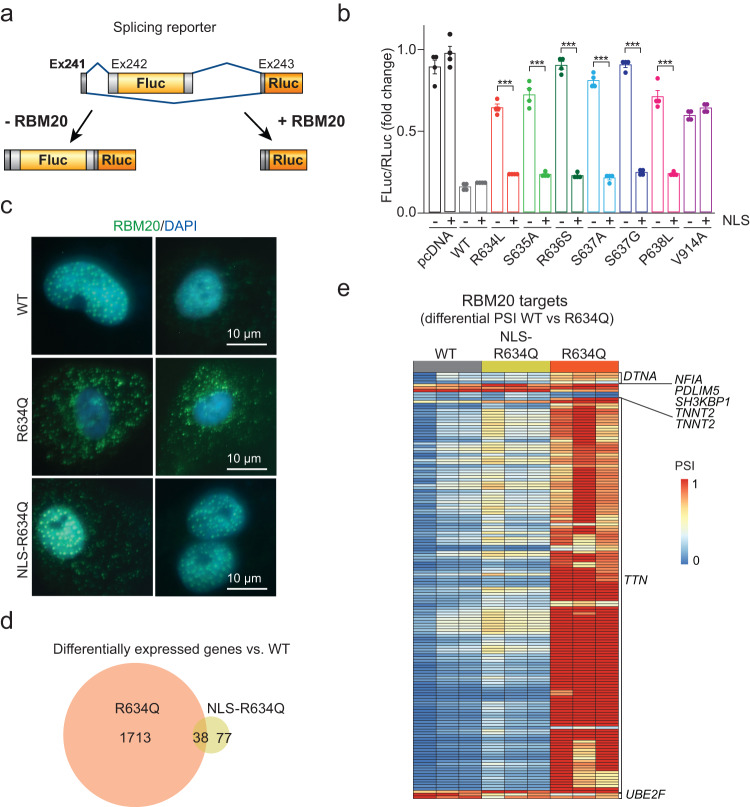
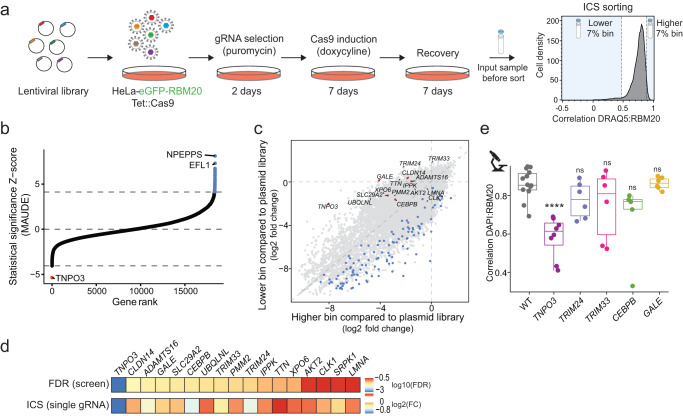
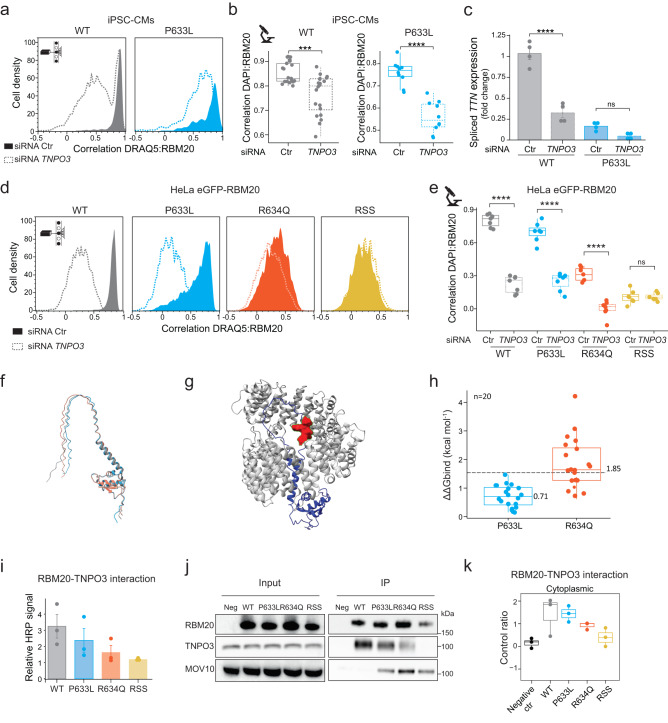
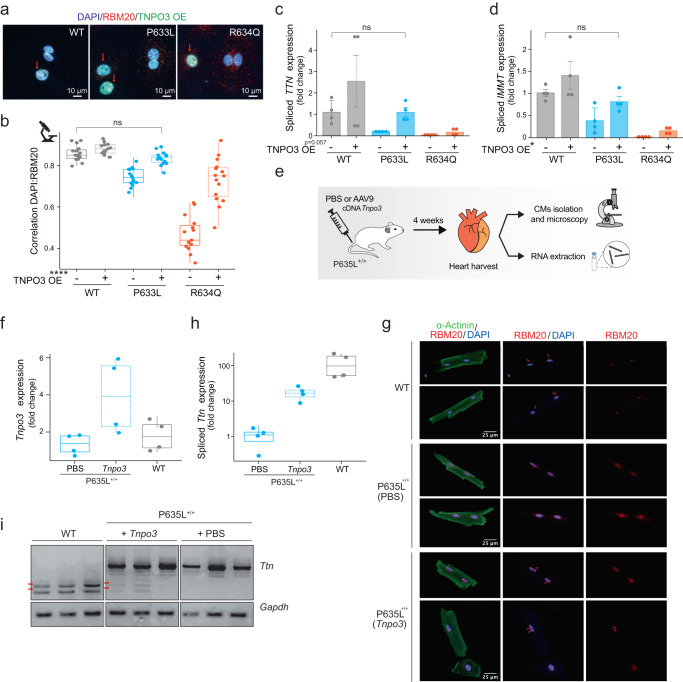
Severe forms of dilated cardiomyopathy (DCM) are associated with point mutations in the alternative splicing regulator RBM20 that are frequently located in the arginine/serine-rich domain (RS-domain). Such mutations can cause defective splicing and cytoplasmic mislocalization, which leads to the formation of detrimental cytoplasmic granules. Successful development of personalized therapies requires identifying the direct mechanisms of pathogenic RBM20 variants. Here, we decipher the molecular mechanism of RBM20 mislocalization and its specific role in DCM pathogenesis. We demonstrate that mislocalized RBM20 RS-domain variants retain their splice regulatory activity, which reveals that aberrant cellular localization is the main driver of their pathological phenotype. A genome-wide CRISPR knockout screen combined with image-enabled cell sorting identified Transportin-3 (TNPO3) as the main nuclear importer of RBM20. We show that the direct RBM20-TNPO3 interaction involves the RS-domain, and is disrupted by pathogenic variants. Relocalization of pathogenic RBM20 variants to the nucleus restores alternative splicing and dissolves cytoplasmic granules in cell culture and animal models. These findings provide proof-of-principle for developing therapeutic strategies to restore RBM20's nuclear localization in RBM20-DCM patients.


Conflict of interest statement

L.M.S. is a co-founder and shareholder of Sophia Genetics. The authors J.K., M.R.M., K.F., M.Go., and L.M.S. filed an invention disclosure describing TNPO3 and restoring nuclear localization of RBM20 variants discussed in this paper (U.S. Provisional Patent Application No. 63/452,252, status: filed: March 15, 2023). M.Go. is an advisor for River Biomedics. A.M.S. received educational grants through his institution from Abbott, Bayer Healthcare, Biosense Webster, Biotronik, Boston Scientific, BMS/Pfizer, and Medtronic; and speaker/advisory board/consulting fees from Bayer Healthcare, Biotronik, Daiichi-Sankyo, Medtronic, Novartis, Pfizer, and Stride Bio Inc. V.N.P. is a consultant and/or advisor for Lexeo Therapeutics, BioMarin, Inc, Viz.ai and Nuevocor. The remaining authors declare no competing interests.

Figures

Fig. 1
Fig. 1. Splice-regulatory activity of RBM20 variants is proportional to their nuclear localization.
a Immunofluorescence (IF) staining for RBM20 and alpha-actinin in iPSC-CMs, n = 3. b DAPI:RBM20 colocalization based on data from (a). Each dot represents a Pearson coefficient for at least five cells, n = 3. c ICS-based analysis of DRAQ5:RBM20 correlation in iPSC-CMs, n = 3. d qPCR analysis of TTN exon 242 splicing-out in iPSC-CMs normalized to GAPDH expression displayed as fold change versus the first replicate of RBM20-WT (means with standard errors, n = 3). e Left ventricular ejection fraction (LVEF) for patients with P633L (n = 4) or with other pathogenic or likely pathogenic (P/LP) mutations in the RSRSP stretch (n = 15) at diagnosis (norm for healthy individuals: 53 to 73%, green shading). Mean LVEF for P633L vs. P/LP variants: 52 ± 4.9% vs 43.1 ± 13.9%, P = 0.059 (two-sided T-test). f Initial LVEF as a function of the age at presentation (norm for healthy individuals: 53 to 73%, green shading, R2 = 0.001, P = 0.89, linear regression). g Internal Left Ventricular Diastolic Dimension (LVIDd) corrected for body size (norm for healthy individuals: 2.4–3.2 cm/m2, green shading). Mean LVIDd/BSA for P633L (n = 3) vs. P/LP variants (n = 9): 3.2 ± 0.74% vs 2.8 ± 0.26%, P = 0.28 (two-sided T-test). h ICS-sorting strategy for RBM20-P633L, n = 3. i Numbers of differentially expressed genes (|log2FC| > 1 and P < 0.1, Wald test with Benjamini–Hochberg correction, DeSeq2) in pairwise comparisons to RBM20-WT, n = 3. j PSI values for alternative splicing events in the core RBM20 targets different between WT and R634Q (|delta PSI| > 0.1, P value < 0.05, two-sided T-test). k qPCR analysis of TTN exon 242 splicing-out in sorted iPSC-CMs, same representation as (d), two biological replicates, with two technical replicates each. l Enriched RBM20 interactors (FDR < 0.05 (Limma), and |log2FC| > 0.5 vs. no-bait control) in HeLa, n = 3. m Pathway enrichment analysis for common interactors between RBM20-WT, -P633L, and -R634Q in the nuclear fraction, Metascape. Boxplots (b, e, g) display quartiles Q1, Q2 (center), and Q3, with whiskers extending to the furthest data points within 1.5 times interquartile range (IQR). Statistical significance for (b, d, k) was calculated using one-way ANOVA with Tukey’s HSD post test (two-tailored): Ns = not significant, *P < 0.05, **P < 0.01, ***P < 0.001, ****P < 0.0001. Actual P values are shown in the source data file.
Fig. 2
Fig. 2. Restoring nuclear localization of RS-domain RBM20 variants rescues their splicing function.
a Illustration of the splicing reporter assay. b Ratio of Fluc to Rluc in empty vector control-transfected (pcDNA) or +/– SV40 NLS RBM20 (WT, R634L, S635A, R636S, S637A, S637G, P638L, V914A)-transfected HEK293T cells. Data from one representative experiment is shown, a total of four experiments were analyzed. Each bar shows a mean of four technical replicates with standard errors indicated. c iPSC-CMs with a frameshift (S635FS) mutation transduced with eGFP-WT, eGFP-R634Q, or eGFP-NLS-R634Q, representative images, n = 3. d Numbers of significantly (| log2FC | > 1 and P < 0.1, Wald test with Benjamini–Hochberg correction, DeSeq2) differentially expressed genes in pairwise comparisons of S635FS iPSC-CMs expressing eGFP-WT vs eGFP-R634Q and eGFP-WT vs eGFP-NLS-R634Q. Three biological replicates were analyzed. e PSI values for differential splicing events in the core RBM20 targets between eGFP-WT and eGFP-R634Q cells (|delta PSI| > 0.1, P value < 0.05, two-tailored t-test). Three independent iPSC-CM differentiations were used as biological replicates. Ns = not significant, *P < 0.05, **P < 0.01, ***P < 0.001, ****P < 0.0001, one-way ANOVA with Bonferroni post test, two-sided. Actual P values are shown in the source data file.
Fig. 3
Fig. 3. Genome-wide ICS screen identifies TNPO3 as the main nuclear transporter of RBM20.
a Schematic outline of the ICS screen. Six genome-wide libraries were applied to HeLa cells expressing eGFP-RBM20-WT and Tet::Cas9, with 100 cells per gRNA coverage. Cells were sorted based on the correlation between RBM20 and DRAQ5 into 7% higher and 7% lower fractions at final coverage of 500 cells per gRNA per sorted bin. Unsorted input samples were collected too. b Reads were combined in silico to one dataset, and hits were called using MAUDE. Genes are ranked by their statistical significance. The horizontal dashed lines indicate an FDR of 1%. Positive/negative regulators with FDR < 1% are marked in red and blue, respectively. c Scatter plot of fold changes visualizing gRNA abundance changes in higher (x axis) and lower (y axis) sorted bins compared with the plasmid library. Red and blue dots indicate statistically significant positive and negative regulators, respectively (FDR < 5% according to MAUDE). Labeled are positive regulators selected for future analyses. d The impact of single knockouts of the selected hits (one gRNA per gene picked based on the strongest Z-score from the pooled screen) on RBM20 localization tested with ICS. The top row in the heatmap shows the log10(FDR) value for each candidate from the screen. The phenotype in the second row represents the standardized difference in RBM20 localization between the knockout (KO) and control cell populations (log2 of the ratio between cell fraction with Pearson coefficient (DRAQ5:RBM20) > 0.7 in the KO divided by cell fraction with Pearson coefficient (DRAQ5:RBM20) >0.7 in the control). e DAPI:RBM20 correlation quantified based on fluorescence microscopy analysis shown in Supplementary Fig. 5g, for the single KOs indicated. Each dot represents a Pearson correlation coefficient R for at least five cells, n = 3. Boxplots display quartiles Q1, Q2 (center), and Q3, with whiskers extending to the furthest data point within 1.5 times the IQR. Ns not significant, ***P < 0.001, one-way ANOVA with Tukey’s HSD post test (two-sided). Actual P values are shown in the source data file.
Fig. 4
Fig. 4. Mislocalization of RS-domain RBM20 mutants is caused by loss of interaction with TNPO3.
a ICS-measured DRAQ5:RBM20 correlation in WT or P633L iPSC-CMs transfected with control (Ctr) or TNPO3 siRNA. b DAPI:RBM20 correlation (based on Supplementary Fig. 7a). Each dot represents a Pearson coefficient for at least five cells, n = 3. c qPCR analysis of TTN exon 242 splicing-out in WT or P633L iPSC-CMs with Ctr or TNPO3 siRNA normalized to GAPDH (mean fold change versus the RBM20-WT with control siRNA, with standard errors, two biological replicates with two technical replicates each). d ICS-measured DRAQ5:RBM20 correlation for HeLa expressing eGFP-WT-, -P633L-, -R634Q-, or -RSS-RBM20, with Ctr or TNPO3 siRNA. e DAPI:RBM20 correlation (based on Supplementary Fig. 8a). Each dot represents a Pearson coefficient for at least five cells, n = 3. f Superimposed AlphaFold2 models of the RRM-RS domain of RBM20 (amino acid 511–673) as WT (gray), P633L (light blue), or R634Q (salmon). g Representative AlphaFold2 model of RBM20’s WT RRM-RS domain (blue, amino acid 511–673) in complex with TNPO3 (gray, full-length, amino acid 1-923). The PRSRSP stretch (amino acid 633–638) in RBM20 is highlighted as red spheres. h Predicted changes in binding affinity between TNPO3 and RBM20 upon RS-domain mutations. N = 20 AlphaFold models of the wild-type RBM20-TNPO3 complex were used to calculate the affinity change with a point mutation (see “Methods”). i Quantification of TNPO3 co-immunoprecipitating with RBM20 based on western blot analysis, representative image is displayed in (j) (n = 3, means with standard errors). j Western blot analysis of RBM20, TNPO3, and MOV10 in the cytoplasmic fraction of HeLa, and their co-immunoprecipitation with eGFP-RBM20 (Neg = negative no-bait control). k Quantification of TNPO3 peptides identified by mass spectrometry in the cytoplasmic fractions of co-immunoprecipitants with indicated cells, normalized to Neg, n = 3. Boxplots (b, e, h, k) display quartiles Q1, Q2 (center), and Q3, with whiskers extending to the furthest data point within 1.5 times the IQR. Ns = not significant, *P < 0.05, **P < 0.01, ***P < 0.001, ****P < 0.0001, Student’s t-test for (b), and one-way ANOVA with Tukey’s HSD post test for (c), (e), all two-tailored. Actual P values are shown in the source data file.
Fig. 5
Fig. 5. Enhancing RBM20-TNPO3 interaction restores nuclear localization and splicing in vitro and in vivo.
a Representative images of RBM20 localization upon overexpression (OE) of eGFP-TNPO3 in iPSC-CMs. Red arrows point at cells transduced with eGFP-TNPO3, n = 3. b DAPI:RBM20 colocalization based on the data shown in (a). Each dot represents a Pearson coefficient for at least five cells, n = 3. TNPO3 overexpression effect’s P value < 0.0001. c qPCR analysis of TTN exon 242 splicing (TNPO3 overexpression effect’s P value = 0.057); and d IMMT exon 6 splicing (TNPO3 overexpression effect’s P value = 0.015) in iPSC-CMs. Isoform expression was normalized to GAPDH and displayed as fold change versus the WT line (first replicate) without TNPO3 OE (means with standard errors, two biological replicates with two technical replicates for each). bd TNPO3’s overexpression effect’s P values were calculated with Two-way ANOVA with two-tailored Tukey’s HSD post test; comparison of WT vs P633L + TNPO3 - two-tailored t-test. e Scheme of Tnpo3 OE in vivo. f qPCR analysis of Tnpo3 expression in n = 4 WT mice, n = 4 P635L+/+ mice injected with PBS, or n = 4 P635L+/+ mice injected with Tnpo3. Data is normalized to Gapdh expression and displayed as fold change versus one of the WT mice with standard errors. g Representative images of RBM20 localization in WT mice, P635L+/+ mice injected with PBS, or P635L+/+ mice injected with Tnpo3. Red arrows point at characteristic nuclear foci formed by RBM20, n = 4 mice. h qPCR analysis of Ttn splicing in n = 4 WT mice, n = 4 P635L+/+ mice injected with PBS, or n = 4 P635L+/+ mice injected with Tnpo3. Data is normalized to Gapdh expression and displayed as fold change versus one of the WT mice with standard errors. i RT-PCR of Ttn splicing and Gapdh expression in n = 3 WT mice, n = 3 P635L+/+ mice injected with PBS, and n = 3 P635L+/+ mice injected with Tnpo3. Red arrows point at Ttn isoforms expressed in WT mice. Each boxplot of this figure (b, f, h) displays quartiles Q1, Q2 (center), and Q3, with whiskers extending to the furthest data point within 1.5 times the IQR. Actual P values are shown in the source data file.

References

    1. Hegde RS, Zavodszky E. Recognition and degradation of mislocalized proteins in health and disease. Cold Spring Harb. Perspect. Biol. 2019;11:a033902. doi: 10.1101/cshperspect.a033902. - DOI - PMC - PubMed
    1. Hung MC, Link W. Protein localization in disease and therapy. J. Cell Sci. 2011;124:3381–3392. doi: 10.1242/jcs.089110. - DOI - PubMed
    1. Fabbro M, Henderson BR. Regulation of tumor suppressors by nuclear-cytoplasmic shuttling. Exp. Cell Res. 2003;282:59–69. doi: 10.1016/S0014-4827(02)00019-8. - DOI - PubMed
    1. Barmada SJ, et al. Cytoplasmic mislocalization of TDP-43 is toxic to neurons and enhanced by a mutation associated with familial amyotrophic lateral sclerosis. J. Neurosci. 2010;30:639–649. doi: 10.1523/JNEUROSCI.4988-09.2010. - DOI - PMC - PubMed
    1. Schraivogel D, et al. High-speed fluorescence image-enabled cell sorting. Science. 2022;320:315–320. doi: 10.1126/science.abj3013. - DOI - PMC - PubMed

Publication types