. 2023 Jul 18;14(1):4294.
doi: 10.1038/s41467-023-39762-1.

Cancer-associated fibroblast classification in single-cell and spatial proteomics data

Affiliations

Cancer-associated fibroblast classification in single-cell and spatial proteomics data

Lena Cords et al. Nat Commun. .

Abstract

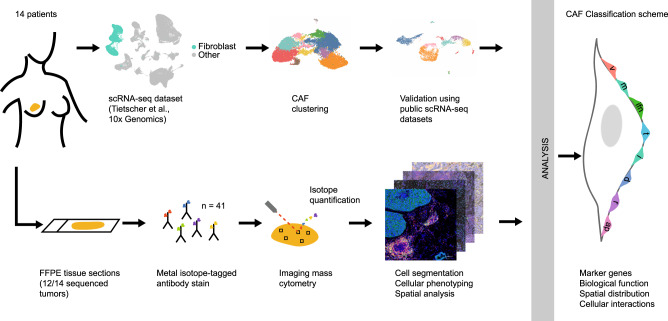
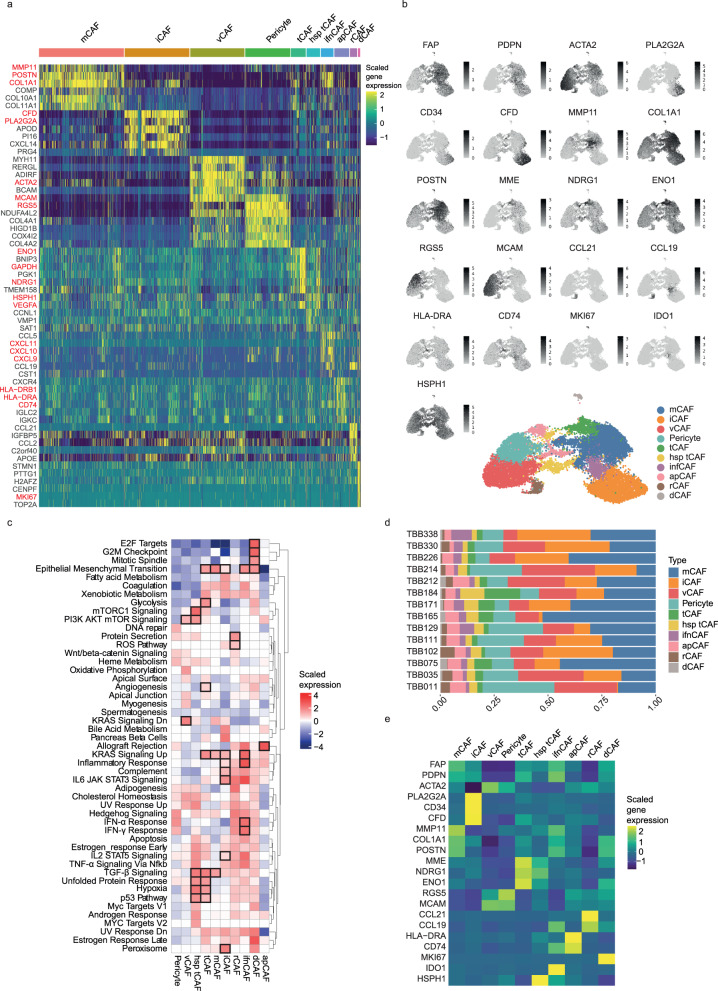
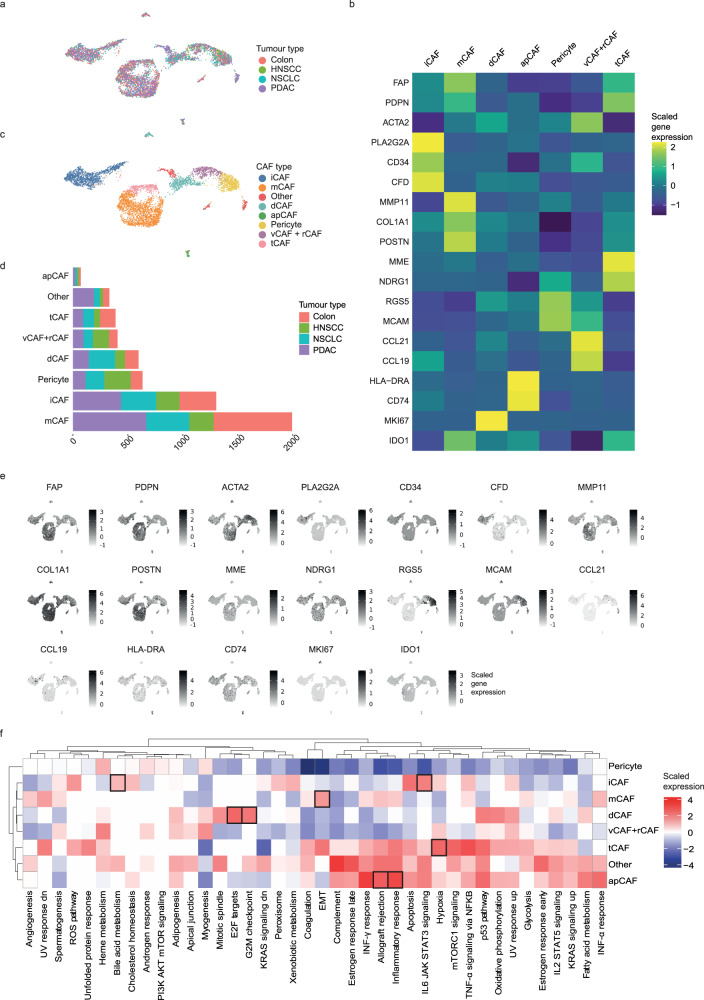
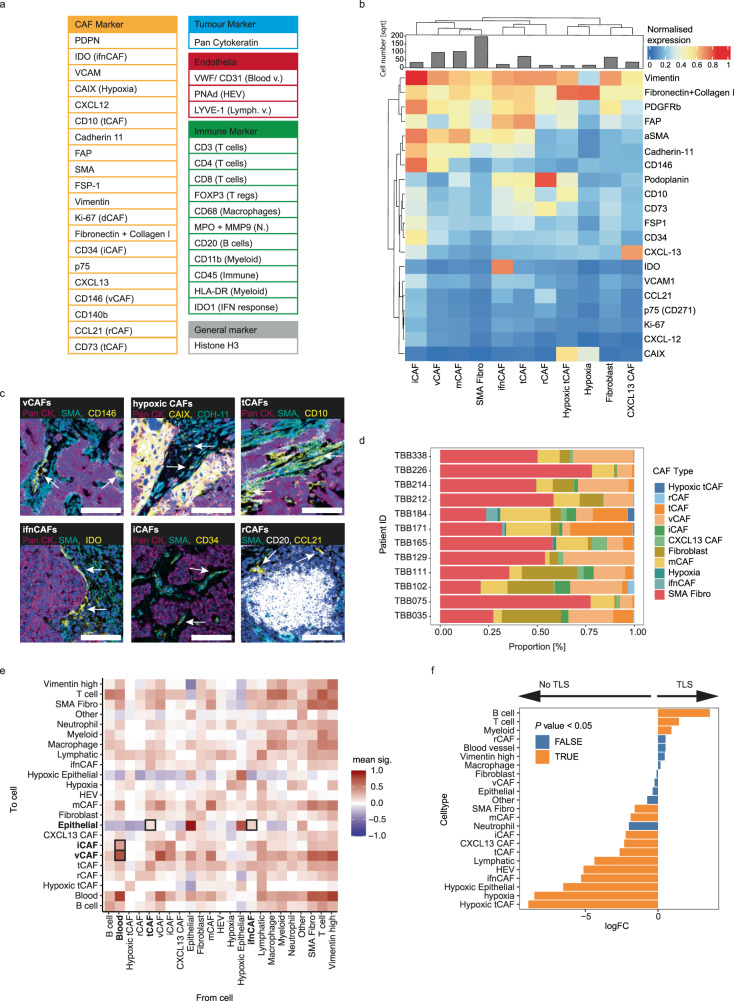
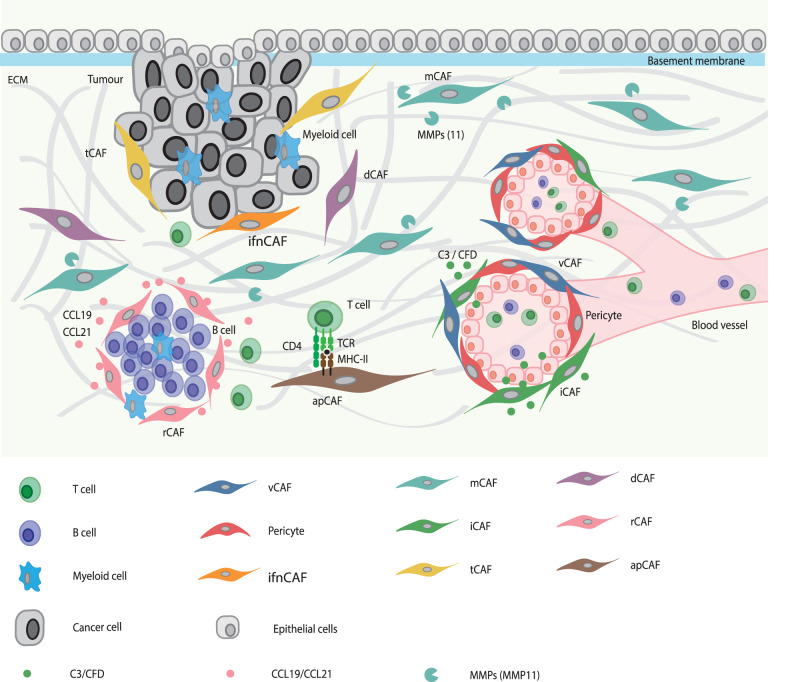
Cancer-associated fibroblasts (CAFs) are a diverse cell population within the tumour microenvironment, where they have critical effects on tumour evolution and patient prognosis. To define CAF phenotypes, we analyse a single-cell RNA sequencing (scRNA-seq) dataset of over 16,000 stromal cells from tumours of 14 breast cancer patients, based on which we define and functionally annotate nine CAF phenotypes and one class of pericytes. We validate this classification system in four additional cancer types and use highly multiplexed imaging mass cytometry on matched breast cancer samples to confirm our defined CAF phenotypes at the protein level and to analyse their spatial distribution within tumours. This general CAF classification scheme will allow comparison of CAF phenotypes across studies, facilitate analysis of their functional roles, and potentially guide development of new treatment strategies in the future.


Conflict of interest statement

B.B. is a co-founder of Navignostics and a member of its board. The remaining authors declare no competing interests.

Figures

Fig. 1
Fig. 1. Workflow used to define the CAF classification system.
scRNA-seq data from matched breast cancer samples were analysed for fibroblast heterogeneity with subsequent validation of identified fibroblast subtypes in other tumour types. IMC using formalin-fixed paraffin-embedded tissue sections (FFPE) was used to validate findings at the protein level and to evaluate spatial distribution. The resulting CAF classification system (featuring vascular CAFs (vCAFs), matrix CAFs (mCAFs), interferon-response CAFs (ifnCAFs), tumour-like CAFs (tCAFs), inflammatory CAFs (iCAFs), dividing CAFs (dCAFs), reticular-like CAFs (rCAFs) and antigen-presenting CAFs (apCAFs)) was based on marker genes, biological functions, spatial distribution within the TME, and cellular interactions.
Fig. 2
Fig. 2. Fibroblast heterogeneity in breast cancer.
a Heatmap of the top six differentially expressed genes for each cell type in scRNA-seq data of all stromal cells (n = 16,704). Cellular phenotypes are indicated above the heatmap. Key marker genes are highlighted in red. b UMAP of all stromal cells coloured by CAF type, together with the corresponding feature plots showing the expression level of selected marker genes for each cell. c Gene set enrichment analysis comparing the enrichment of hallmark pathways between CAF types. Boxes indicate the functional hallmark pathways that we used to define/annotate CAF types (see also Supplementary Data 7). d Proportion of all CAF types and pericytes per patient. e Heatmap showing the average gene expression level of all defined marker genes per identified cell type (after batch correction).
Fig. 3
Fig. 3. Fibroblast heterogeneity in multiple cancer types.
a UMAP showing the validation datasets (non-small cell lung cancer (NSCLC), head-and-neck squamous cell carcinoma (HNSCC), colorectal cancer, pancreatic ductal carcinoma (PDAC)). b Heatmap showing the average marker gene expression of each identified cell type in the integrated validation dataset. c UMAP showing the final CAF classification of the validation cohort. d Bar chart showing the absolute numbers of all CAF types and pericytes as detected with unbiased clustering of the validation dataset and the respective proportions of each cell type per tumour type. e Feature plot showing the cellular expression levels of selected marker genes on the UMAP. f Heatmap showing the results of gene set enrichment analysis for all defined cell types. Boxes indicate the overlap of the top five enriched hallmark pathways between the integrated validation and breast cancer dataset.
Fig. 4
Fig. 4. Spatial analysis of CAF types in breast tumours using imaging mass cytometry.
a Panel of all markers used in the IMC study (Blood/Lymph v. =  blood/lymph vessel, N.  =  neutrophil, HEV =  high-endothelial venules). b Heatmap of marker expression of CAF clusters defined by IMC in breast tumour samples. The histogram indicates the square root of all cell numbers per cluster in each CAF type. c Zoomed-in images acquired with IMC showing the expression of key markers used in our classification system on the image level. The indicated CAF type is highlighted by arrows. CAFs are identified as follows: vCAFs, CD146; hypoxic CAFs: CDH-11, CAIX; tCAFs, SMA, CD10; ifnCAFs: IDO, SMA; iCAFs: aSMA, CD34; rCAFs: CCL21. PanCK indicates tumour cells, CD20 indicates B cells, Iridium (blue) indicates nuclei in all images. Scalebar, 100 µm. d Proportion of all CAF types defined by IMC over all patients. e Neighbourhood analysis showing cell-to-cell interactions at the image level, over all images in the study. The cell-to-cell interactions are compared against a random null distribution using permutation testing. An interaction score is then generated for each cell pair based on the P values calculated on the image level (two-sided permutation test). Positive interaction scores mean that a given pair of cells is neighbouring significantly more often than compared to the null distribution. f Differential abundance analysis comparing cellular enrichment in TLS containing images versus images not containing any TLS-like structures.
Fig. 5
Fig. 5. CAF classification scheme.
Graphical summary showing the spatial distribution patterns of the seven CAF types (excluding apCAFs) in the TME as detected with imaging mass cytometry and their interaction with other cell types.

References

    1. Quail DF, Joyce JA. Microenvironmental regulation of tumor progression and metastasis. Nat. Med. 2013;19:1423–1437. doi: 10.1038/nm.3394. - DOI - PMC - PubMed
    1. Schreiber, R. D., Old, L. J. & Smyth, M. J. Cancer immunoediting: integrating immunity’s roles in cancer suppression and promotion. Science10.1126/science.1203486 (2011). - PubMed
    1. Turley, S. J., Cremasco, V. & Astarita, J. L. Immunological hallmarks of stromal cells in the tumour microenvironment. Nat. Rev. Immunol.15, 669–682 (2015). - PubMed
    1. Kalluri, R. The biology and function of fibroblasts in cancer. Nat. Rev. Cancer16, 582–598 (2016). - PubMed
    1. Karnoub AE, et al. Mesenchymal stem cells within tumour stroma promote breast cancer metastasis. Nature. 2007;449:557–563. doi: 10.1038/nature06188. - DOI - PubMed

Publication types