. 2023 Jul 19;8(1):275.
doi: 10.1038/s41392-023-01487-4.

Cancer cell employs a microenvironmental neural signal trans-activating nucleus-mitochondria coordination to acquire stemness

Affiliations

Cancer cell employs a microenvironmental neural signal trans-activating nucleus-mitochondria coordination to acquire stemness

Bin He et al. Signal Transduct Target Ther. .

Erratum in

Abstract

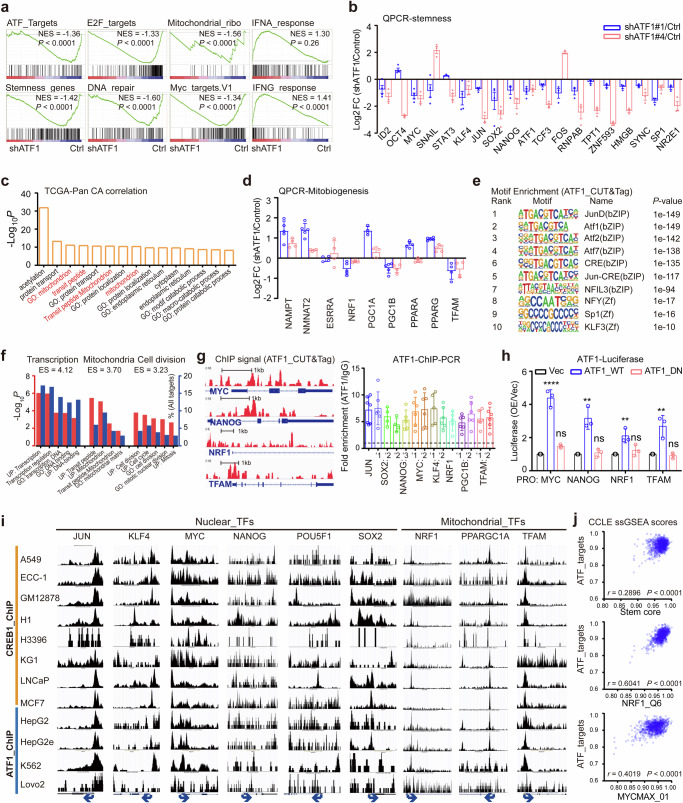
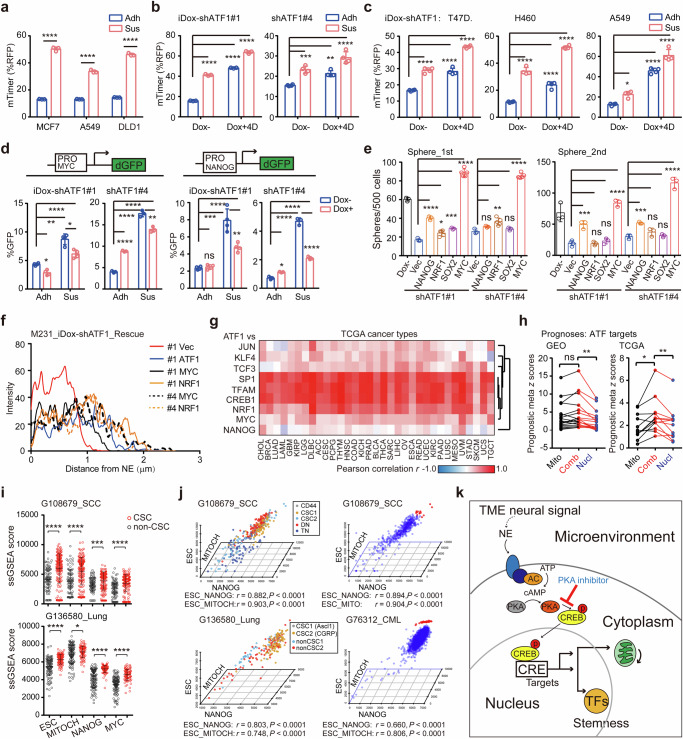
Cancer cell receives extracellular signal inputs to obtain a stem-like status, yet how tumor microenvironmental (TME) neural signals steer cancer stemness to establish the hierarchical tumor architectures remains elusive. Here, a pan-cancer transcriptomic screening for 10852 samples of 33 TCGA cancer types reveals that cAMP-responsive element (CRE) transcription factors are convergent activators for cancer stemness. Deconvolution of transcriptomic profiles, specification of neural markers and illustration of norepinephrine dynamics uncover a bond between TME neural signals and cancer-cell CRE activity. Specifically, neural signal norepinephrine potentiates the stemness of proximal cancer cells by activating cAMP-CRE axis, where ATF1 serves as a conserved hub. Upon activation by norepinephrine, ATF1 potentiates cancer stemness by coordinated trans-activation of both nuclear pluripotency factors MYC/NANOG and mitochondrial biogenesis regulators NRF1/TFAM, thereby orchestrating nuclear reprograming and mitochondrial rejuvenating. Accordingly, single-cell transcriptomes confirm the coordinated activation of nuclear pluripotency with mitochondrial biogenesis in cancer stem-like cells. These findings elucidate that cancer cell acquires stemness via a norepinephrine-ATF1 driven nucleus-mitochondria collaborated program, suggesting a spatialized stemness acquisition by hijacking microenvironmental neural signals.


Conflict of interest statement

The authors declare no competing interests.

Figures

Fig. 1
Fig. 1
CRE is a pan-cancer TME responsive stemness effector. a A scheme to screen TME responsive transcriptional regulators of CSCs. Gene set enrichment analysis (GSEA) in paired sphere-adherent cells identifies CSC-enriched transcription factors. Transcription factor motif analysis of genes enriched in StemnessScorehigh tumors identified TME responsive stemness factors in vivo. The STRING (http://string-db.org/) interaction network of 31 TME responsive stemness transcription factors overlapped in GSEA/TCGA datasets was present in the right panel. CRE associated factors were labeled in red in the network. b Normalized enrichment scores (NES) for top transcription factors enriched in 17 paired sphere-adherent from 15 independent datasets. NES was determined by GSEA. CRE, cAMP responsive element. c Sphere formation of sorted cells (MDA-MB-231, MCF-7, DLD1 and T47D) according to the CRE-responsive GFP reporter (CRE-dGFP) activity (n = 3; mean ± SD; P values, Tukey’s multiple comparisons after 1-way ANOVA). d In vitro limit dilution assay of sorted CRE-dGFP+ and CRE-dGFP- populations in MDA-MB-231 and T47D cells. Differences in stem cell frequencies were determined by ELDA (https://bioinf.wehi.edu.au/software/elda/). n = 6 for each group. e Primary (left panel) and secondary (right panel) sphere formation of MDA-MB-231 cells in indicated doses of cAMP mimics in sphere media (Butyl-cAMP and 8-Br-cAMP, n = 3; mean ± SD; P values, Tukey’s multiple comparisons after 1-way ANOVA). f Western blot analysis of MDA-MB-231 (upper panel) and DLD1 cells treated with PKA inhibitor H89 for 1 hr. Cell extracts were analyzed with antibodies against phospho-CREB1/ATF1, total ATF1/CREB1 and alpha-tubulin. g Representative images of sphere formation in MDA-MB-231 (left panel) and DLD1 (right panel) cells treated with H89 in sphere media. Scale bar represents 60 μm. h Primary and secondary sphere formation of MDA-MB-231 (left panel) and DLD1 (right panel) cells treated with H89 in sphere media (n = 3; mean ± SD; P values, Tukey’s multiple comparisons after 1-way ANOVA). i The prognostic meta-z sores of ATF1/CREB1 target genes (collected form MSigDB, Supplementary Table S2) among cancer types. Meta-z scores were calculated by unweighted prognostic z scores of individual genes of the signature. j Representative IHC staining of phospho-CREB1/ATF1 in breast cancer specimens. Numbers indicate phospho-CREB1/ATF1 expression scores. Scale bar represents 50 μm. k Kaplan Meier curves of estimated overall survival (OS, left panel) and disease-free survival (DFS, right panel) of breast cancer patients with low (n = 238) and high (n = 128) phospho-CREB1/ATF1 levels (P values, log-rank test). *P < 0.05; **P < 0.01; ***P < 0.001; ****P < 0.0001; ns not significant
Fig. 2
Fig. 2
Proximal neural signals activate CRE-dependent stemness. a Heatmap showing the expressions of neural specific genes in TCGA tumors. Sidebar, tumors types. b Left panel, single sample GSEA (ssGSEA) based deconvolution of tissue associated nerves based on the gene expression profiles from the bulk RNA-seq data by neural specific marker gene set based analysis in individual tumors. Right panel, The neural signals in TCGA tumors according to the ssGSEA enrichment scores. c Correlation of CRE activity with neural signals in the pan-cancer (TCGA, upper panel) and METABRIC (breast cancer, lower panel) tumors. Correlations (Pearson r) between CRE and specific neural signals were determined according to their ssGSEA scores in individual tumors (P values, Pearson correlation). d Immunofluorescent analysis of phospho-CREB1/ATF1 intensity (green), neural markers (NF-L, TH and SYP, red) in mouse MMTV-PyMT (upper panel) and human (lower panel) breast tumors. Scale bar, 20 μm. e Nuclear phospho-CREB1/ATF1 intensity indicated by the percentages of phospho-ATF1/CREB1 positive nuclei per field (0.01 mm2 within neural marker positive area, n = 10) in mouse (upper panel) and human (lower panel) breast tumors, respectively. Neural signal negative area (n = 10) was used as controls (mean ± SD; 2-sided t test). f In vivo limit dilution assay of MDA-MB-231 cells in control or chronic stressed NSG mice. Differences in stem cell frequencies were determined by ELDA (https://bioinf.wehi.edu.au/software/elda/). n = 8 and 15 for control and stress groups, respectively. g Representative immunofluorescent staining of phospho-CREB1/ATF1 in Py8119 xenografts from control (Ctrl) and stressed (stress) mice (left panel). Quantification of nuclear phospho-CREB1/ATF1 intensity (median fluorescent intensity, MFI) in immunofluorescent Py8119 xenografts (right panel, n = 1295 and 1476 for control and stressed groups; mean ± SD; 2-sided t test). Scale bar, 20 μm. h Western blot analysis of MDA-MB-231 (upper panel) and T47D (lower panel) cells treated with epinephrine (EP) and norepinephrine (NE) for 30 min. Cell extracts were analyzed with phospho-CREB1/ATF1, total ATF1/CREB1 and Alpha-tubulin antibodies. i Left panel, flow cytometry analysis of CRE-dGFP reporter activity of MDA-MB-231 cells in response to 24 hr NE/EP treatment. Parental MDA-MB-231 cells without reporter transfection (Neg) were used as control. Right panel, percentage of CRE-dGFP+ cells in MDA-MB-231 in response to NE/EP treatment (24 hr). j Secondary sphere formation of MDA-MB-231 cells in the presence of NE/EP. Representative images of spheres were present. Scale bar, 60 μm. (for 2i–j, n = 4; mean ± SD; P values, Tukey’s multiple comparisons after 1-way ANOVA). k Schematic illustration of the experimental design for the time-lapse imaging of norepinephrine activity in the tumor microenvironment using fluorescent norepinephrine reporter (GRABNE2h). l Left panel, representative images of GRABNE2h (green) and tdTomato (red) activity in the MDA-MB-231 xenograft before (0 min) and after (1-4 min) i.p. injection of the norepinephrine transporter (NET) blocker desipramine (10 mg/kg). Scale bar, 60 μm. Right panel, median fluorescent intensity of GRABNE2h fluorescence (upper) and tdTomato (lower) in the MDA-MB-231 xenograft following treatment with the desipramine (10 mg/kg). n = 75 cells from 3 mice for each condition. m Model of TME NE dependent cAMP responsive program that acts as a conserved mechanism driving cancer stemness. *P < 0.05; **P < 0.01; ***P < 0.001; ****P < 0.0001; ns not significant
Fig. 3
Fig. 3
ATF1 dictates TME neural signals to potentiate cancer stemness. a A scheme illustrating the doxycycline (Dox) inducible shRNA (iDox-shRNA) library based functional screen to identify candidate CRE transcription factors for cancer stemness in three independent cancer cell lines (MDA-MB-231, H460 and DLD1). Top shRNA hits were labeled with distinct dots (blue, orange, black and red for oligos targeting JUN, CREB1, SP1 and ATF1, respectively). b Primary (left panel) and secondary (right panel) sphere formation of MDA-MB-231 cells expressing iDox-shRNAs against ATF1, CREB1, JUN and SP1. Cells were pretreated with Dox for 3 days prior to sphere formation assays (n = 3; mean ± SD; P values, Tukey’s multiple comparisons after 1-way ANOVA). c In vitro limit dilution assay of iDox-shATF#1/#4 and iDox-shCREB1 cells of MDA-MB-231. Differences in stem cell frequencies were determined by ELDA (https://bioinf.wehi.edu.au/software/elda/). n = 6 for each group. d Sphere formation of MDA-MB-231 iDox-shATF1 (shRNA#1 and #4) cells treated with Dox in combination with DMSO or cAMP mimics for 3 days prior to sphere formation assays (n = 3; mean ± SD; P values, Tukey’s multiple comparisons after 1-way ANOVA). e Western blot analysis of iDox-shATF1 MDA-MB-231 cells with/without Dox treatment with indicated antibodies. Cells were treated with epinephrine (EP, 0.5 μM) and norepinephrine (NE, 0.5 μM) for 30 min before harvesting. f Secondary sphere formation of iDox-shATF1 MDA-MB-231 cells. Cells with/without Dox were treated with NE/EP (0.5 μM) in sphere formation assays. g Flow cytometry analysis for ALDEFLUOR activity among iDox-shATF1 MDA-MB-231 cells (shRNA#1 and #4, left panel). Differences of ALDEFLUOR+ cells among groups were determined by one-way ANOVA (right panel). h Western blot analysis of MCF-7 cells expressing vector (Vec) or different forms of ATF1 (wild type (WT), S63A (MU) and R231L (DN), upper panel). Sphere formation of MCF-7 cells expressing different forms of ATF1 (lower panel). i Western blot analysis of iDox-shATF1#1 MDA-MB-231 cells expressing vector (Vec) or different forms of ATF1(wild type (WT), S63A (MU) and R231L (DN)). Sphere formation of iDox-shATF1#1 MDA-MB-231 cells rescued with vectors or ectopic ATF1 (lower panel). For fi, n = 3; mean ± SD; P values, Tukey’s multiple comparisons after 1-way ANOVA. j In vivo limit dilution assay of iDox-shATF1 (shRNA#1 and #4) or iDox-shATF1 rescued (#1_WTR) MDA-MB-231 cells. Differences in stem cell frequencies were determined by ELDA (n = 10 for each group). k Sphere formation of MDA-MB-231 derived xenografts from j. Scale bars, 60 μm. l Left panel, immunofluorescence of E-cadherin (E-cad), Vimentin (Vim), Ki67 and DAPI in primary human breast cancer cells maintained in Matrigel. Right panel, Western blot analysis of primary breast cancer cells expressing shNC (control) or shATF1#1 vectors (pLKO.1_GFP_shRNA). Sphere formation of primary breast cancer cells from four cases (Case #1-#4) expressing shATF1 or shNC (nontarget control, (for kl, n = 3; mean ± SD; P values, Tukey’s multiple comparisons after 1-way ANOVA). *P < 0.05; **P < 0.01; ***P < 0.001; ****P < 0.0001; ns not significant
Fig. 4
Fig. 4
ATF1 trans-activates core pluripotent and mitochondrial factors. a Representative GSEA enrichment plots for gene sets enriched in control and shATF1 (shATF1#1 and shATF1#4) groups. b QRT-PCR (QPCR) analysis of stemness genes in iDox-shATF1 MDA-MB-231 cells. Fold changes (presented as Log2) in gene expression were compared to cells without Dox treatment (n = 3; mean ± SD). c Top biological processes enriched in ATF1 co-expressed genes based on the TCGA pan-cancer datasets. P values were EASE scores (modified Fisher Exact P value) provided in the DAVID database. d QPCR analysis of mitochondrial biogenesis genes in iDox-shATF1 MDA-MB-231 cells. Fold changes (presented as Log2) in gene expression were compared to cells without Dox treatment (n = 3; mean ± SD). e Top motifs enriched in ATF1 binding DNA element in MDA-MB-231 cells determined by de novo motif analysis of ATF1-CutTag peaks. f Biological processes enriched in ATF1 target genes, as determined by genes with transcription start sites 2k bp from in ATF1 binding peaks. g Left panel, representative tracks of normalized ATF1 CUT&TAG-seq signals at MYC, NAONG, NRF1 and TFAM loci. Right panel, PCR quantification of ATF1 ChIP products in the regulatory regions of stemness and mitochondrial regulators. ATF1 ChIP signal was normalized over control IgG (n = 3; mean ± SD). h Luciferase reporter assay for ATF1 mediated gene transactivation. 293 T cells were co-transfected with a promoter-Firefly-luciferase reporter construct (MYC, NANOG, NRF1 and TFAM) in combination with empty vector, wild-type or mutant ATF1. Results were expressed as ratio of Firefly/ Renilla and normalized to vector construct (n = 4; mean ± SD; (n = 3; mean ± SD; P values, Tukey’s multiple comparisons after 1-way ANOVA). i The ENCODE ChIP-seq datasets (https://www.genome.ucsc.edu/index.html) showing ATF1 and CREB1 peaks in the regions of nuclear and mitochondrial regulators according to the data from the UCSC Genome Browser. Red boxes represent region near the transcription start site. Blue arrows represent transcription orientation. j Pearson correlations among ATF1, MYC, NRF1 and stemness ssGSEA scores based on the transcription profiles of the CCLE cancer cell lines (P values, Pearson correlation). *P < 0.05; **P < 0.01; ***P < 0.001; ****P < 0.0001; ns not significant
Fig. 5
Fig. 5
ATF1 depletion impairs mitochondrial rejuvenation. a Representative images of the mitochondria in iDox-shATF1 MDA-MB-231 (Dox −/+) and iDox-shATF1-ATF1 rescued cells under the electron microscope. Bar graphs show the results from the morphometric analysis of cristae number or cristae length/mitochondrial area in cells (n = 20 mitochondria/group; mean ± SD). Scale bar, 0.2 μm. b Mitochondrial ROS as indicated by flow cytometry analysis of MitoSOX Red. Parental and iDox-shATF1#1/#4 MDA-MB-231 cells were treated with Dox for 3 days or 6 days (n = 3; mean ± SD). c Mitochondrial turnover determined by flow cytometry analysis of cells 48 hr after transiently transfected with mitoTimer (left panel. n = 3; mean ± SD). d Mitochondrial turnover as determined by flow cytometry analysis of cells 48 hr after transiently transfected with mitoTimer in iDox-shATF1 H460, A549 and T47D cells (n = 3; mean ± SD). e Percentages of cells with damaged mitochondria as indicated by MitoTracker Deep-Redlow Greenhigh cells (n = 3; mean ± SD). For ae, P values, Tukey’s multiple comparisons after 1-way ANOVA. f Representative plots showing mitochondrial damage as determined by flow cytometry analysis of MitoTracker Deep-Red and MitoTracker Green. The iDox-shATF1#1/#4 MDA-MB-231 cells were treated with Dox for 4 days, challenged with CCCP for 6 h before MitoTracker staining. g Percentages of cells with damaged mitochondria as indicated by MitoTracker Deep-Redlow Greenhigh cells treated with CCCP in combination with dynein inhibitor (DynI). n = 3; mean ± SD; P values, Tukey’s multiple comparisons after 1-way ANOVA. h Immunofluorescence of Tom20 and alpha tubulin in iDox-shATF1#1 MDA-MB-231 cells treated with Dox for 4 days. Scale bars, 20 μm. i Left panel, mitochondria localization determined by confocal microscopy using MitoTracker Red staining. Right panel, MitoTracker Red intensity (mean ± SD) as a function of distance to nuclei was analyzed (n = 28 for CT group, n = 52 for Dox group and n = 20 for wild-type rescued group, respectively). Scale bar, 20 μm. j Sphere formation of iDox-shATF1 MDA-MB-231 cells with/without Dox treatment, cells were rescued with MitoTempo (MitoT, 10, 20, 30 μM), and collected for sphere forming assays. k Sphere formation of iDox-shATF1 MDA-MB-231 cells with/without Dox treatment, cells were rescued with MitoQ (0.05 μM), and analyzed for sphere forming capacity (for jk, n = 3; mean ± SD; P values, Tukey’s multiple comparisons after 1-way ANOVA). *P < 0.05; **P < 0.01; ***P < 0.001; ****P < 0.0001; ns not significant
Fig. 6
Fig. 6
ATF1 coordinated nucleus-mitochondria state underlies cancer stemness. Mitochondrial turnover as determined by mitoTimer in MCF7, A549 and DLD1 (a), iDox-shATF1 MDA-MB-231 (b), iDox-shATF1 H460, A549 and T47D (c) cells. Cells in each group were transiently transfected with mitoTimer for 24 hr, seeded in adherent (Adh) or suspension (Sus) culture for 1 day and collected for flow cytometry. d NAONG- or MYC-Promoter activities indicated by promoter-dGFP reporter cell lines. Cells were treated with Dox for 3 days, seeded in adherent (Adh) or suspension (Sus) culture for one day followed by flow cytometry. Reporter negative cells were loaded as control. e Serial sphere formation of iDox-shATF1 MDA-MB-231 cells rescued with Dox inducible expression of NRF1, NANOG, SOX2 and MYC, respectively. For ae, n = 3; mean ± SD; P values, Tukey’s multiple comparisons after 1-way ANOVA. f Mitochondria localization determined by MitoTracker Red. The iDox-shATF1#1 MDA-MB-231 cells rescued with NRF1, MYC and ATF1 were stained with MitoTracker for 30 min. MitoTracker Red intensity (mean) as a function of distance to nuclei was analyzed (n = 20 for each group). g Correlation of ATF1 expression with stemness/mitochondria genes in the 33 cancer types from the TCGA dataset. Correlations (Pearson r) between ATF1 and individual gene was determined according to their mRNA in tumors. h The prognostic meta-z sores of ATF1/CREB1 target genes (listed in Supplementary Table S2, classified as mitochondrial, nuclear pluripotent and combined targets, respectively) among GEO (n = 18) and TCGA (n = 12) cancer types. Meta-z scores were calculated by unweighted prognostic z scores of individual genes of the signature (P values, 2-sided t test for paired samples). i The ssGSEA scores of stemness (ESC), nuclear transcription factor (NANOG, MYC) and mitochondrial gene sets in CSCs and non-CSCs based on the single-cell transcriptome. Lung cancer (GSE136580) and skin squamous cell carcinoma (SCC) cells (GSE108679) were grouped by CSC markers (NE in GSE136580 and CD44/CD34/ITGA6 in GSE108679). P values, 2-sided t test. j The ssGSEA scores of stemness (ESC), nuclear transcription factor (NANOG) and mitochondrial gene sets in single cancer cells. Lung cancer (GSE136580) and SCC cells (GSE108679) were grouped by CSC markers. DN, double negative, TN, triple negative. Populations of chronic myeloid leukemia (CML, GSE76312) and SCC cells with high ESC, NANOG and mitochondrial scores were labeled in red. k Model of cAMP responsive program in rejuvenating mitochondria and reprogramming nucleus to potentiate stemness in cancer cells. A TME neural signal responsive nucleus-mitochondria program serves as a convergent mechanism underlying cancer stemness. *P < 0.05; **P < 0.01; ***P < 0.001; ****P < 0.0001; ns not significant

References

    1. Kreso, A. & Dick, J. E. Evolution of the cancer stem cell model. Cell Stem Cell14, 275–291 (2014). - PubMed
    1. Gupta, P. B., Pastushenko, I., Skibinski, A., Blanpain, C. & Kuperwasser, C. Phenotypic plasticity: driver of cancer initiation, progression, and therapy resistance. Cell Stem Cell24, 65–78 (2019). - PMC - PubMed
    1. Ben-Porath, I. et al. An embryonic stem cell-like gene expression signature in poorly differentiated aggressive human tumors. Nat. Genet40, 499–507 (2008). - PMC - PubMed
    1. Cho, M. H. et al. DOT1L cooperates with the c-Myc-p300 complex to epigenetically derepress CDH1 transcription factors in breast cancer progression. Nat. Commun.6, 7821 (2015). - PMC - PubMed
    1. Sancho, P. et al. MYC/PGC-1alpha balance determines the metabolic phenotype and plasticity of pancreatic cancer stem cells. Cell Metab.22, 590–605 (2015). - PubMed

Publication types

MeSH terms