. 2023 Jul 18;8(1):17.
doi: 10.1038/s41525-023-00363-y.

Chromatin regulators in the TBX1 network confer risk for conotruncal heart defects in 22q11.2DS

Collaborators, Affiliations

Chromatin regulators in the TBX1 network confer risk for conotruncal heart defects in 22q11.2DS

Yingjie Zhao et al. NPJ Genom Med. .

Abstract

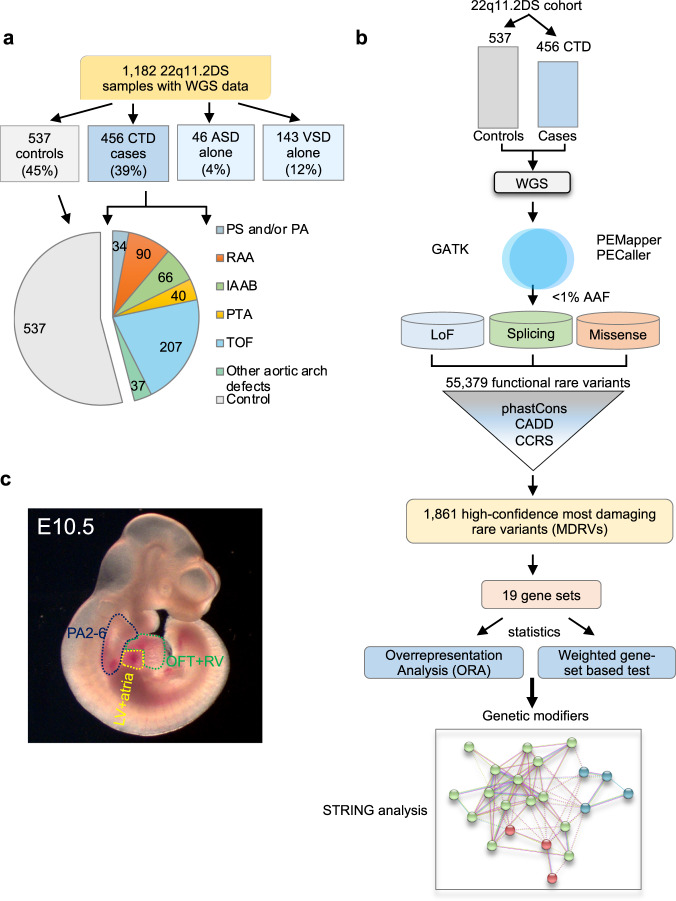
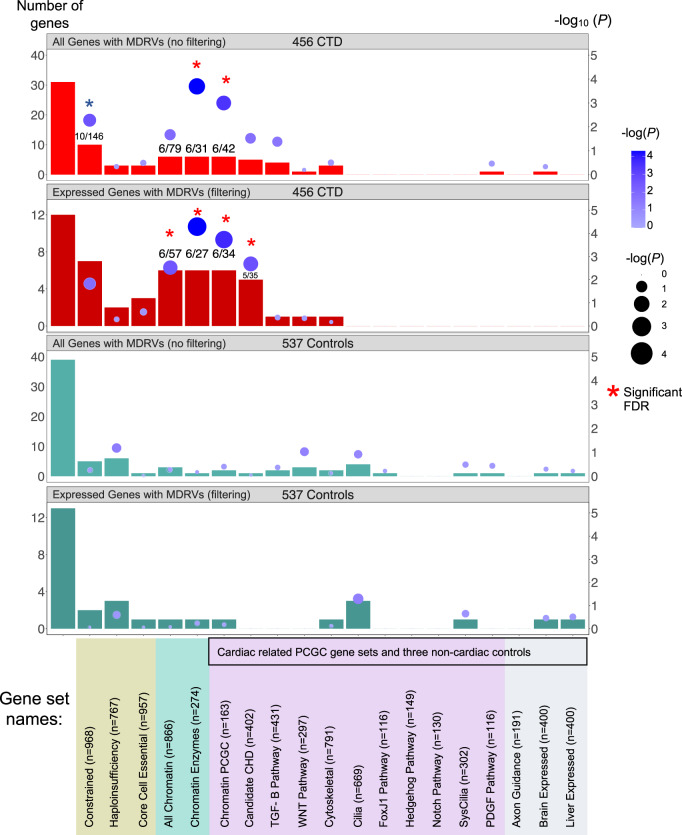
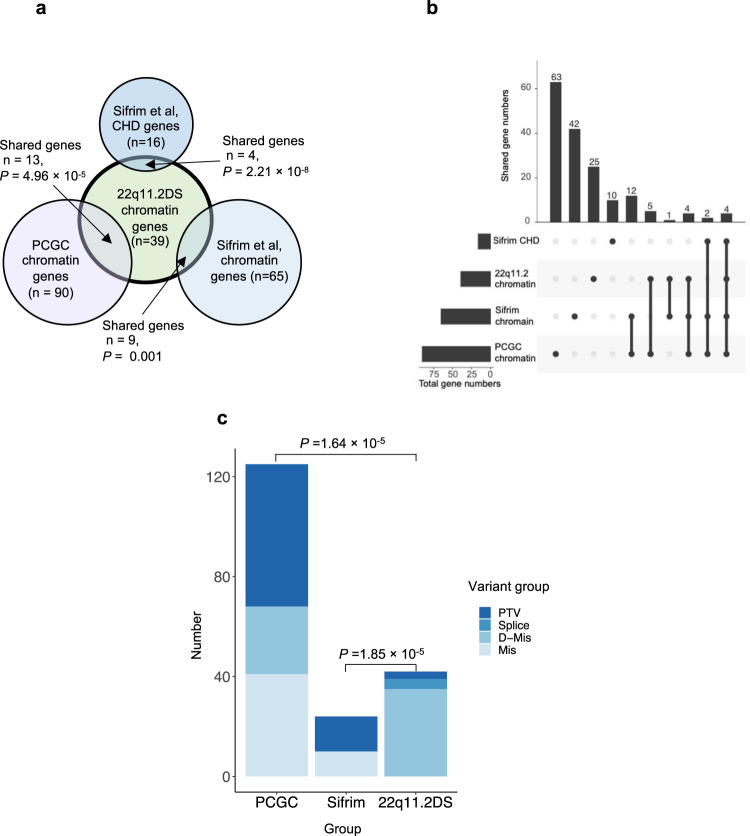
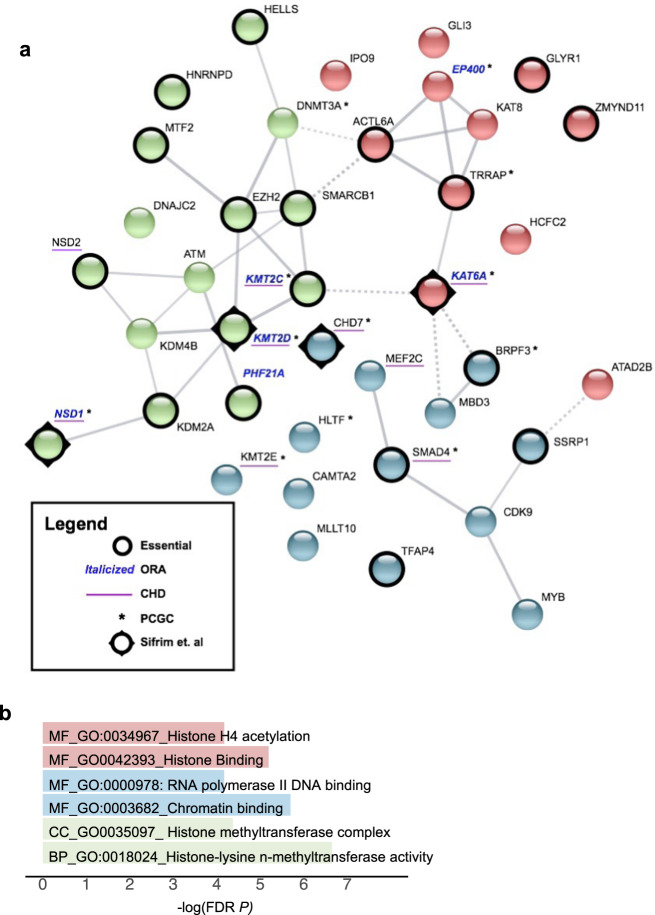
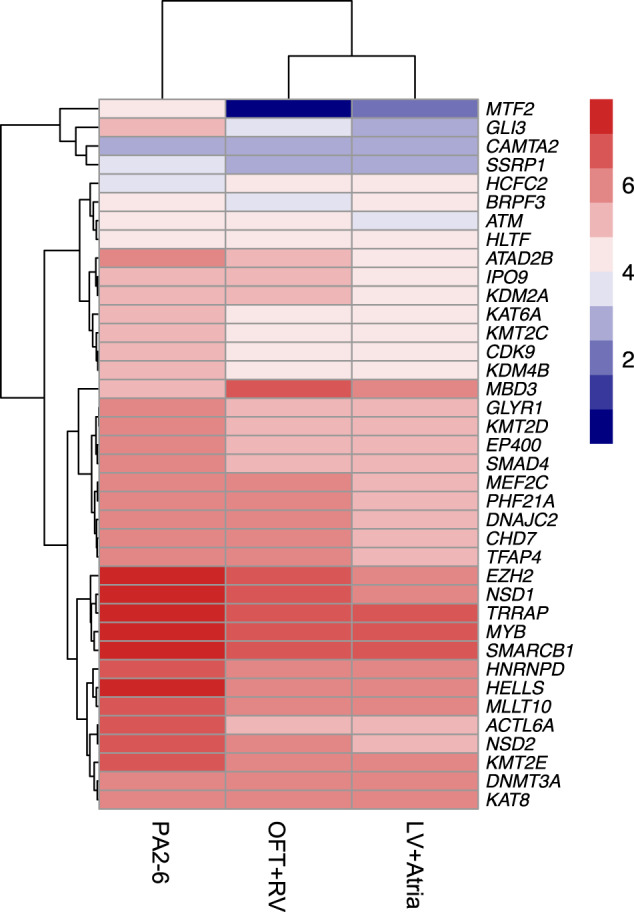
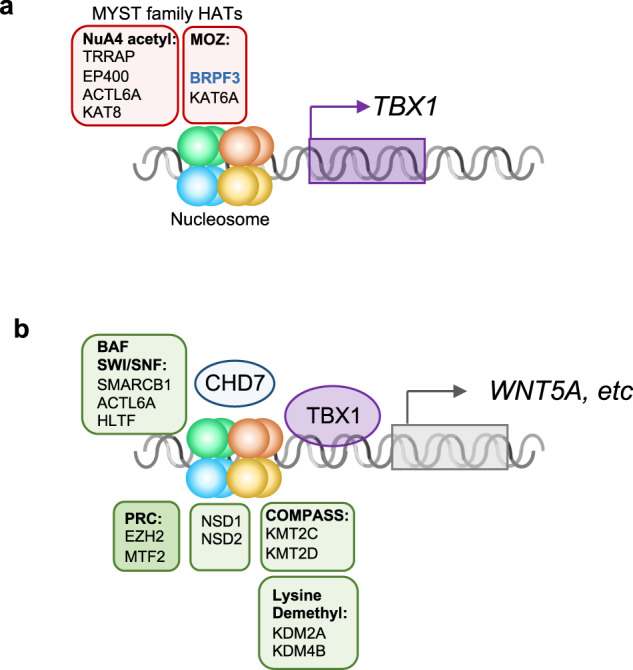
Congenital heart disease (CHD) affecting the conotruncal region of the heart, occurs in 40-50% of patients with 22q11.2 deletion syndrome (22q11.2DS). This syndrome is a rare disorder with relative genetic homogeneity that can facilitate identification of genetic modifiers. Haploinsufficiency of TBX1, encoding a T-box transcription factor, is one of the main genes responsible for the etiology of the syndrome. We suggest that genetic modifiers of conotruncal defects in patients with 22q11.2DS may be in the TBX1 gene network. To identify genetic modifiers, we analyzed rare, predicted damaging variants in whole genome sequence of 456 cases with conotruncal defects and 537 controls, with 22q11.2DS. We then performed gene set approaches and identified chromatin regulatory genes as modifiers. Chromatin genes with recurrent damaging variants include EP400, KAT6A, KMT2C, KMT2D, NSD1, CHD7 and PHF21A. In total, we identified 37 chromatin regulatory genes, that may increase risk for conotruncal heart defects in 8.5% of 22q11.2DS cases. Many of these genes were identified as risk factors for sporadic CHD in the general population. These genes are co-expressed in cardiac progenitor cells with TBX1, suggesting that they may be in the same genetic network. The genes KAT6A, KMT2C, CHD7 and EZH2, have been previously shown to genetically interact with TBX1 in mouse models. Our findings indicate that disturbance of chromatin regulatory genes impact the TBX1 gene network serving as genetic modifiers of 22q11.2DS and sporadic CHD, suggesting that there are some shared mechanisms involving the TBX1 gene network in the etiology of CHD.


Conflict of interest statement

The authors declare no competing financial interests. There are competing non-financial interests for JASV and MJO. JASV has served as a consultant for NoBias Therapeutics, Inc for the design of a medication trial for individuals with 22q11DS (unrelated to the content of this work). MJO reports a research grant from Takeda Pharmaceuticals outside the scope of the current work. The remaining authors declare no competing interests.

Figures

Fig. 1
Fig. 1. The 22q11.2 deletion syndrome cohort and study design.
a Pie chart of intracardiac and aortic arch phenotypes. Control (gray, no significant heart defect); CTD (conotruncal heart defect, blue); ASD alone (isolated atrial septal defect but no other heart or aortic arch defects, light blue); VSD alone (isolated ventricular septal defect but no other heart or aortic arch defects, light blue). Pie chart includes controls (gray) versus CTD cases with phenotypes including: TOF (tetralogy of Fallot, light blue), RAA (right sided aortic arch, orange), IAAB (interrupted aortic arch type B, green), PTA (persistent truncus arteriosus, yellow), PS/PA (pulmonary stenosis and/or pulmonic atresia, blue) and other aortic arch defects such as abnormal origin of the right or left subclavian artery, alone (light green). b Schematic representation of the case-control study design using WGS. Variants were identified using PEMapper/Caller and validated by GATK. Only shared variants between both pipelines were used. Following quality control measures of the raw WGS data, variant annotation was performed to identify rare (< 1%) predicted LoF (loss of function), damaging splicing and damaging missense variants followed by filtering-based annotation on phastCons (conservation), CADD and CCRS (constrained coding regions) scores to identify MDRVs. Then gene set analyses were performed including over-representation (ORA) and weighted gene set based tests. STRING analysis was performed to identify potential biological network interactions. c Lateral side of mouse embryo at E10.5 with outline of tissues used for bulk RNA-sequencing (pharyngeal arches 2-6, PA2-6, blue; outflow tract and right ventricle, OFT + RV, green; left ventricle and atria, LV+atria, yellow).
Fig. 2
Fig. 2. Over-representation analysis (ORA) of recurrently affected genes identifies chromatin regulatory genes contributing risk to CTDs in 22q11.2DS.
Three different sources of gene sets totaling 19 are indicated by color below the bar graph (gene sets used by the PCGC to investigate sporadic CHD are indicated by black box, as well as in lilac and in gray). The first bar on the left in each panel shows the total number of recurrently affected genes (n) among all affected genes (N). The rest of the bars indicate the number of recurrently affected genes within each gene set (k) versus the final number of affected genes with MDRVs (most damaging rare variants) for each gene set (M) as indicated (see Methods for more details). The top two bar graphs show ORA results without filtering by gene expression levels in CTD cases (red) and with filtering (dark red) followed by the same for controls (green and dark green, respectively). The numbers in some of the bars denote the number of recurrently affected genes contained within the specific gene set / the total number of affected genes in this gene set. The gene set analyses were corrected for multiple testing by false discovery rare (FDR). Red asterisks denote significance after FDR correction; blue asterisk denotes borderline significance (P = 0.057).
Fig. 3
Fig. 3. Identification of chromatin regulatory genes in 22q11.2DS by a weighted gene set approach.
Three different sources of gene sets totaling 19 are indicated by color (gene sets used by the PCGC to investigate sporadic CHD are indicated; black box). Y-axis in the left denotes the number represented by the bars (three bars per gene set): the total number of genes included in each gene set for the weighted analysis, the total number of 22q11.2DS-CTD cases and controls. Genes were weighted by gene expression level (blue dots indicate P-value; scale on Y-axis; red star is significant after FDR correction).
Fig. 4
Fig. 4. Chromatin regulatory genes shared with sporadic CHD in the general population.
a Venn plot showing the number of chromatin genes, as well as the number and P-value for the overlap (arrow) of chromatin genes identified between 22q11.2DS-CTDs (green) and studies of sporadic CHD (PCGC-lilac and Sifrim-dark blue is from integrated analysis, light blue is de novo mutations in S-CHD). A total of 1861 variants were found in 1261 genes serving as the background of the analysis. b UpSet plot illustrates the connections that are shown in the Venn plot. Sifrim CHD refers to Sifrim et al, CHD genes (n = 16); 22q11.2 chromatin refers to 22q11.2DS chromatin genes (n = 39); Sifrim chromatin refers to Sifrim et al, chromatin genes (n = 65); PCGC chromatin refers to PCGC chromatin genes (n = 90). Individual genes in each set are provided in Supplementary Table 11. c Types of variants in chromatin genes (PTV is protein truncating, D-mis are damaging missense variants, mis is missense). A total of 57 PTVs were identified in 90 chromatin genes in sporadic CHD by the PCGC. In total, 14 PTVs were identified among 24 de novo variants in nine genes by Sifrim et al. A total of three PTVs were found among 42 variants in 22q11.2DS-CTDs. P-values derive from two-Proportions Z-Test.
Fig. 5
Fig. 5. Chromatin gene network of modifiers for CTDs in 22q11.2DS.
a STRING image of 39 chromatin genes as identified in 22q11.2DS subjects with CTDs. Edges indicate both functional and physical protein interactions (Protein-protein enrichment p-value, 5.03 × 10−14). The types of interaction evidence for the network edges are indicated by the line color (text mining, experiments, database, co-expression, neighborhood, gene fusion and co-occurrence). The high confidence score of 0.700 was used to create the network. Kmeans clustering was used to generate three clusters (cluster 1, red; cluster 2, blue; cluster 3, green). The nodes based on confidence; with line thickness indicates the strength of the support of the data in STRING. Six genes found by ORA are indicated (Italic blue font for gene names), chromatin genes found with de novo mutations in one or more cases with sporadic CHD (with asterisk next to the gene names). Constrained genes are indicated (Black circle surrounding nodes) and candidate sporadic CHD genes are shown (underscore for the gene names). b Representative most significant gene ontology terms from the STRING image, color coordinated according to the STRING image (molecular function, MF; cellular component, CC; biological process, BP). FDR, false discovery rate, -log10 P-value.
Fig. 6
Fig. 6. Expression of chromatin regulatory genes is enhanced in cardiac progenitor cells of the pharyngeal apparatus.
Heatmap plot of RNA-seq results of genes from Fig. 5 by the log 2 transformed expression level in PA2-6, OFT + RV and LV+atria as indicated with highest red to lowest blue color. One gene, HNRNPD is significantly highly expressed than the rest of genes KPM = 507, 334 and 296, respectively, as the rest expression KPM value ranging from 1 to 197.
Fig. 7
Fig. 7. Model of chromatin regulators that mediate TBX1 function.
Protein complexes involved in histone modifications (NuA4 histone acetyltransferase complex-NuA4 acetyl; Monocyte leukemia zinc finger complex-MOZ; BRG1/BRM complex (SWI/SNF), BAF; Polycomb repressive complex, PRC; Complex of proteins associated with Set1, COMPASS) are shown (similar colors as Fig. 5a-STRING image) surrounding a representative nucleosome. a MYST family proteins involved in histone acetylation with respect to regulation of TBX1 expression. b TBX1 protein regulates expression of downstream genes including WNT5a, via chromatin regulators that belong to several classes as indicated. This is mediated in part, by physical interaction with CHD7. DNA is shown as a gray double helix. Gene activation is shown as an arrow and repression as a cross bar.

Comment in

References

    1. McDonald-McGinn DM, et al. 22q11.2 deletion syndrome. Nat. Rev. Dis. Prim. 2015;1:15071. doi: 10.1038/nrdp.2015.71. - DOI - PMC - PubMed
    1. Jerome LA, Papaioannou VE. DiGeorge syndrome phenotype in mice mutant for the T-box gene, Tbx1. Nat. Genet. 2001;27:286–291. doi: 10.1038/85845. - DOI - PubMed
    1. Lindsay EA, et al. Tbx1 haploinsufficieny in the DiGeorge syndrome region causes aortic arch defects in mice. Nature. 2001;410:97–101. doi: 10.1038/35065105. - DOI - PubMed
    1. Merscher S, et al. TBX1 is responsible for cardiovascular defects in velo-cardio-facial/DiGeorge syndrome. Cell. 2001;104:619–629. doi: 10.1016/S0092-8674(01)00247-1. - DOI - PubMed
    1. Yagi H, et al. Role of TBX1 in human del22q11.2 syndrome. Lancet. 2003;362:1366–1373. doi: 10.1016/S0140-6736(03)14632-6. - DOI - PubMed