. 2023 Jul 18;13(1):11617.
doi: 10.1038/s41598-023-38889-x.

Identification of circulating monocytes as producers of tuberculosis disease biomarker C1q

Affiliations

Identification of circulating monocytes as producers of tuberculosis disease biomarker C1q

Paula Niewold et al. Sci Rep. .

Abstract

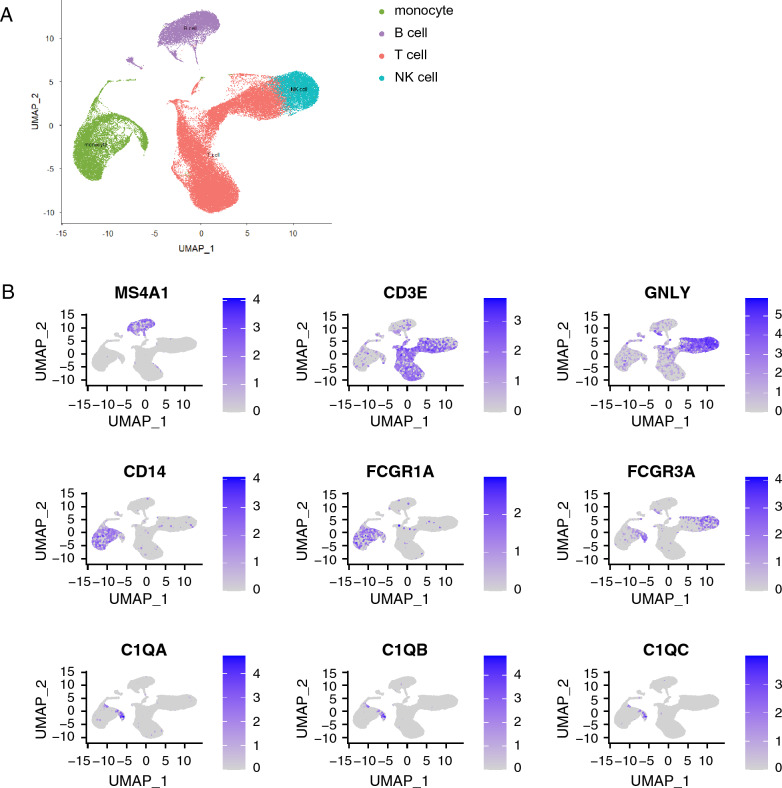
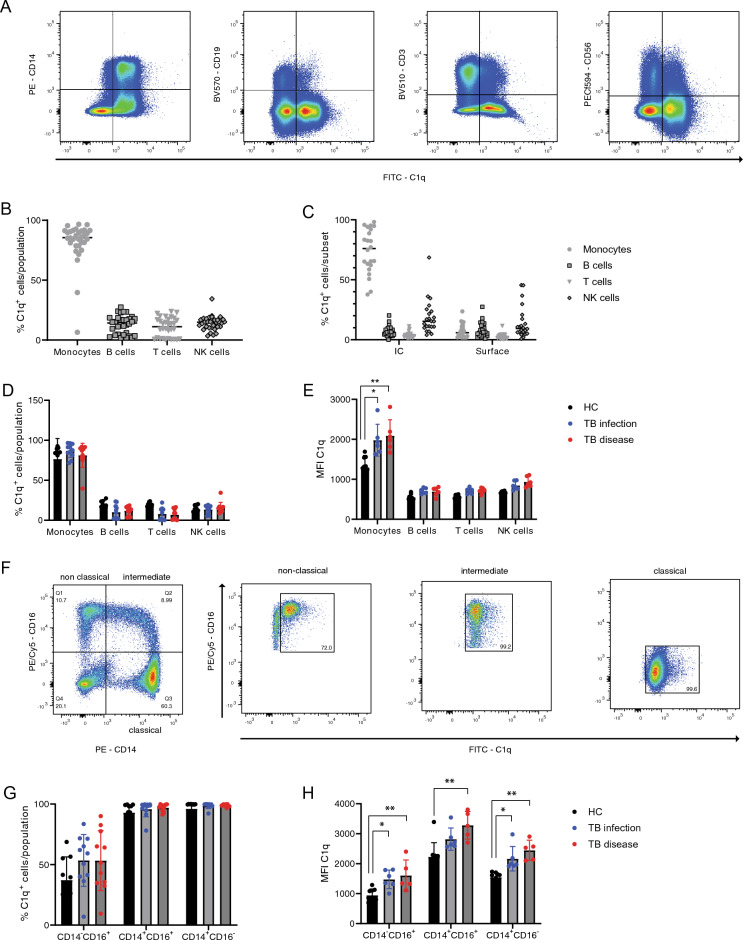
Tuberculosis (TB) is a prevalent disease causing an estimated 1.6 million deaths and 10.6 million new cases annually. Discriminating TB disease from differential diagnoses can be complex, particularly in the field. Increased levels of complement component C1q in serum have been identified as a specific and accessible biomarker for TB disease but the source of C1q in circulation has not been identified. Here, data and samples previously collected from human cohorts, a clinical trial and a non-human primate study were used to identify cells producing C1q in circulation. Cell subset frequencies were correlated with serum C1q levels and combined with single cell RNA sequencing and flow cytometry analyses. This identified monocytes as C1q producers in circulation, with a pronounced expression of C1q in classical and intermediate monocytes and variable expression in non-classical monocytes.


Conflict of interest statement

The authors declare no competing interests.

Figures

Figure 1
Figure 1
C1q serum levels are increased in patients with pulmonary tuberculosis disease but not during Salmonella Typhi infection. Serum C1q levels (µg/mL) were measured by ELISA in different cohorts; (A) in a cohort of individuals with TB disease (n = 31), TB infection (n = 65) and healthy controls (n = 20) from Utrecht and Leiden, (B) in an Indonesian cohort of Salmonella Typhi patients (n = 50) compared to endemic controls (n = 50) and (C) in a controlled human infection study with Salmonella Typhi, prior to infection (D0) (n = 20), time of diagnosis (n = 20) and 48 h after diagnosis (n = 20). Data was analyzed using a Kruskal–Wallis test.
Figure 2
Figure 2
C1q serum levels correlate with circulating monocyte numbers in TB-infected humans and non-human primates. (A) Serum levels of C1q (µg/mL) as measured by ELISA in an Italian cohort of healthy controls (n = 5) and individuals with TB infection (n = 18), TB disease (n = 19) or past TB disease (n = 19). (BF) Enumeration of cell populations in the circulation: leukocytes (B), lymphocytes (C), neutrophils (D), monocytes (E) and the monocyte/lymphocyte ratio (F). (GK) Correlation between serum C1q (µg/mL) and cell subsets: leukocytes (G), lymphocytes (H), neutrophils (I), monocytes (J) and M/L ratio (K). Dots are colour-coded for the status of the individual: healthy (black), TB infection (blue), TB disease (red) or past TB (green). (LO) Correlations between serum C1q levels and cell counts of rhesus macaques with (blue) or without (red) BCG vaccination at 6 and 12 weeks post infection with Mtb. Data in panel (AF) were analyzed using Kruskal–Wallis test with a Dunn’s multiple comparisons correction and data in panel G-O were analyzed by Spearman’s correlation.
Figure 3
Figure 3
Monocytes are a main source of C1Q transcripts in single cell transcriptomic analysis. Single cell RNA sequencing data from healthy controls (n = 2), TB infected (n = 2) and TB diseased individuals (n = 3) was integrated for analysis. (A) Following quality control steps and scaling, PCA and UMAP were performed and cell clusters shown in a dimension plot and identified as B cells (purple), T cells (red), NK cells (blue) and monocytes (green) based on their transcript expression patterns. (B) Expression levels of MS4A1 (encoding CD20), CD3E, GNLY, CD14, FCGR1A, FCGR3A, C1QA, C1QB and C1QC across these clusters are shown.
Figure 4
Figure 4
Monocytes are the main C1q-producing cells in circulation. Expression of C1q was determined by flow cytometry in healthy controls (n = 10), TB infected- (n = 11) and TB diseased individuals (n = 11) from the Leiden cohort. (A) Representative plots of anti-C1q staining of CD14+ monocytes, CD19+ B cells, CD3+ T cells and CD56+ NK cells. (B) Percentage of C1q+ cells per population and (C) as detected via intracellular (left) and surface (right) anti-C1q staining. (D,E) Quantification of percentage C1q+ cells (D) and MFI (E) per cell type in the different patient groups. (F) Representative plots of monocyte classification into CD14CD16+ non-classical, CD14+CD16+ intermediate monocytes and CD14+CD16 classical monocytes and their expression of C1q. (G,H) Quantification of percentage (G) and MFI (H) of C1q expression per monocyte subset in healthy controls (black), individuals with TB infection (blue) and TB disease (red). Data in panel (D,E,G,H) were analyzed using Kruskal–Wallis test with a Dunn’s multiple comparisons correction.

Similar articles

Cited by

References

    1. Pai M, Kasaeva T, Swaminathan S. Covid-19's devastating effect on tuberculosis care: A path to recovery. N Engl J Med. 2022;386:1490–1493. doi: 10.1056/NEJMp2118145. - DOI - PubMed
    1. Parrish NM, Dick JD, Bishai WR. Mechanisms of latency in Mycobacterium tuberculosis. Trends Microbiol. 1998;6:107–112. doi: 10.1016/s0966-842x(98)01216-5. - DOI - PubMed
    1. Carranza C, Pedraza-Sanchez S, de Oyarzabal-Mendez E, Torres M. Diagnosis for latent tuberculosis infection: New alternatives. Front. Immunol. 2020;11:2006. doi: 10.3389/fimmu.2020.02006. - DOI - PMC - PubMed
    1. Goletti D, Delogu G, Matteelli A, Migliori GB. The role of IGRA in the diagnosis of tuberculosis infection, differentiating from active tuberculosis, and decision making for initiating treatment or preventive therapy of tuberculosis infection. Int. J. Infect. Dis. 2022;124(Suppl 1):S12–S19. doi: 10.1016/j.ijid.2022.02.047. - DOI - PubMed
    1. Petruccioli E, et al. Correlates of tuberculosis risk: Predictive biomarkers for progression to active tuberculosis. Eur. Respir. J. 2016;48:1751–1763. doi: 10.1183/13993003.01012-2016. - DOI - PMC - PubMed

Publication types