. 2023 Jul 18;13(1):11561.
doi: 10.1038/s41598-023-38605-9.

Calretinin-expressing islet cells are a source of pre- and post-synaptic inhibition of non-peptidergic nociceptor input to the mouse spinal cord

Affiliations

Calretinin-expressing islet cells are a source of pre- and post-synaptic inhibition of non-peptidergic nociceptor input to the mouse spinal cord

Olivia C Davis et al. Sci Rep. .

Abstract

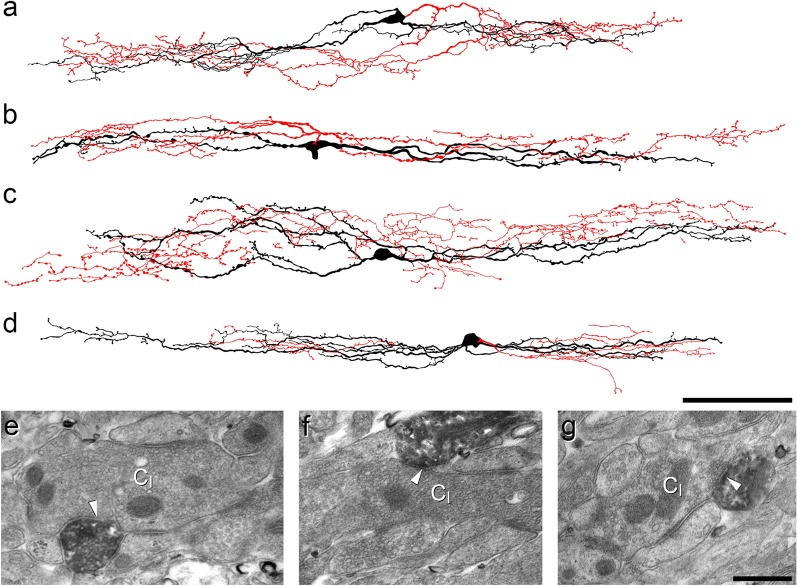
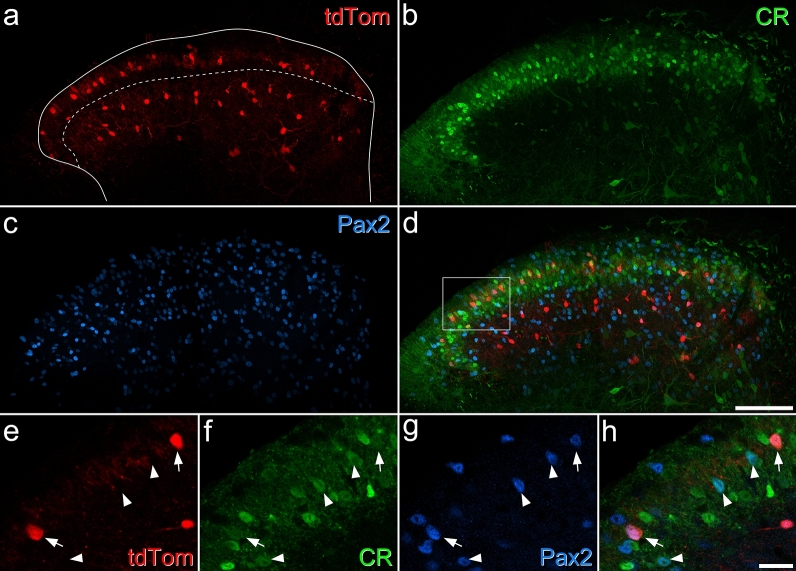
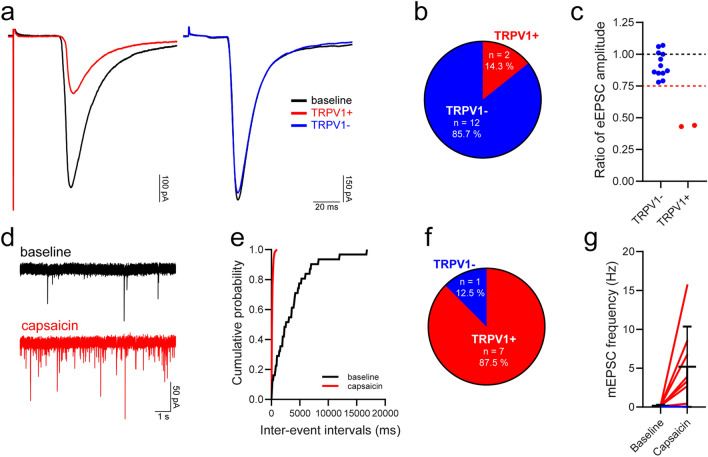
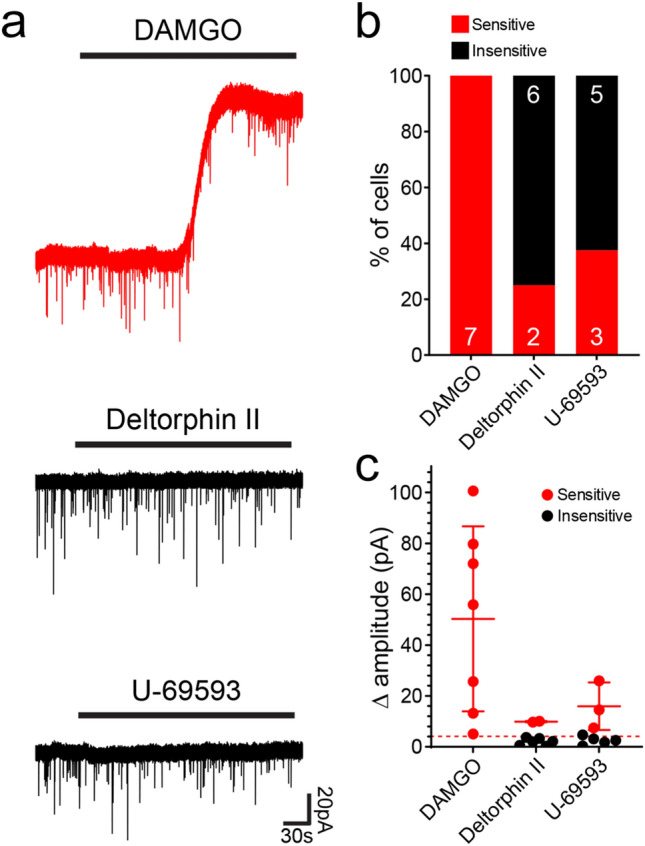
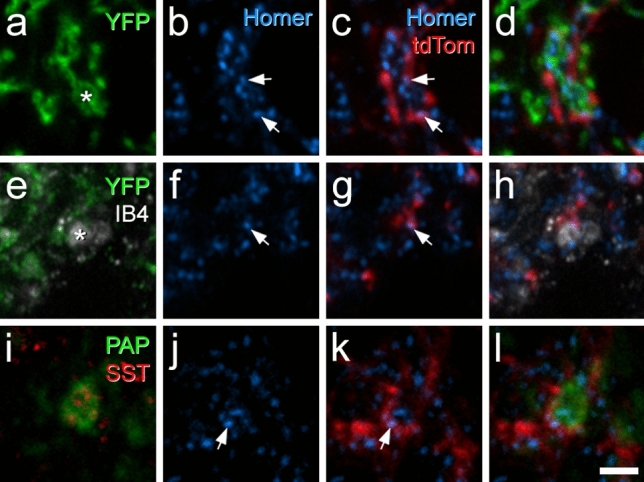
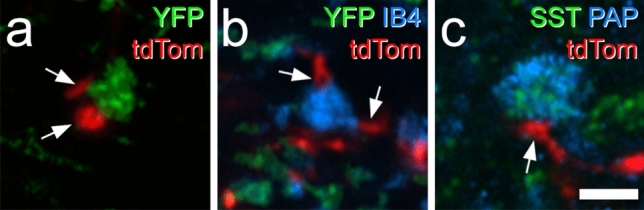
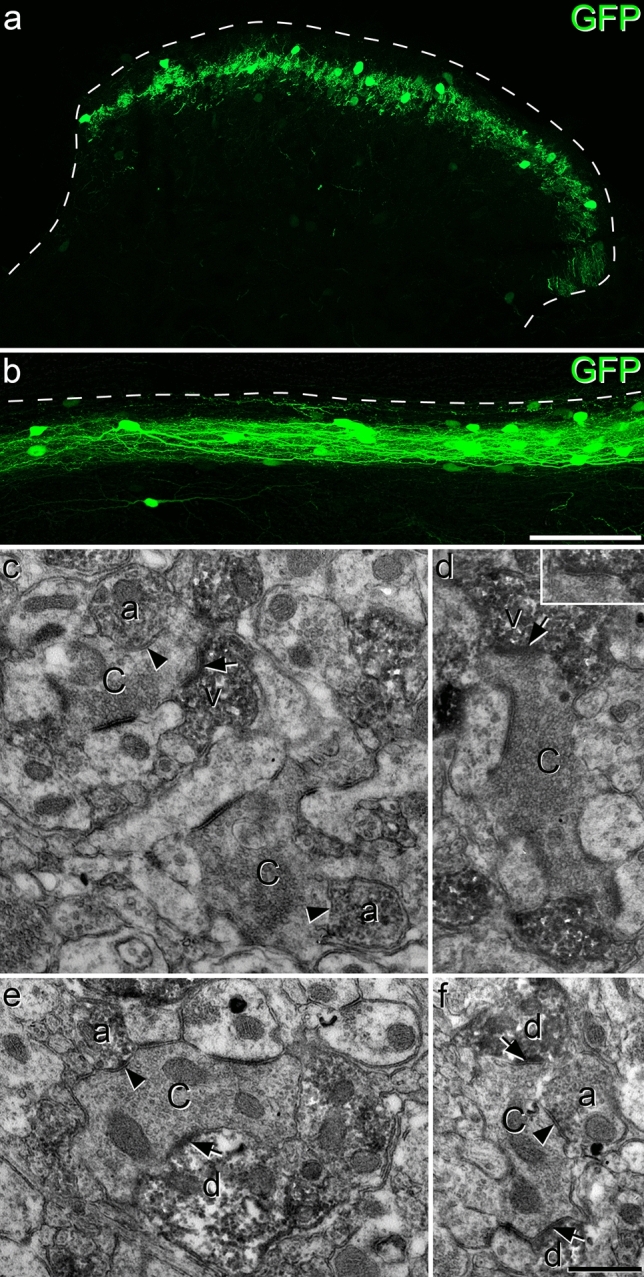
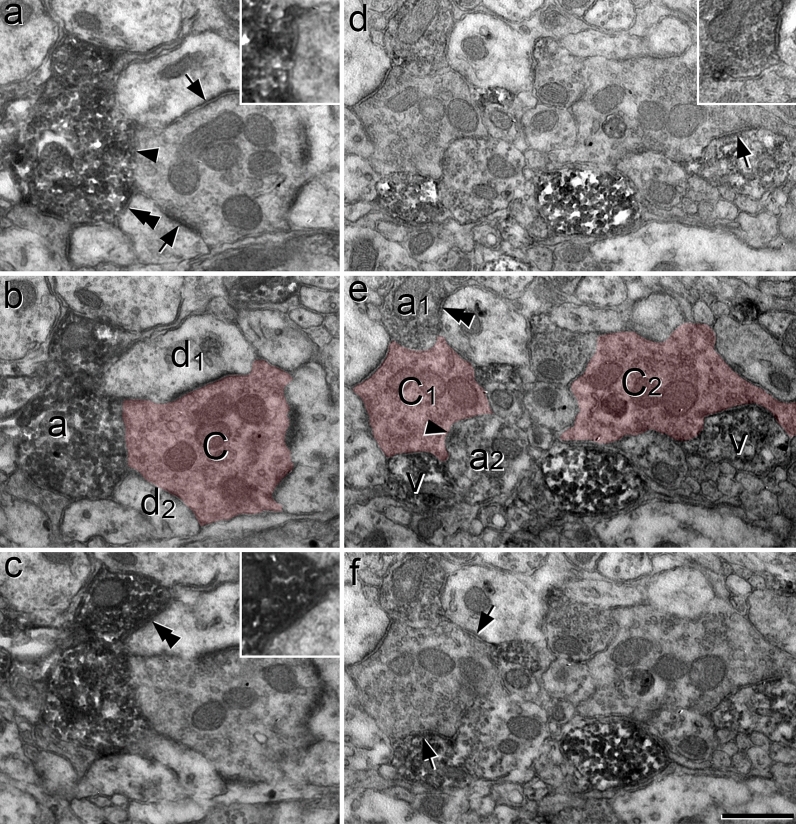
Unmyelinated non-peptidergic nociceptors (NP afferents) arborise in lamina II of the spinal cord and receive GABAergic axoaxonic synapses, which mediate presynaptic inhibition. However, until now the source of this axoaxonic synaptic input was not known. Here we provide evidence that it originates from a population of inhibitory calretinin-expressing interneurons (iCRs), which correspond to lamina II islet cells. The NP afferents can be assigned to 3 functionally distinct classes (NP1-3). NP1 afferents have been implicated in pathological pain states, while NP2 and NP3 afferents also function as pruritoceptors. Our findings suggest that all 3 of these afferent types innervate iCRs and receive axoaxonic synapses from them, providing feedback inhibition of NP input. The iCRs also form axodendritic synapses, and their targets include cells that are themselves innervated by the NP afferents, thus allowing for feedforward inhibition. The iCRs are therefore ideally placed to control the input from non-peptidergic nociceptors and pruritoceptors to other dorsal horn neurons, and thus represent a potential therapeutic target for the treatment of chronic pain and itch.


Conflict of interest statement

The authors declare no competing interests.

Figures

Figure 1
Figure 1
Reconstruction of iCRs and examples of their ultrastructure. (ad) show reconstructions of the soma and dendritic trees (black) as well as the axonal arbor (red) for 4 of the 5 cells recovered from whole-cell recordings in slices from CR::GFP mice. (eg) Examples of the appearance of the cell shown in (d) as seen with the electron microscope. (e,f) show axonal boutons belonging to this cell forming axoaxonic synapses onto the central terminals of type I glomeruli (CI). In (g), part of a dendrite of this cell is postsynaptic to another type I central glomerular bouton (arrowhead). Scale bars = 100 μm (ad) and 0.5 μm (eg).
Figure 2
Figure 2
Expression of tdTomato in a RorbCreERT2;Ai9 mouse. (ad) A transverse section through the lumbar spinal cord from a RorbCreERT2;Ai9 mouse, immunostained to reveal tdTomato (red), calretinin (CR, green) and Pax2 (blue). The solid line shows the outline of the grey matter and the dashed line the approximate position of the lamina II–III border. (a) There are many tdTomato positive cells in the middle of lamina II, and others in deeper laminae (III–IV), but there are relatively few cells in a narrow band on either side of the border between laminae II and III. (b) There are many calretinin-immunoreactive cells in laminae I–II, and scattered weakly-labelled cells in the deep dorsal horn. (c) Pax2 is expressed by all inhibitory interneurons in the dorsal horn, and there are many immunoreactive cells throughout this region. (eh) A higher magnification view through the superficial laminae (corresponding to the area outlined by the box in (d)). Two tdTomato-positive cells are marked by arrows, and these are both immunoreactive for calretinin and Pax2. Arrowheads mark three other calretinin-positive/Pax2-positive cells that lack tdTomato. Images in (ad) are maximum intensity projections of 24 optical sections at 2 μm z-spacing, while those in (e,f) are from a single optical section. Scale bars = 100 μm (ad) and 20 μm (eh).
Figure 3
Figure 3
Expression of Tac1 mRNA in tdTomato-positive neurons in the RorbCreERT2;Ai9 mouse. (ac) show fluorescence in situ hybridisation signals for tdTom (red), Gad1 (blue) and Tac1 (green) mRNAs, while (d) shows a merged image with NucBlue counterstain (grey). The asterisk marks a cell that is positive for all 3 signals, the arrow a Tac1+/Gad1+ cell that lacks tdTom, and the arrowhead an excitatory (Gad1-negative) Tac1+ cell that also lacks tdTom. Images are maximum intensity projections of confocal optical sections (1 μm z-separation) through the full thickness of the section. Scale bar = 20 μm.
Figure 4
Figure 4
Action potential firing patterns, subthreshold voltage-activated currents and primary afferent input for iCRs. (a) Examples of action potential firing patterns observed in iCRs in response to 1-s current injections. (b) Most iCRs exhibited tonic firing, with smaller proportions displaying transient or single spike firing. (c) Representative traces showing hyperpolarisation-activated (Ih) and low-threshold calcium (ICa,T) currents, in response to a voltage step protocol (bottom left). Each trace shows an average of 5 sweeps. (d) Most iCRs displayed Ih and/or ICa,T, while A-type potassium currents (IA) were rarely observed. (e) Representative traces of monosynaptic C fibre input to iCRs, revealed in response to electrical stimulation of dorsal roots. Low frequency traces are an average of 3 sweeps, high frequency trace shows 20 superimposed sweeps. (f) The majority of iCRs received primary afferent input that was classified as monosynaptic from C fibres; for the remaining cells the input was classified as polysynaptic only. In six cells we found primary afferent input from both L4 and L5 dorsal roots; an example of a cell with monosynaptic C fibre input from both roots is shown in (g). Grey traces are 20 individual sweeps, black traces are an average of the grey traces. In most iCRs (8/11) the monosynaptic C fibre input was sufficient to drive action potential firing, and an example is shown in (h). This shows three individual traces superimposed.
Figure 5
Figure 5
TRPV1 expression by primary afferents that provide input to iCRs. (a) Representative traces showing monosynaptic C fibre input to iCRs before (baseline, black traces) and during application of the TRPV1 agonist capsaicin in two individual cells classified as having TRPV1-sensitive (TRPV1+, red trace) and TRPV1-insensitive (TRPV1−, blue trace) monosynaptic C fibre input. Traces are an average of 15 sweeps, comprising the last 5 min of baseline recordings (baseline) or the final 5 min of capsaicin application (TRPV1+/TRPV1−). (b,c) Most iCRs received monosynaptic C fibre input that was classified as TRPV1-insensitive. The dashed red line in c denotes a value of 0.75, the threshold for defining whether a monosynaptic C fibre input was classified as TRPV1-insensitive (> 0.75) or TRPV1-sensitive (≤ 0.75). (d) Representative mEPSC traces recorded during baseline and during the application of capsaicin. (e) Example of a cumulative probability plot that demonstrates a significant leftward shift in the distribution of mEPSC inter-event intervals in response to the application of capsaicin (p < 0.00001, Kolmogorov–Smirnov 2-sample test, taken from the same cell as (d)) (f) A significant leftward shift in inter-event intervals, signifying an increase in mEPSC frequency, was observed in 7 out of 8 cells tested, with those cells being classified as receiving TRPV1+ primary afferent input. The effect of capsaicin on mEPSC frequency in cells receiving TRPV1+ input (red lines) and the single cell with input that was defined as TRPV1− (blue line) is shown in (g).
Figure 6
Figure 6
Responses of iCRs to opioids tested in RorbCreERT2;Ai9 mice. (a) Examples of responses to the μ-opioid agonist DAMGO, the δ-opioid agonist deltorphin II and the κ-opioid agonist U-69593. The cell tested with DAMGO showed an outward current (top trace), while those tested with Deltorphin II (middle trace) and U-69593 (bottom trace) did not respond. (b) The proportions of cells that were sensitive or insensitive to each agonist. (c) The amplitudes of responses to the agonists for each cell tested, with mean and SD of the cells sensitive to each agonist. The dashed line represents a value of 5 pA, which was taken as the threshold for defining a responsive cell.
Figure 7
Figure 7
Confocal images showing synaptic input to Rorb cells from non-peptidergic nociceptors. (ad) Immunostaining for YFP (green), Homer (blue) and tdTomato (red) in lamina II in a section from a RorbCreERT2;Ai9;MrgDChR2-YFP mouse. A YFP-positive central terminal (marked with asterisk in (a)) is surrounded by several Homer puncta. Two of these (marked with arrows) are in tdTomato-positive profiles. (eh) A region from lamina II in another RorbCreERT2;Ai9;MrgDChR2-YFP mouse, scanned to reveal YFP (green), IB4 binding (grey), Homer (blue) and tdTomato (red). A central terminal that binds IB4 but lacks YFP is indicated with an asterisk in (e). This is adjacent to two Homer puncta, one of which (marked with arrows in (f) and (g)) is in a tdTomato-labelled profile. (il) Immunostaining for prostatic acid phosphatase (PAP, green) and somatostatin (SST, red) reveals the central terminal of a SST-expressing (NP3) afferent. This is in contact with a Homer punctum (arrows in (j) and (k)) that is located in a tdTomato-labelled profile. Images in (ad) and (ik) are from single confocal optical sections, while those in (eh) are from a projection of 3 optical sections at 0.3 μm z-separation. Scale bar = 2 μm.
Figure 8
Figure 8
Contacts between Rorb axons and central terminals of non-peptidergic nociceptors in lamina II seen in RorbCreERT2;Ai34;MrgDChR2-YFP mice. (a) Immunostaining for YFP (green) and tdTomato (tdTom, red) reveals a YFP-positive (MrgD, NP1) central terminal that receives contacts from two tdTomato-labelled profiles (arrows). (b) In this case, IB4 binding (blue) is seen in a central terminal that lacks YFP (green), and probably belongs to a NP2 afferent. This receives two contacts from tdTomato-labelled profiles (arrows). (c) Immunostaining for somatostatin (SST, green) and prostatic acid phosphatase (PAP, blue) is seen in the central terminal of a SST-expressing (NP3) primary afferent. This is in contact with a tdTom-labelled profile (arrow). All images are projections of 3 optical sections at 0.3 μm z-spacing. Scale bar = 2 μm.
Figure 9
Figure 9
Confocal and electron microscopy of iCRs identified in a CRCre;VGATFlp mouse injected with AAV.Con/Fon.GFP. (a,b) Transverse and sagittal sections demonstrate that GFP labelling is largely restricted to lamina II. In each case the dashed line represents the dorsal border of the grey matter. (cf) EM images from lamina II obtained following an immunoperoxidase/DAB reaction to reveal GFP. (c) Two glomerular central terminals (C) are contacted by several DAB-labelled profiles. Two of these (a) contain numerous synaptic vesicles and form axoaxonic synapses (marked by arrowheads) onto the central terminals. One of the DAB-labelled profiles (v) is a vesicle-containing dendrite (VCD) that receives a synapse (arrow) from one of the central terminals. (d) A glomerular central terminal (C) is in contact with 2 DAB-labelled profiles. One of these (v) can be identified as a VCD, as it contains vesicles and receives an asymmetrical synapse (arrow) from the central terminal. The inset shows the synaptic cleft, as seen following tilting of the specimen. Note that the central terminals in both (c) and (d) resemble those in type I glomeruli, as defined by Ribeiro-da-Silva and Coimbra. (e,f) These micrographs show associations between DAB-labelled profiles and glomerular central axons that do not show typical features of those in type I glomeruli. In each case the central terminal (C) receives an axoaxonic synapse (arrowhead) from a DAB-labelled profile identified as an axon terminal (a) and is presynaptic to at least one DAB-labelled dendrite (d) at an axodendritic synapse (arrows). Images in (a) and (b) are projections of 9 and 27 confocal optical sections at 1 μm z-spacing. Scale bars = 100 μm (a,b) and 0.5 μm (cf).
Figure 10
Figure 10
Synaptic triads involving iCRs, as seen in serial ultrathin sections from a CRCre;VGATFlp mouse that had received intraspinal injection of AAV.Con/Fon.GFP. (ac) Serial ultrathin sections show a glomerular central terminal (C) that receives an axoaxonic synapse (arrowhead in (a)) from a DAB-labelled axonal bouton (a). This synapse is slightly oblique to the plane of section and is seen more clearly following tilting of the specimen (inset in (a)). The DAB-labelled axon is also presynaptic to two unlabelled dendrites (d1, d2) at synapses marked by double arrowheads. The synapse on d1 is shown in an enlarged view in the inset in (c). The central terminal is presynaptic to both d1 and d2 at synapses that are marked with arrows in (a). These therefore represent triadic arrangements, in which an inhibitory axon forms axoaxonic synapses onto the central terminal and axodendritic synapses onto dendrites that are also postsynaptic to the central terminal. (d–f) Serial ultrathin sections through another region in lamina II include the central terminals of two nearby synaptic glomeruli (C1, C2), which are associated with several DAB-labelled structures. The terminal marked C1 is presynaptic to a labelled VCD (v) at an axodendritic synapse (arrow in f), and receives axoaxonic synapses from two labelled axonal boutons (a1, a2). One of these synapses (from a2) is indicated with an arrowhead in (e), while the other (from a1) can be seen in the inset in (d). The bouton a1 also forms a synapse onto an unlabelled dendrite (double arrowhead in (e)) and this dendrite receives a synapse from the C1 terminal (arrow in (f)), completing a synaptic triad. The other central terminal (C2) is presynaptic to a labelled VCD (v) at an axodendritic synapse (arrow in (d)). The central terminals are indicated with pink shading in (b) and (e). Scale bar = 0.5 μm.
Figure 11
Figure 11
Functional identification of iCR-mediated presynaptic inhibition. (a) Schematic diagram summarising potential sources of excitatory input in response to photostimulation of channelrhodopsin-expressing calretinin neurons. Excitatory calretinin (eCR) neurons with direct input to a recorded cell give rise to a short latency monosynaptic input (Mono (eCR)). eCR neurons can also produce longer latency polysynaptic input (Poly (eCR)) by activating interposed excitatory interneurons. Alternatively, iCR neurons can elicit excitatory signals by releasing GABA onto primary afferents (PA), producing primary afferent depolarisation that can be observed as a longer latency polysynaptic excitatory input (Poly (iCR)). (b) Representative recordings show pharmacological dissection of optogenetic EPSCs (oEPSCs) during photostimulation in CRCre;Ai32 mice (control = black, bicuculline = red, CNQX = orange). Left traces show a multicomponent oEPSC response (black trace) where bicuculline application abolished a longer latency component (red), while the short latency component was bicuculline resistant and CNQX sensitive. Middle traces show a multicomponent oEPSC response (black trace) where bicuculline dramatically reduced longer latency components, with the remaining oEPSCs abolished by CNQX. Right traces show a multicomponent oEPSC response (black trace) that exhibited little change on bicuculline application but was abolished when CNQX was applied. Inset shows expanded response peaks, highlighting a modest increase in the first, and decrease in the second peak after bicuculline addition. (c) Scatter plot shows oEPSC latency versus jitter for CR photostimulation-evoked oEPSC responses (14 recordings). A population of short latency (< 8 ms) low jitter (< 1.2 ms) oEPSCs are likely to result from direct monosynaptic input from eCRs (grey shading). In contrast, polysynaptic circuits driven by eCRs or iCRs produce oEPSCs with longer latencies and higher jitter. (d) Group data plots compare the sensitivity of monosynaptic and polysynaptic oEPSCs to bicuculline (left) and CNQX (right), using the oEPSC index. This is defined as the oEPSC amplitude in the presence of the drug divided by the oEPSC amplitude prior to drug application, with an oEPSC index of 1 indicating that the drug has no effect, and an index of 0 indicating that the drug completely blocks the oEPSC response. Several polysynaptic oEPSCs are reduced by bicuculline, whereas monosynaptic oEPSCs are resistant. All oEPSCs are CNQX sensitive.
Figure 12
Figure 12
Schematic diagram summarising synaptic connections involving inhibitory calretinin cells and primary afferents. A non-peptidergic nociceptor (NP) forms excitatory synapses onto an inhibitory calretinin cell (iCR) in lamina II and a lamina I projection neuron belonging to the anterolateral system (ALS). The ALS cell is shown as representative of spinal neurons that are innervated by NP afferents. The iCR axon contributes to a synaptic triad, which is shown in more detail in the inset. The excitatory (glutamatergic) synapse between the NP afferent and the ALS cell is indicated with a yellow arrow. The axon of the iCR is presynaptic to the NP afferent (upper red arrow) at an axoaxonic synapse, and to the ALS cell dendrite (lower red arrow) at an axodendritic synapse. These synapses are both GABAergic, and mediate pre- and postsynaptic inhibition, respectively. GABA acting at the axoaxonic synapse will reduce glutamate release at the synapse from the NP afferent to the ALS cell (feedback inhibition), while at the axodendritic synapse it will directly inhibit the ALS cell (feedforward inhibition).

Update of

References

    1. Todd AJ. Neuronal circuitry for pain processing in the dorsal horn. Nat. Rev. Neurosci. 2010;11:823–836. doi: 10.1038/nrn2947. - DOI - PMC - PubMed
    1. Snider WD, McMahon SB. Tackling pain at the source: New ideas about nociceptors. Neuron. 1998;20:629–632. doi: 10.1016/S0896-6273(00)81003-X. - DOI - PubMed
    1. Ribeiro-da-Silva A. Ultrastructural features of the colocalization of calcitonin gene related peptide with substance P or somatostatin in the dorsal horn of the spinal cord. Can. J. Physiol. Pharmacol. 1995;73:940–944. doi: 10.1139/y95-130. - DOI - PubMed
    1. Ribeiro-da-Silva A, Coimbra A. Two types of synaptic glomeruli and their distribution in laminae I–III of the rat spinal cord. J. Comp. Neurol. 1982;209:176–186. doi: 10.1002/cne.902090205. - DOI - PubMed
    1. Gerke MB, Plenderleith MB. Ultrastructural analysis of the central terminals of primary sensory neurones labelled by transganglionic transport of Bandeiraea simplicifolia I-isolectin B4. Neuroscience. 2004;127:165–175. doi: 10.1016/j.neuroscience.2004.05.008. - DOI - PubMed

Publication types