Meta-Analysis
. 2023 Jul;29(7):1832-1844.
doi: 10.1038/s41591-023-02352-1. Epub 2023 Jul 18.

Depression pathophysiology, risk prediction of recurrence and comorbid psychiatric disorders using genome-wide analyses

Affiliations
Meta-Analysis

Depression pathophysiology, risk prediction of recurrence and comorbid psychiatric disorders using genome-wide analyses

Thomas D Als et al. Nat Med. 2023 Jul.

Abstract

Depression is a common psychiatric disorder and a leading cause of disability worldwide. Here we conducted a genome-wide association study meta-analysis of six datasets, including >1.3 million individuals (371,184 with depression) and identified 243 risk loci. Overall, 64 loci were new, including genes encoding glutamate and GABA receptors, which are targets for antidepressant drugs. Intersection with functional genomics data prioritized likely causal genes and revealed new enrichment of prenatal GABAergic neurons, astrocytes and oligodendrocyte lineages. We found depression to be highly polygenic, with ~11,700 variants explaining 90% of the single-nucleotide polymorphism heritability, estimating that >95% of risk variants for other psychiatric disorders (anxiety, schizophrenia, bipolar disorder and attention deficit hyperactivity disorder) were influencing depression risk when both concordant and discordant variants were considered, and nearly all depression risk variants influenced educational attainment. Additionally, depression genetic risk was associated with impaired complex cognition domains. We dissected the genetic and clinical heterogeneity, revealing distinct polygenic architectures across subgroups of depression and demonstrating significantly increased absolute risks for recurrence and psychiatric comorbidity among cases of depression with the highest polygenic burden, with considerable sex differences. The risks were up to 5- and 32-fold higher than cases with the lowest polygenic burden and the background population, respectively. These results deepen the understanding of the biology underlying depression, its disease progression and inform precision medicine approaches to treatment.


Conflict of interest statement

B.J.V. is a member of the advisory board for Allelica. D.D. has received a speaker fee from Takeda. B.W., T.T., H.S. and K.S. are employed at deCODE/Amgen. M.J.D. is a founder of Maze Therapeutics and on the Scientific Advisory Board of RBNC Therapeutics. The other authors declare no competing interests.

Figures

Extended Display Figure 1:
Highlighted Regional Miami plots of GWAS and TWAS results, corresponding to the genomic region of (A) GABRA1, (B) CYP7B1, (C) DCC, (D) CTTNBP2, (E) FURIN and (F) GIGYF2 genes/transcripts (1Mbp window from start site). Top panels: GWAS results (black dots): The x-axis shows genomic position, and the y-axis shows significance as −log10(P) of z statistics (two-sided nominal P-values); blue line corresponds to P=1×10⁻⁵, orange line to P=5×10⁻⁸ (genome-wide significance). Bottom panels: TWAS results: The x-axis shows genomic position. The y-axis shows significance as −log10(P) of z statistics (two-sided nominal P-values) for genes represented by both gene expression and isoform expression. Green triangles facing upwards or downwards for a positive or negative association z-score (Wald test; two-sided P-values) respectively (up- or down-regulation); transcripts with Bonferroni-adjusted (for all reliably imputed transcripts) P-value<0.1 are labelled; orange line corresponds to Bonferroni-adjusted P=0.05. Each Bonferroni-significant transcript is connected with lines to the SNPs contributing to its transcriptomic imputation model; lines are grey when the SNPs have a P>1×10⁻⁵, blue when P<1×10⁻⁵ but orange when P<5×10⁻⁸. The SNPs that are above the blue line and contribute to the transcriptomic imputation models of significant transcripts are labelled. See Supplementary Figure S19-1 to S19-88 and Table S19.
Extended Display Figure 2:
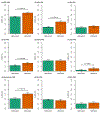
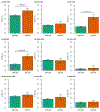
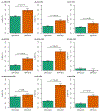
MvPRS analyses of depression cases with/without anxiety (ANX). Depression-subphenotype is shown on the x-axis (NDEPwoANX=22114, NDEPwoANX=7044 and Nctrls=38142). The slope (β) of the linear regression (95% CI) for each depression subphenotype is shown on the y-axis. Significant difference between β for depression without/with an additional diagnosis is indicated with horizontal line with nominal two-sided P-value above, i.e. the Wald test of equal group effect (see Supplementary Table 12A). Overall two-sided P-value=1.2e-21. Cases with bipolar disorder were excluded. The polygenic risk scores analyzed are (A) PRS for depression (DEP-PRS), (B) PRS for anxiety (ANX-PRS), (C) PRS for bipolar disorder (BP-PRS), (D) PRS for schizophrenia (SZ-PRS), (E) PRS for ADHD (ADHD-PRS), (F) PRS for autism (ASD-PRS), (G) PRS for neuroticism (Neuroticism-PRS), (H) PRS for substance use (SU-PRS), and (I) PRS for substance use disorder (SUD-PRS). See Supplementary Table S12B, S12C, Supplementary Figure S14-1 and S14-2 for sex-stratified analyses.
Extended Display Figure 3:
MvPRS analyses of depression cases with/without bipolar disorder (BP). Depression-subphenotype is shown on the x-axis (NDEPwoBP=29158, DEPwBP, N=1460 and Nctrls=38200). The slope (β) of the linear regression (95% CI) for each depression subphenotype is shown on the y-axis. Significant difference between β for depression without/with an additional diagnosis is indicated with horizontal line with nominal two-sided P-value above, i.e. the Wald test of equal group effect (See Supplementary Table 12D). Overall two-sided P-value=1.5e-15. The polygenic risk scores analyzed are (A) PRS for depression (DEP-PRS), (B) PRS for anxiety (ANX-PRS), (C) PRS for bipolar disorder (BP-PRS), (D) PRS for schizophrenia (SZ-PRS), (E) PRS for ADHD (ADHD-PRS), (F) PRS for autism (ASD-PRS), (G) PRS for neuroticism (Neuroticism-PRS), (H) PRS for substance use (SU-PRS), and (I) PRS for substance use disorder (SUD-PRS). See Supplementary Table S12E, S12F, Supplementary Figure S14–1 and S14-2 for sex-stratified analyses.
Extended Display Figure 4:
MvPRS analyses of depression cases with/without schizophrenia (SZ). Depression-subphenotype is shown on the x-axis (NDEPwoSZ=25253, NDEPwSZ=3905 and Nctrls=38142). The slope (β) of the linear regression (95% CI) for each depression subphenotype is shown on the y-axis. Significant difference between β for depression without/with an additional diagnosis is indicated with horizontal line with nominal two-sided P-value above, i.e. the Wald test of equal group effect (see Supplementary Table 12G). Overall two-sided P-value=1.7e-15. Cases with bipolar disorder were excluded. The polygenic risk scores analyzed are (A) PRS for depression (DEP-PRS), (B) PRS for anxiety (ANX-PRS), (C) PRS for bipolar disorder (BP-PRS), (D) PRS for schizophrenia (SZ-PRS), (E) PRS for ADHD (ADHD-PRS), (F) PRS for autism (ASD-PRS), (G) PRS for neuroticism (Neuroticism-PRS), (H) PRS for substance use (SU-PRS), and (I) PRS for substance use disorder (SUD-PRS). See Supplementary Table S12H, S12I, Supplementary Figure S14-1 and S14-2 for sex-stratified analyses.
Extended Display Figure 5:
MvPRS analyses of depression cases with/without substance use disorder (SUD). Depression-subphenotype is shown on the x-axis (NDEPwoSUD=25620, NDEPwSUD=3538 and Nctrls=38142). The slope (β) of the linear regression (95% CI) for each depression subphenotype is shown on the y-axis. Significant difference between β for depression without/with an additional diagnosis is indicated with horizontal line with nominal two-sided P-value above, i.e. the Wald test of equal group effect (see Supplementary Table 12J). Overall two-sided P-value=6.4e-97. Cases with bipolar disorder were excluded. The polygenic risk scores analyzed are (A) PRS for depression (DEP-PRS), (B) PRS for anxiety (ANX-PRS), (C) PRS for bipolar disorder (BP-PRS), (D) PRS for schizophrenia (SZ-PRS), (E) PRS for ADHD (ADHD-PRS), (F) PRS for autism (ASD-PRS), (G) PRS for neuroticism (Neuroticism-PRS), (H) PRS for substance use (SU-PRS), and (I) PRS for substance use disorder (SUD-PRS). See Supplementary Table S12K, S12L, Supplementary Figure S14-1 and S14-2 for sex-stratified analyses.
Extended Display Figure 6:
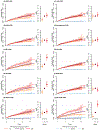
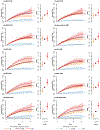
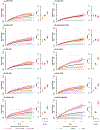
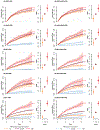
Left subpanels: Absolute risk (95%-CI) of developing anxiety since first depression episode for three groups of PRS deciles (1st, 2nd-to-9th and 10th) among 25124 depression cases with/without (NDEPwANX=3010, NDEPwoANX=221 14) anxiety. The absolute risk (95%-CI) of anxiety in light blue for the iPSYCH2015 subcohort (random population sample) excluding all depression cases, aligned to match the endpoint for the depression-cohort. Right subpanels: HRRs (95%) for 1st and 10th decile using 2nd-to-9th decile as reference (see Supplementary Table S13A) in colors matching the absolute risks curves. For deciles of (A) Depression DEP-PRS, (B) Anxiety ANX-PRS, (C) Bipolar disorder BP-PRS, (D) Schizophrenia SZ-PRS, (E) ADHD-PRS, (F) Autism ASD-PRS, (G) Neuroticism-PRS, (H) Substance Use SU-PRS, (I) Substance Use Disorder SUD-PRS and (J) sum of PRSs. The SUM-PRS was calculated by adding PRSs for multiple phenotypes weighted by log(OR) with the aim of optimizing prediction (see methods for details). See Supplementary Figure S15-1 – S15-2 and Supplementary Table S13B - S13C for sex-stratified analyses.
Extended Display Figure 7:
Left subpanels: Absolute risk (95%-CI) of transitioning into bipolar disorder since first depression episode for three groups of PRS deciles (1st, 2nd-to-9th and 10th) among 30300 depression cases with/without (NDEPwBP=1142, NDEPwoBP=29158) anxiety. The absolute risk (95%-CI) of anxiety in light blue for the iPSYCH2015 subcohort (random population sample) excluding all depression cases, aligned to match the endpoint for the depression-cohort. Right subpanels: HRRs (95%) for 1st and 10th decile using 2nd-to-9th decile as reference (see Supplementary Table S14A) in colors matching the absolute risks curves. For deciles of (A) Depression DEP-PRS, (B) Anxiety ANX-PRS, (C) Bipolar disorder BP-PRS, (D) Schizophrenia SZ-PRS, (E) ADHD-PRS, (F) Autism ASD-PRS, (G) Neuroticism-PRS, (H) Substance Use SU-PRS, (I) Substance Use Disorder SUD-PRS and (J) sum of PRSs. The SUM-PRS was calculated by adding PRSs for multiple phenotypes weighted by log(OR) with the aim of optimizing prediction (see methods for details). See Supplementary Figure S16-1 – S16-2 Supplementary Tables S14B – S14C for sex-stratified analyses.
Extended Display Figure 8:
Left subpanels: Absolute risk (95%-CI) of developing schizophrenia since first depression episode for three groups of PRS deciles (1st, 2nd-to-9th and 10th) among 28714 depression cases with/without (NDEPwSZ=1606, NDEPwoSZ=27108) anxiety. The absolute risk (95%-CI) of anxiety in light blue for the iPSYCH2015 subcohort (random population sample) excluding all depression cases, aligned to match the endpoint for the depression-cohort. Right subpanels: HRRs (95%) for 1st and 10th decile using 2nd-to- 9th decile as reference (see Supplementary Table S15A) in colors matching the absolute risks curves. For deciles of (A) Depression DEP-PRS, (B) Anxiety ANX-PRS, (C) Bipolar disorder BP-PRS, (D) Schizophrenia SZ-PRS, (E) ADHD-PRS, (F) Autism ASD-PRS, (G) Neuroticism-PRS, (H) Substance Use SU-PRS, (I) Substance Use Disorder SUD-PRS and (J) sum of PRSs. The SUM-PRS was calculated by adding PRSs for multiple phenotypes weighted by log(OR) with the aim of optimizing prediction (see methods for details). See Supplementary Figure S17-1 – S17-2 and Supplementary Tables S15B – S15C for sex-stratified analyses.
Extended Display Figure 9:
Left subpanels: Absolute risk (95%-CI) of developing SUD since first depression episode for three groups of PRS deciles (1st, 2nd-to-9th and 10th) among 27249 depression cases with/without (NDEPwSUD=1629, NDEPwoSUD=25620) anxiety. The absolute risk (95%-CI) of anxiety in light blue for the iPSYCH2015 subcohort (random population sample) excluding all depression cases, aligned to match the endpoint for the depression-cohort. Right subpanels: HRRs (95%) for 1st and 10th decile using 2nd-to-9th decile as reference (see Supplementary Table S16A) in colors matching the absolute risks curves. For deciles of (A) Depression DEP-PRS, (B) Anxiety ANX-PRS, (C) Bipolar disorder BP-PRS, (D) Schizophrenia SZ-PRS, (E) ADHD-PRS, (F) Autism ASD-PRS, (G) Neuroticism-PRS, (H) Substance Use SU-PRS, (I) Substance Use Disorder SUD-PRS and (J) sum of PRSs. The SUM-PRS was calculated by adding PRSs for multiple phenotypes weighted by log(OR) with the aim of optimizing prediction (see methods for details). See Supplementary Figure S18-1 – S18-2 and Supplementary Tables S16B – S16C for sex-stratified analyses.
Figure 1:
Figure 1:
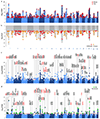
The x-axes show genomic position, and the y-axes shows statistical significance as −log10(P). (A) Manhattan plot of the primary meta-analysis (371184 cases and 978703 controls) using an inverse variance-weighted fixed-effects model, the y-axis shows statistical significance as −log10(P) of z statistics (two-sided nominal P-values). The red horizontal line represents the threshold for genome-wide significant association (P=5×10⁻⁸), QQ-plot in Supplementary figure S5. Data on chromosome X were only available for iPSYCH and FinnGen, see Supplementary Figure S2). (B) Manhattan plot of the primary meta-analysis from A, the y-axis shows −log10(P) of z statistics (two-sided nominal P-values), with highlighted joint p-values from GCTA-COJO plotted on top. The red horizontal line represents the threshold for genome-wide significant association (P=5×10⁻⁸). (C) Gene-based analysis: y-axis shows −log10(P) of F statistics (two-sided nominal P-values) implemented in MAGMA. A red line indicates Bonferroni corrected genome-wide significance; P<2.8×10⁻⁶ (testing 17,840 protein coding genes). A total 411 significant genes of which 268 were in 93 of the 243 genomic risk loci (Supplementary Table S6). The most significant gene, overlapping with a top gene in the TWAS D, within each of the 93 genomic loci are highlighted. (D) TWAS: The y-axis shows significance as −log10(P) of association z statistics (Wald test; two-sided P-values). Genes are represented by both gene and isoform expression. A red line indicates Bonferroni corrected genome-wide significance; P<1.44×10⁻⁶ (34,646 tests for all reliably imputed genes and isoforms). The top transcript is labelled and the corresponding −log10(P) is highlighted for each independent linkage disequilibrium block.
Figure 2:
Figure 2:
Venn diagrams showing MiXeR results of the estimated number of variants shared between depression (N=1349887) and psychiatric disorders (anxiety (N= 361365), bipolar disorder (N= 405771), schizophrenia (N=153808), ADHD (N=225534), autism (N=46350, SUD (N=46568), neuroticism (N=380506)) and genetically correlated phenotypes (smoking initiation (N=632803), educational attainment (N=3037499)) and other phenotypes (height (N=1597374), Alzheimer’s (N=788989), epilepsy (N=44889)) not expected to show high genetic correlation with depression. Circles represent loci unique to depression and unique to the phenotype of interest and corresponding overlapping shared loci. The number of shared variants +/− SE are shown in thousands. The size of the circles reflects the polygenicity of each phenotype, with larger circles corresponding to greater polygenicity. Point estimates of genetic correlation (rg) and 95% CI between depression and each phenotype is shown at the bottom with an accompanying scale (−1 to +1) (see also Supplementary Table S6A and Figure S9-1).
Figure 3:
Figure 3:
(A) Significant cell types across datasets in MAGMA analysis implemented in FUMA. The y-axis shows −log10 of one-sided nominal P-values based on z statistics for cell- types significant across datasets (x-axis), i.e. after experiment wide Bonferroni correction. The primary depression GWAS (Ncases=371184 and Nctrls=978703) was used as input for this analysis. (B) Enrichment of depression risk variants with cell-specific open chromatin regions. Dots represents the LD score coefficients and horizontal bars reflect standard error (x-axis) for various cell-types (y-axis). A positive LD score coefficient signifies enrichment in heritability. Dot size reflects two-sided P-value of LD score z statistics, and color code indicate test-wide significance (BH-corrected P-value<0.05). The primary depression GWAS (Ncases = 371184 and Nctrls = 978703) was used as input for this analysis.
Figure 4:
Figure 4:
Association of DEP-PRS (broadly and narrowly defined) with measures of cognitive abilities in the PNC cohort (N=4,973). Regression coefficients (β) and 95% confidence interval) from linear regression testing for the association of DEP-PRS with the 15 neurocognitive measures listed on the y-axis. Significance is based on two-sided FDR adjusted P-values from linear regression t statistics. Colors indicate FDR-adjusted (to account for 30 total tests) P-value intervals (See supplementary table S12 for details) and ** corresponds to FDR-adjusted P-value (q-value) <0.01, * corresponds to 0.01<=q-value<0.05. The primary DEP-PRS was significantly associated with Abstraction and mental flexibility (q-value=0.03). The narrow DEP-PRS was significantly associated with Verbal reasoning (q-value=0.009), Attention (q-value=0.011) and Abstraction and mental flexibility (q-value=0.012). The neurocognitive phenotypes included performance on the Computerized Neurocognitive Battery (CNB: age differentiation, emotion identification, facial memory, sensorimotor processing, finger tapping speed, emotion differentiation, spatial reasoning, verbal memory, nonverbal reasoning, working memory, verbal reasoning, spatial memory, attention, abstraction and mental flexibility), as well as results from the Wide Range Achievement Test (WRAT-4).
Figure 5:
Figure 5:
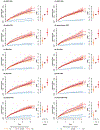
Absolute risk (95% CI) over time since first depression episode and HRR (95% CI) of (A,B) a second episode of depression stratified by three groups of DEP-PRS and DEP-SUM-PRS deciles (N=29158); (C,D) developing anxiety stratified by ANX-PRS and ANX-SUM-PRS (N=25124); (E,F) transitioning into bipolar disorder stratified by BP-PRS and BP- SUM-PRS (N=30300); (G,H) developing schizophrenia stratified by SZ-PRS and SZ-SUM-PRS (N=28714); (I,J) developing substance-use-disorder stratified by SU-PRS and SUD- SUM-PRS (N=18856). SUM-PRSs were calculated by adding PRSs for multiple phenotypes weighted by log(OR) aiming to optimize prediction. HRR (95% CI) for 1st, 2nd-to-9th and 10th decile are shown as large dots in different colors, using the middle (80% prediction interval) of the PRS as reference. Absolute risk (95% CI) of anxiety (C,D), bipolar disorder (E,F), schizophrenia (G,H) and SUD (I,J) is shown for the iPSYCH2015 random population (sub-cohort) in less bright colors.

Comment in

References

    1. Kessler RC & Bromet EJ The epidemiology of depression across cultures. Annual review of public health 34, 119–138 (2013). 10.1146/annurev-publhealth-031912-114409 - DOI - PMC - PubMed
    1. Hasin DS et al. Epidemiology of Adult DSM-5 Major Depressive Disorder and Its Specifiers in the United States. JAMA psychiatry 75, 336–346 (2018). 10.1001/iamapsvchiatry.2017.4602 - DOI - PMC - PubMed
    1. Pedersen CB et al. A comprehensive nationwide study of the incidence rate and lifetime risk for treated mental disorders. JAMA psychiatry 71, 573–581 (2014). 10.1001/iamapsvchiatrv.2014.16 - DOI - PubMed
    1. Lopez AD, Mathers CD, Ezzati M, Jamison DT & Murray CJ Global and regional burden of disease and risk factors, 2001: systematic analysis of population health data. Lancet 367, 1747–1757 (2006). 10.1016/S0140-6736(06)68770-9 - DOI - PubMed
    1. Wittchen HU et al. The size and burden of mental disorders and other disorders of the brain in Europe 2010. European neuropsychopharmacology : the journal of the European College of Neuropsychopharmacology 21, 655–679 (2011). 10.1016/i.euroneuro.2011.07.018 - DOI - PubMed

Publication types

MeSH terms