. 2023 Jul;29(7):1845-1856.
doi: 10.1038/s41591-023-02425-1. Epub 2023 Jul 18.

Disease risk and healthcare utilization among ancestrally diverse groups in the Los Angeles region

Affiliations

Disease risk and healthcare utilization among ancestrally diverse groups in the Los Angeles region

Christa Caggiano et al. Nat Med. 2023 Jul.

Abstract

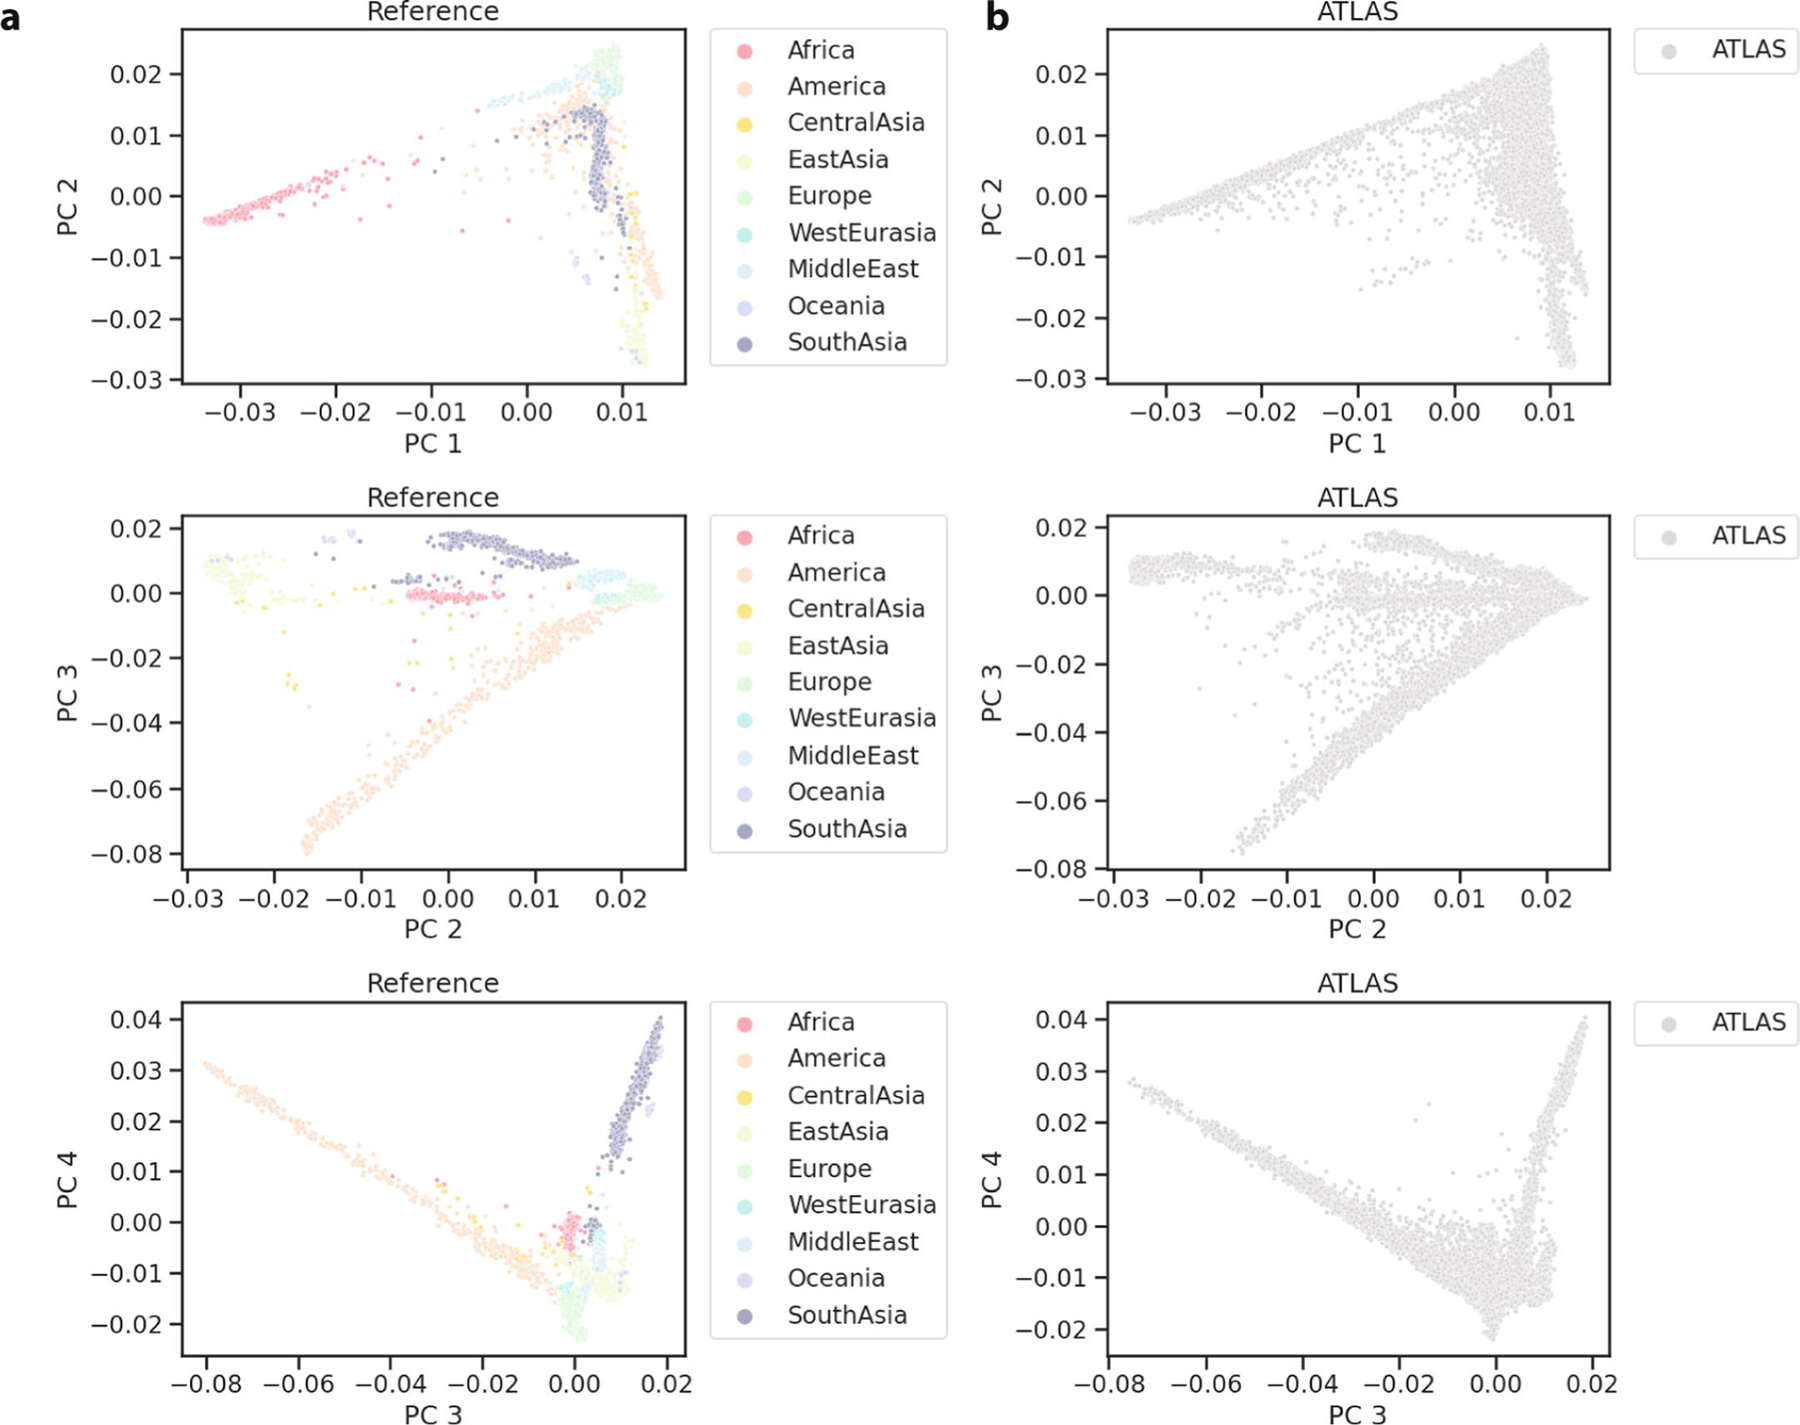
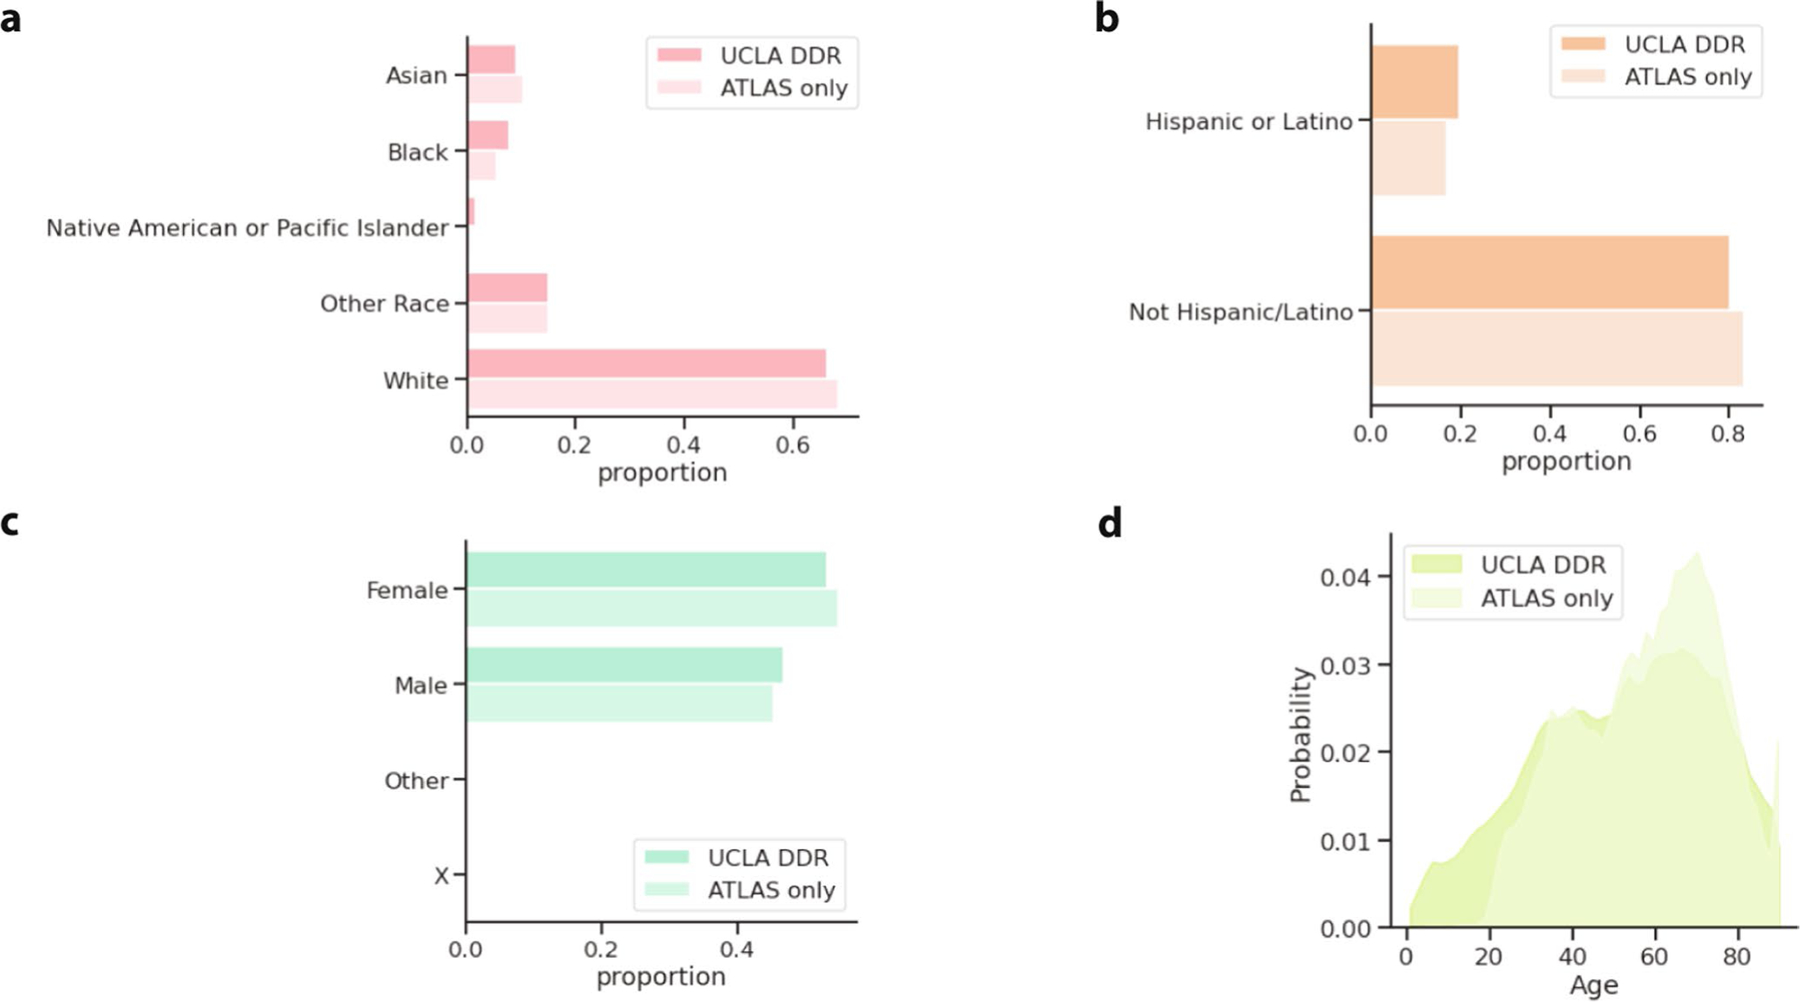
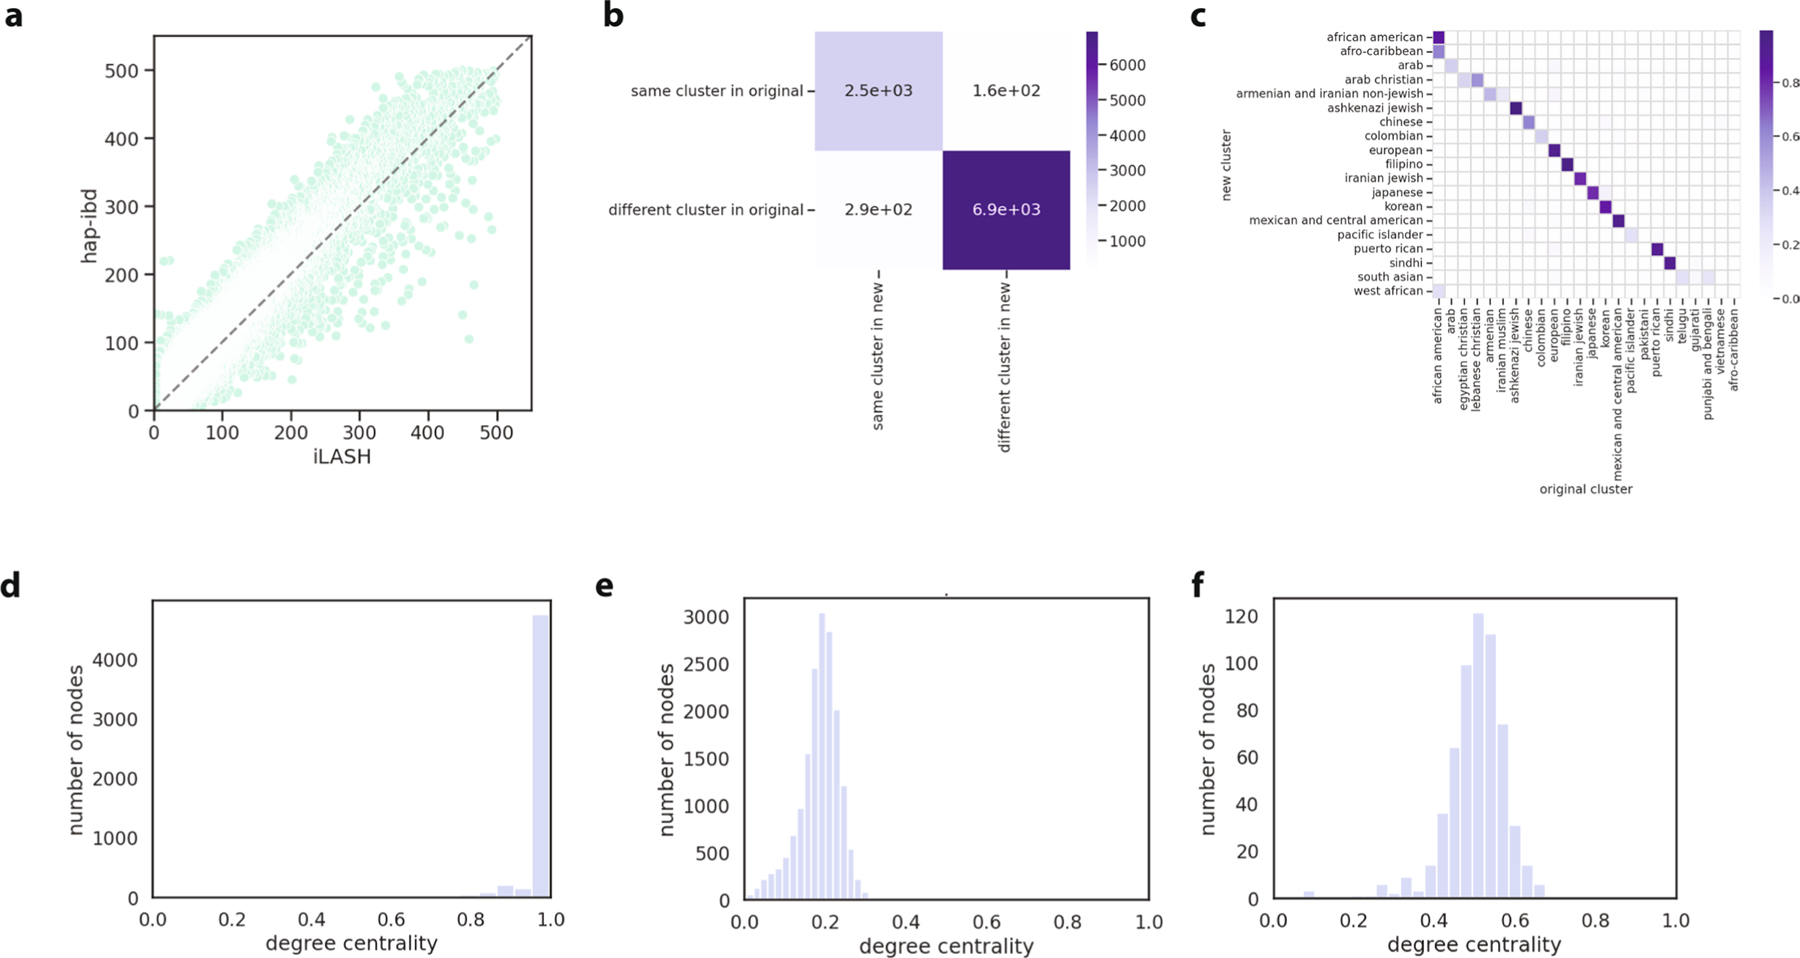
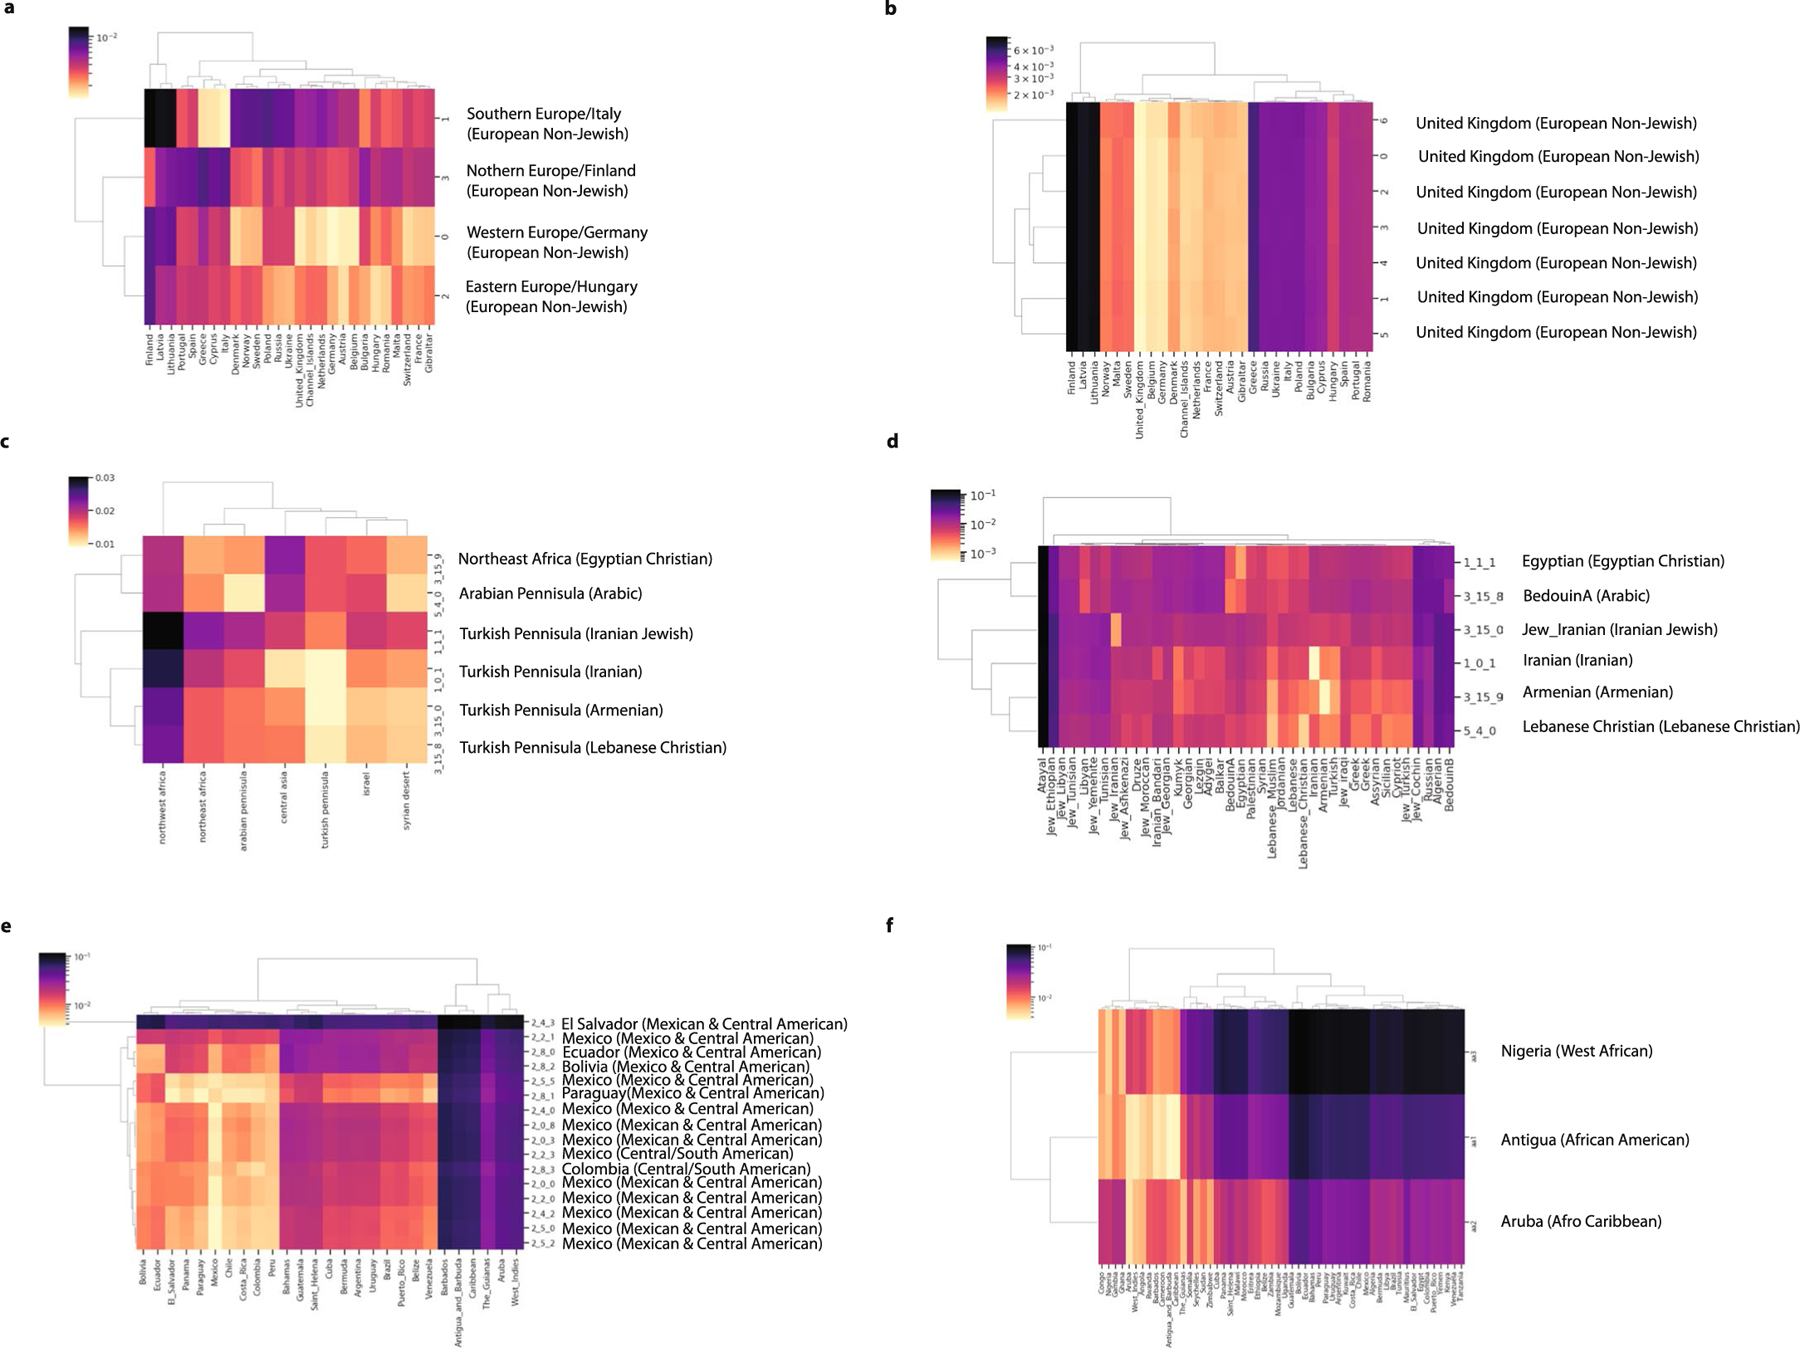
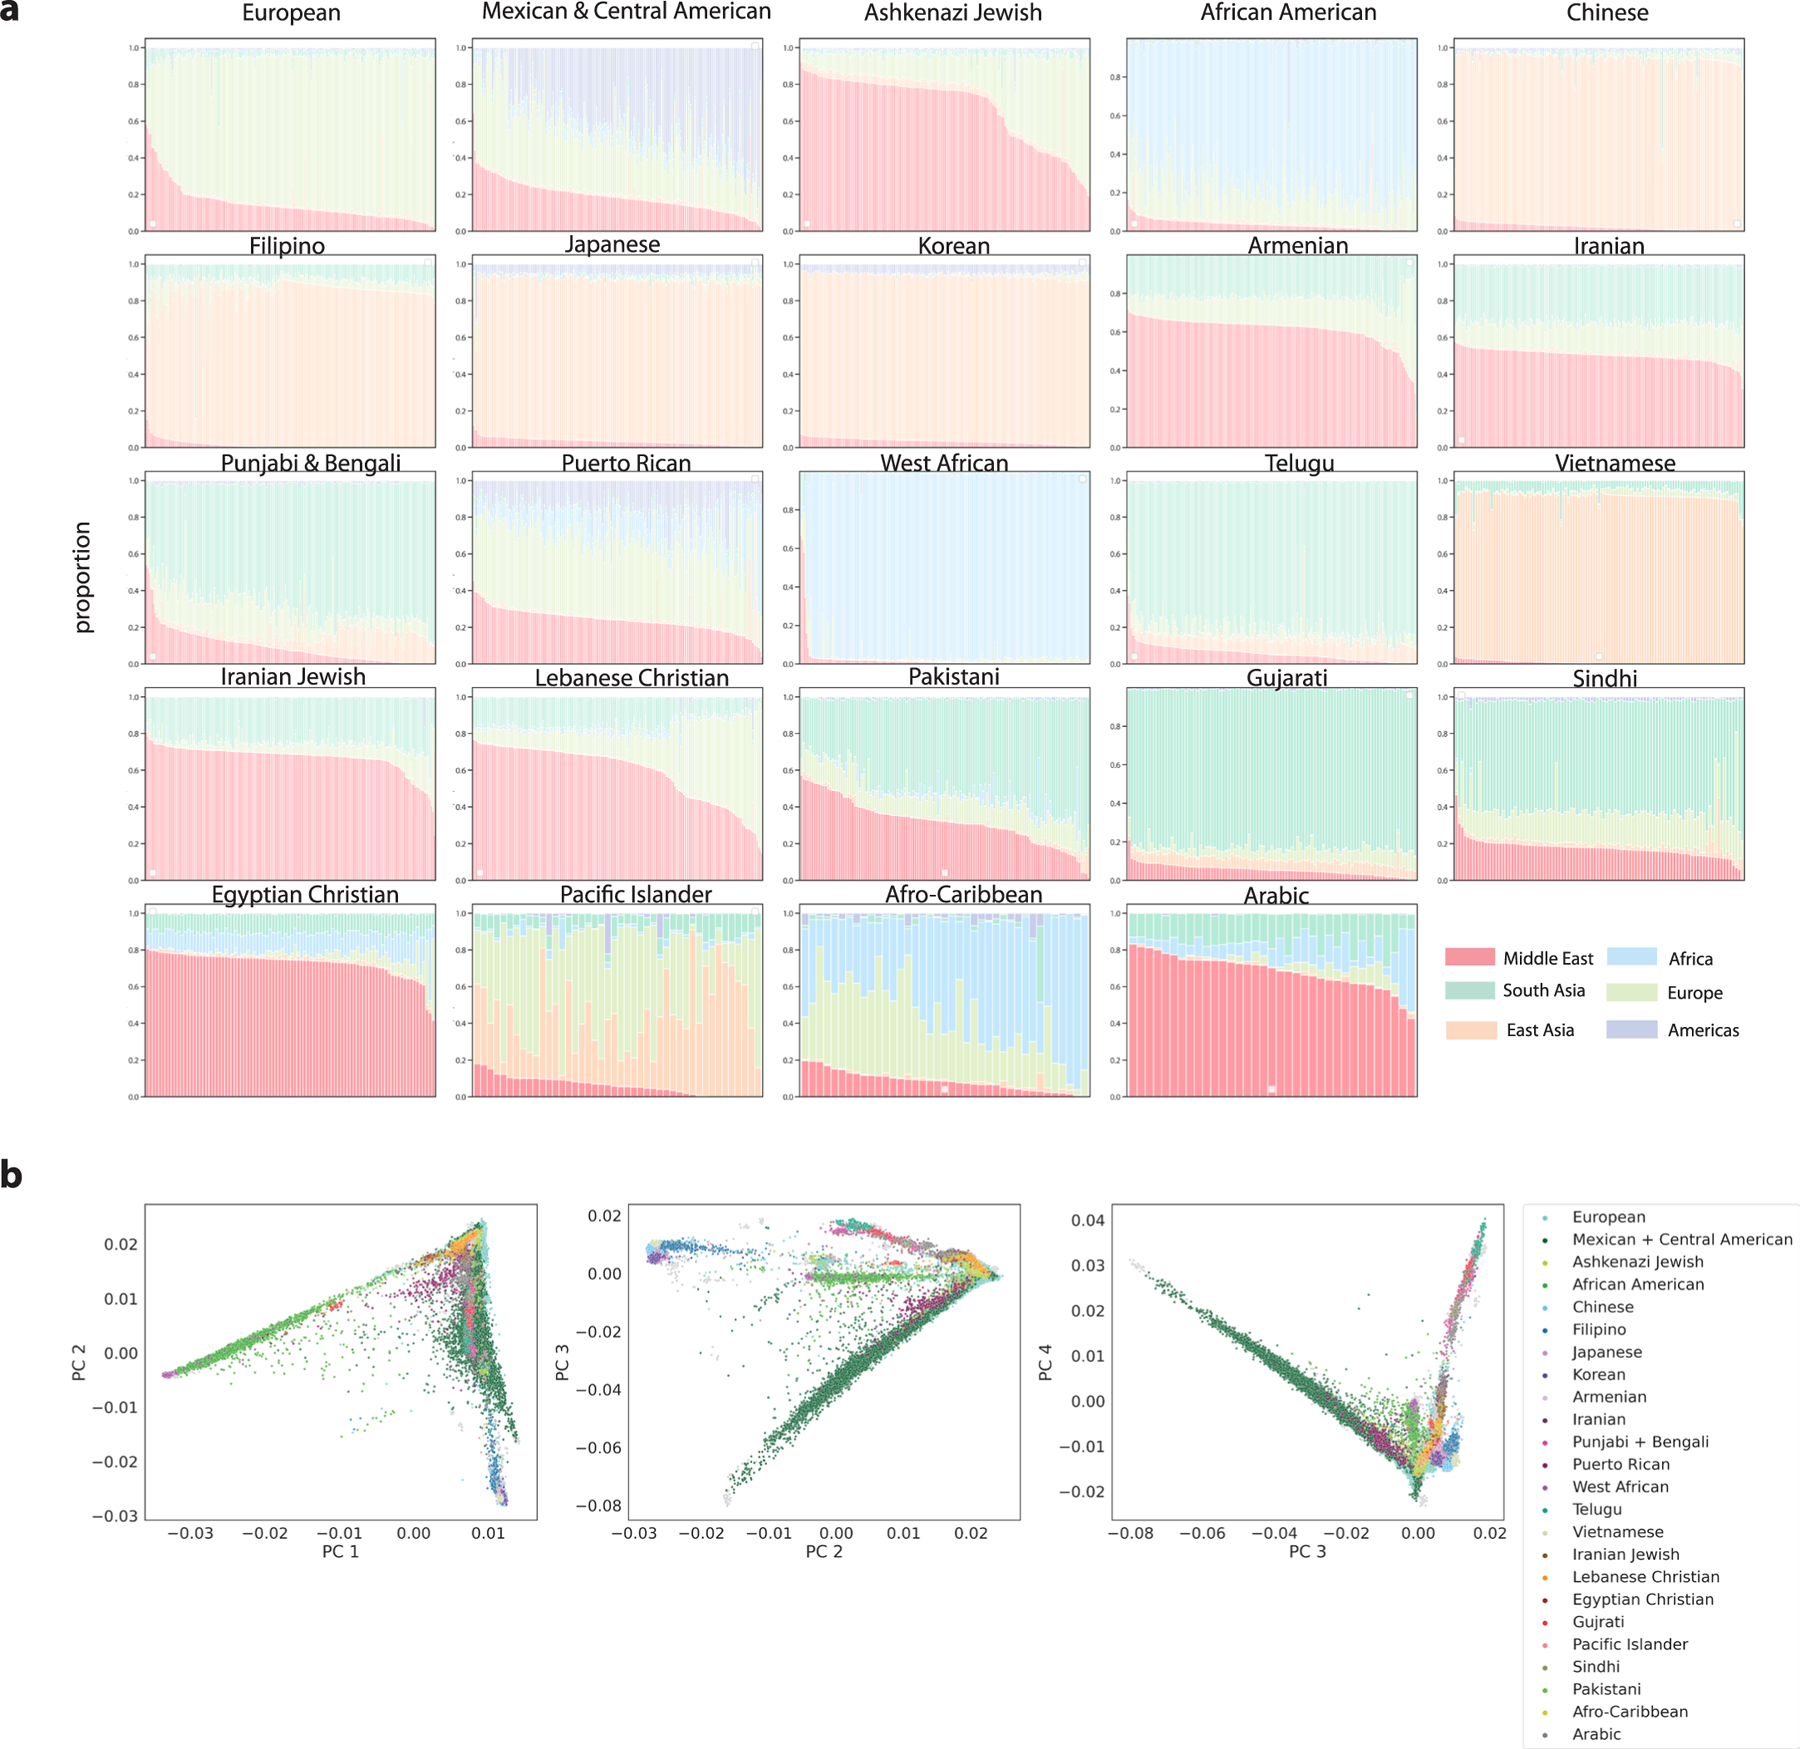
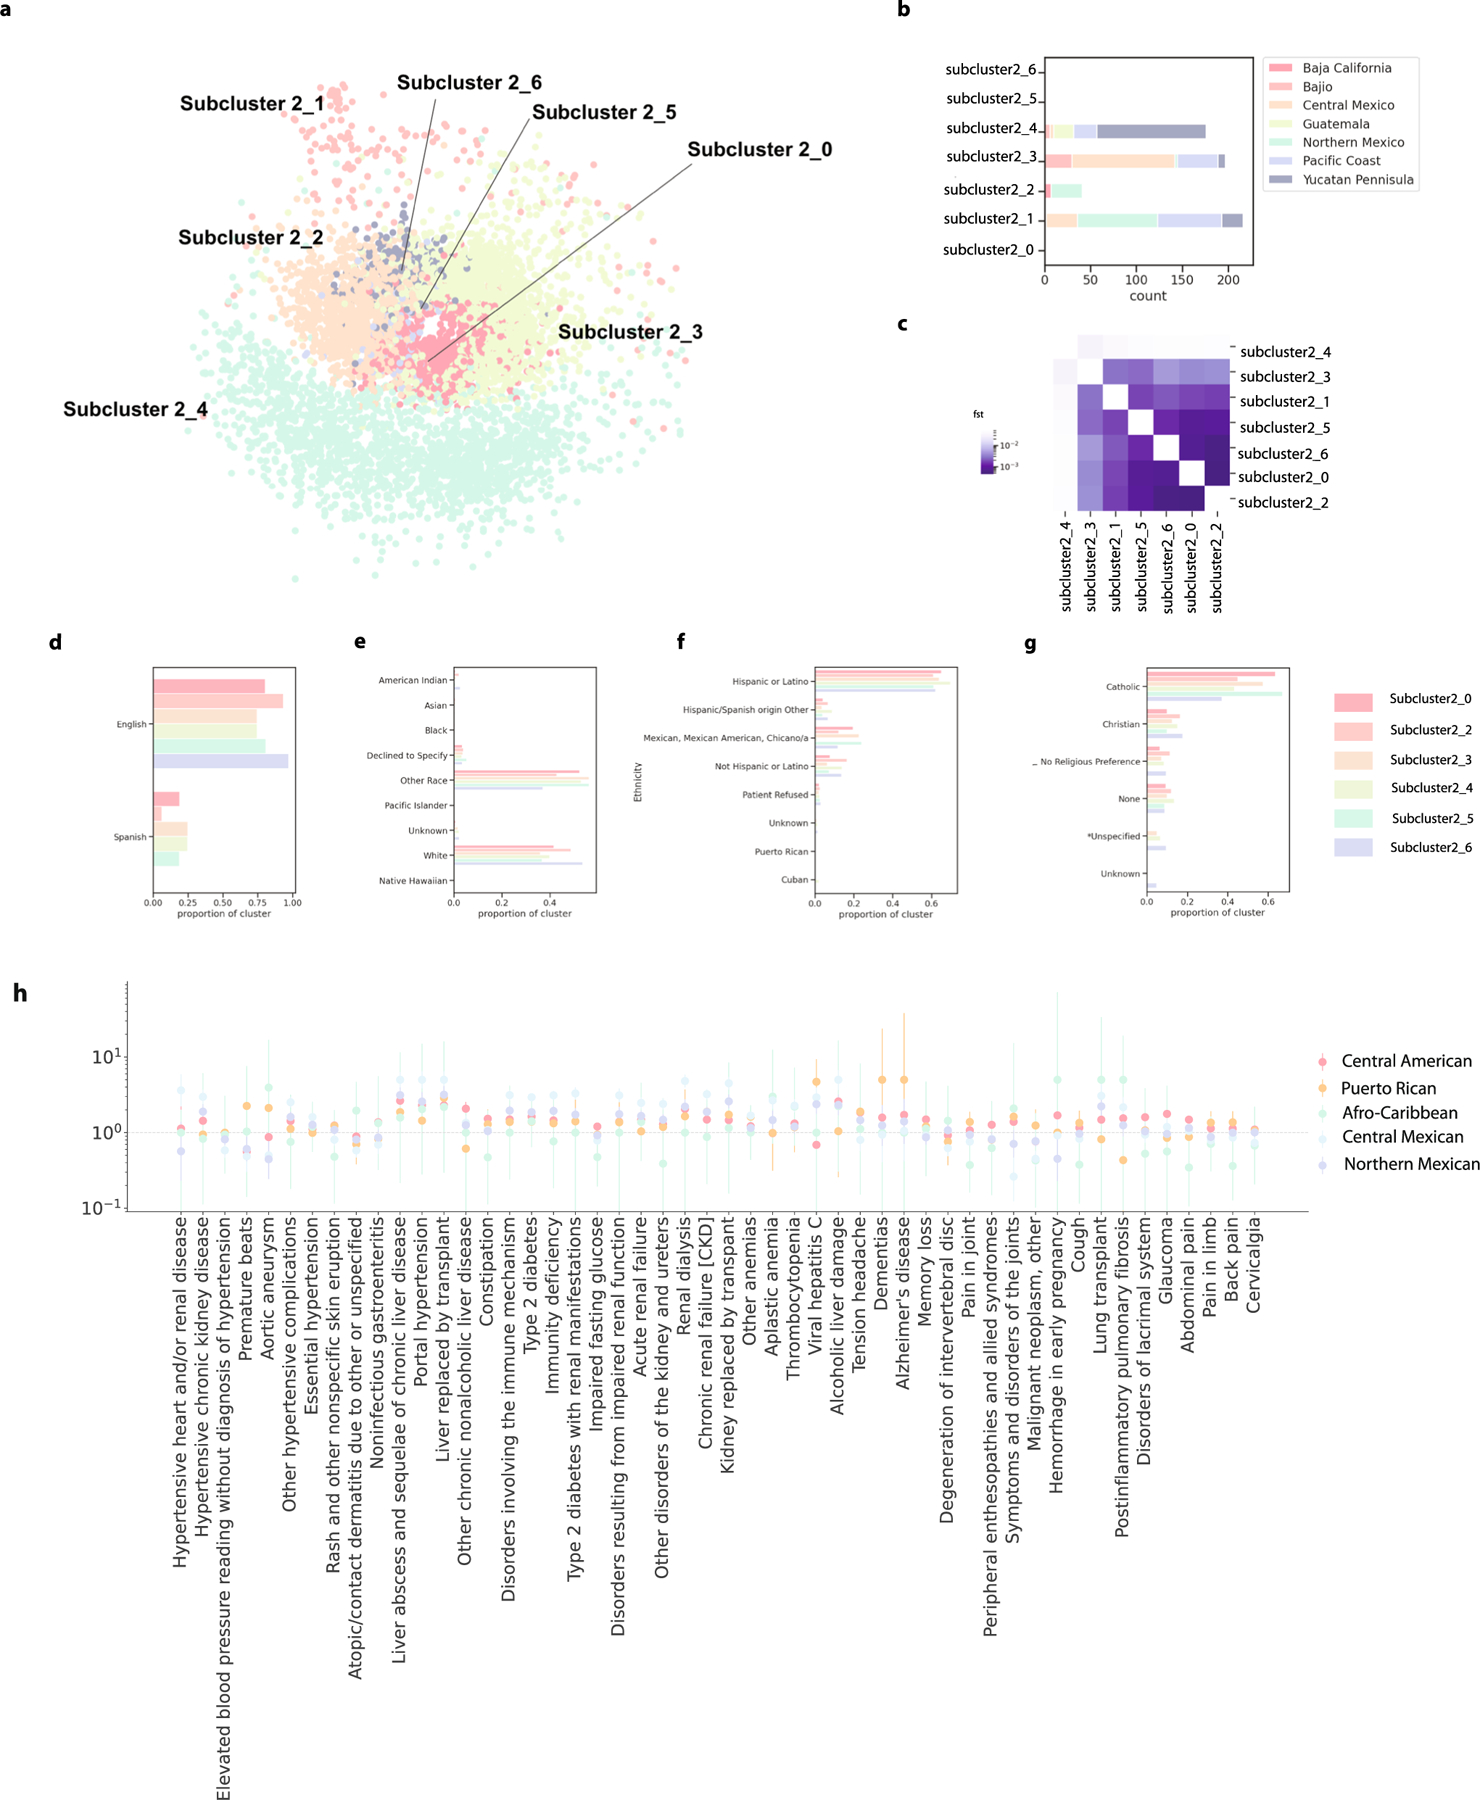
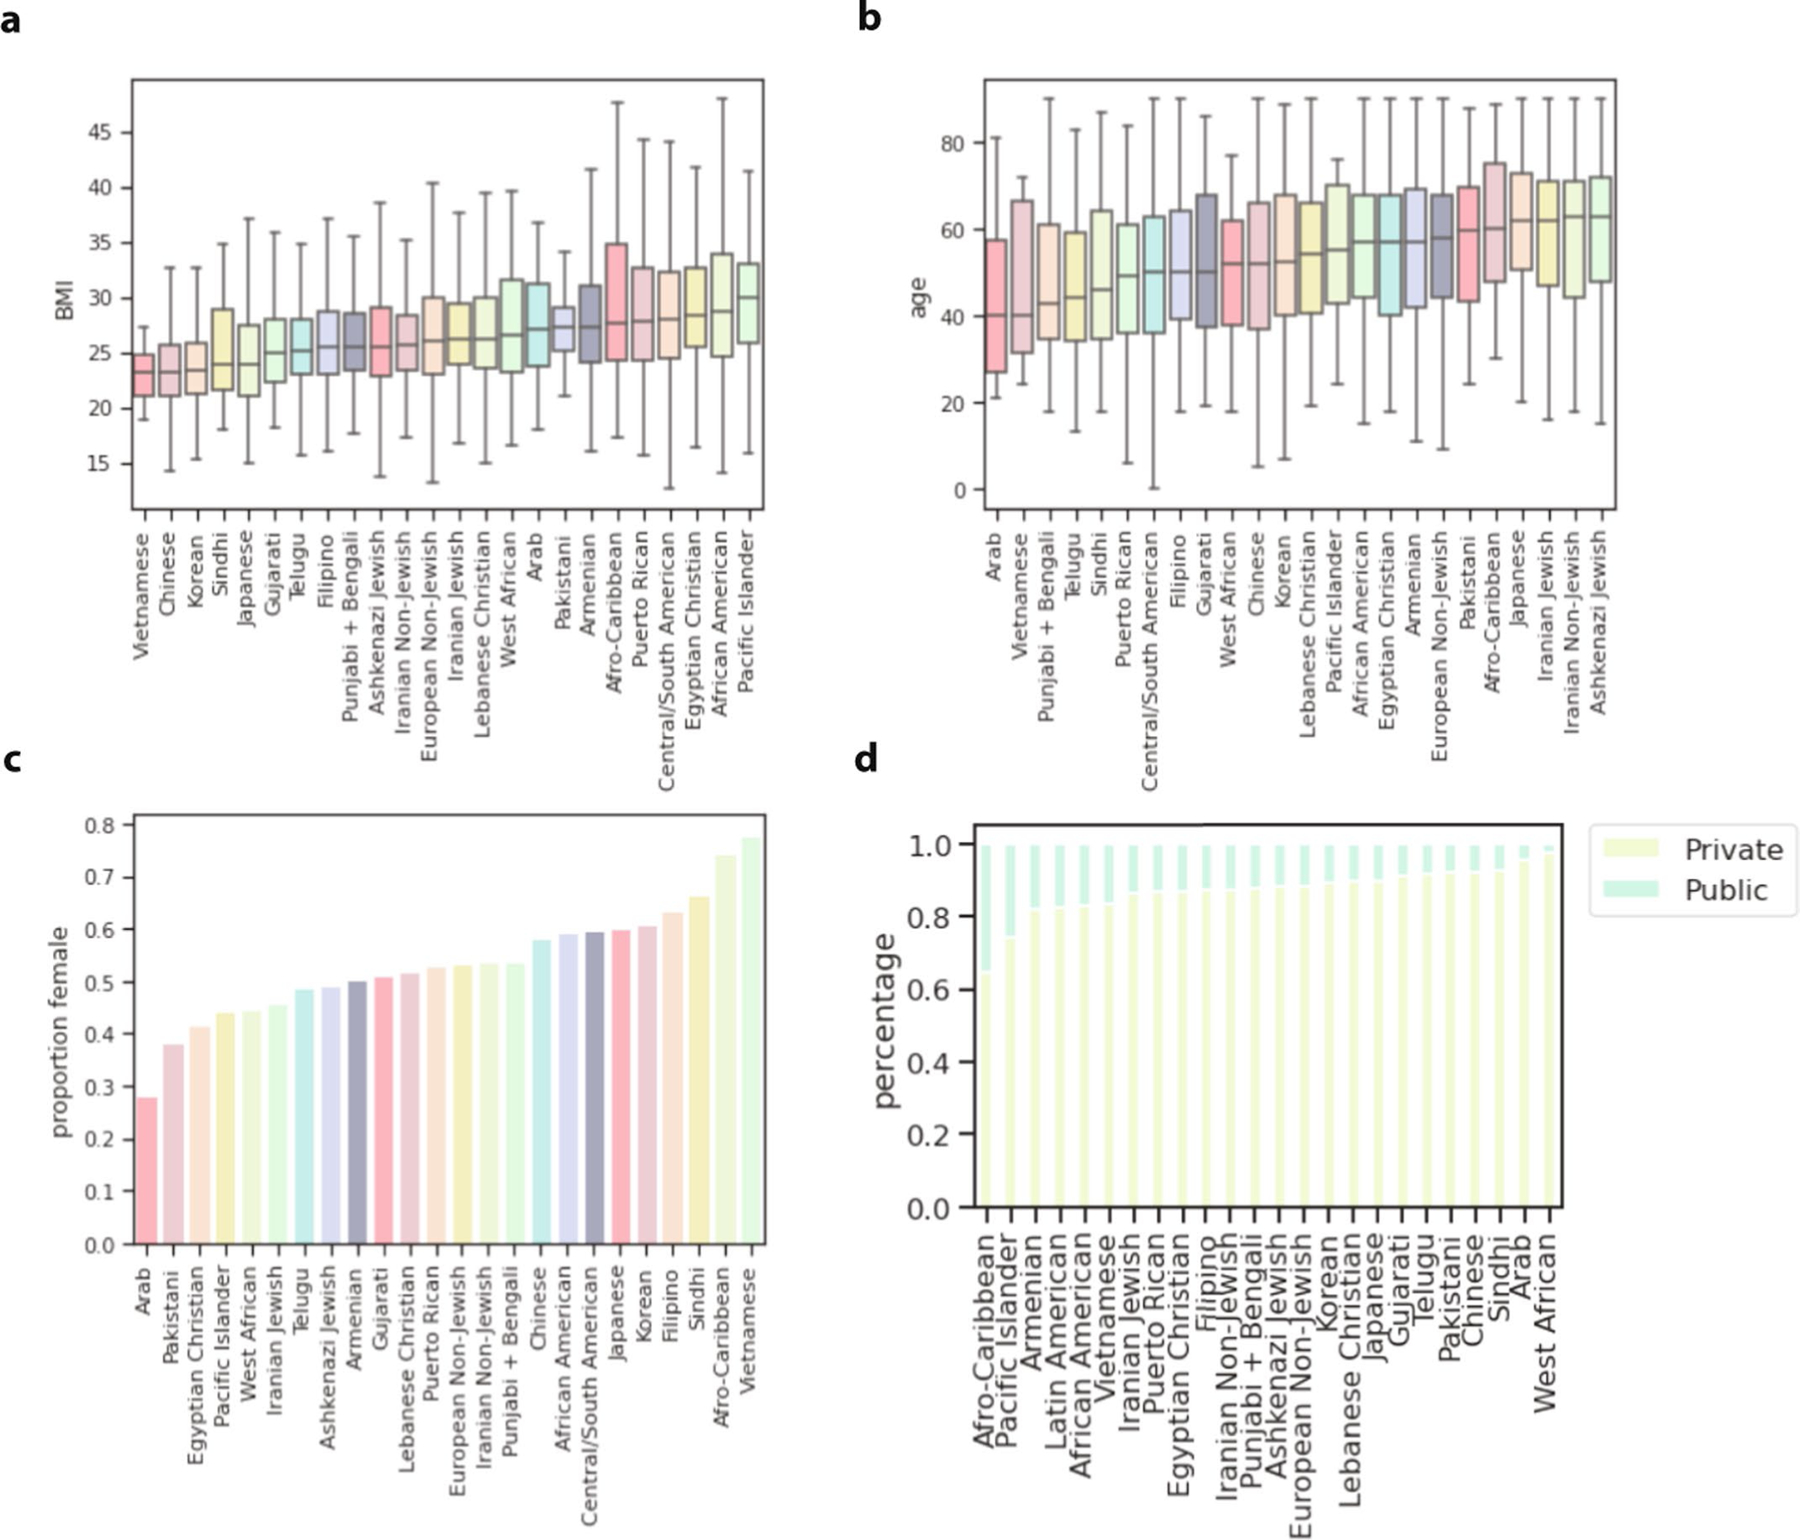
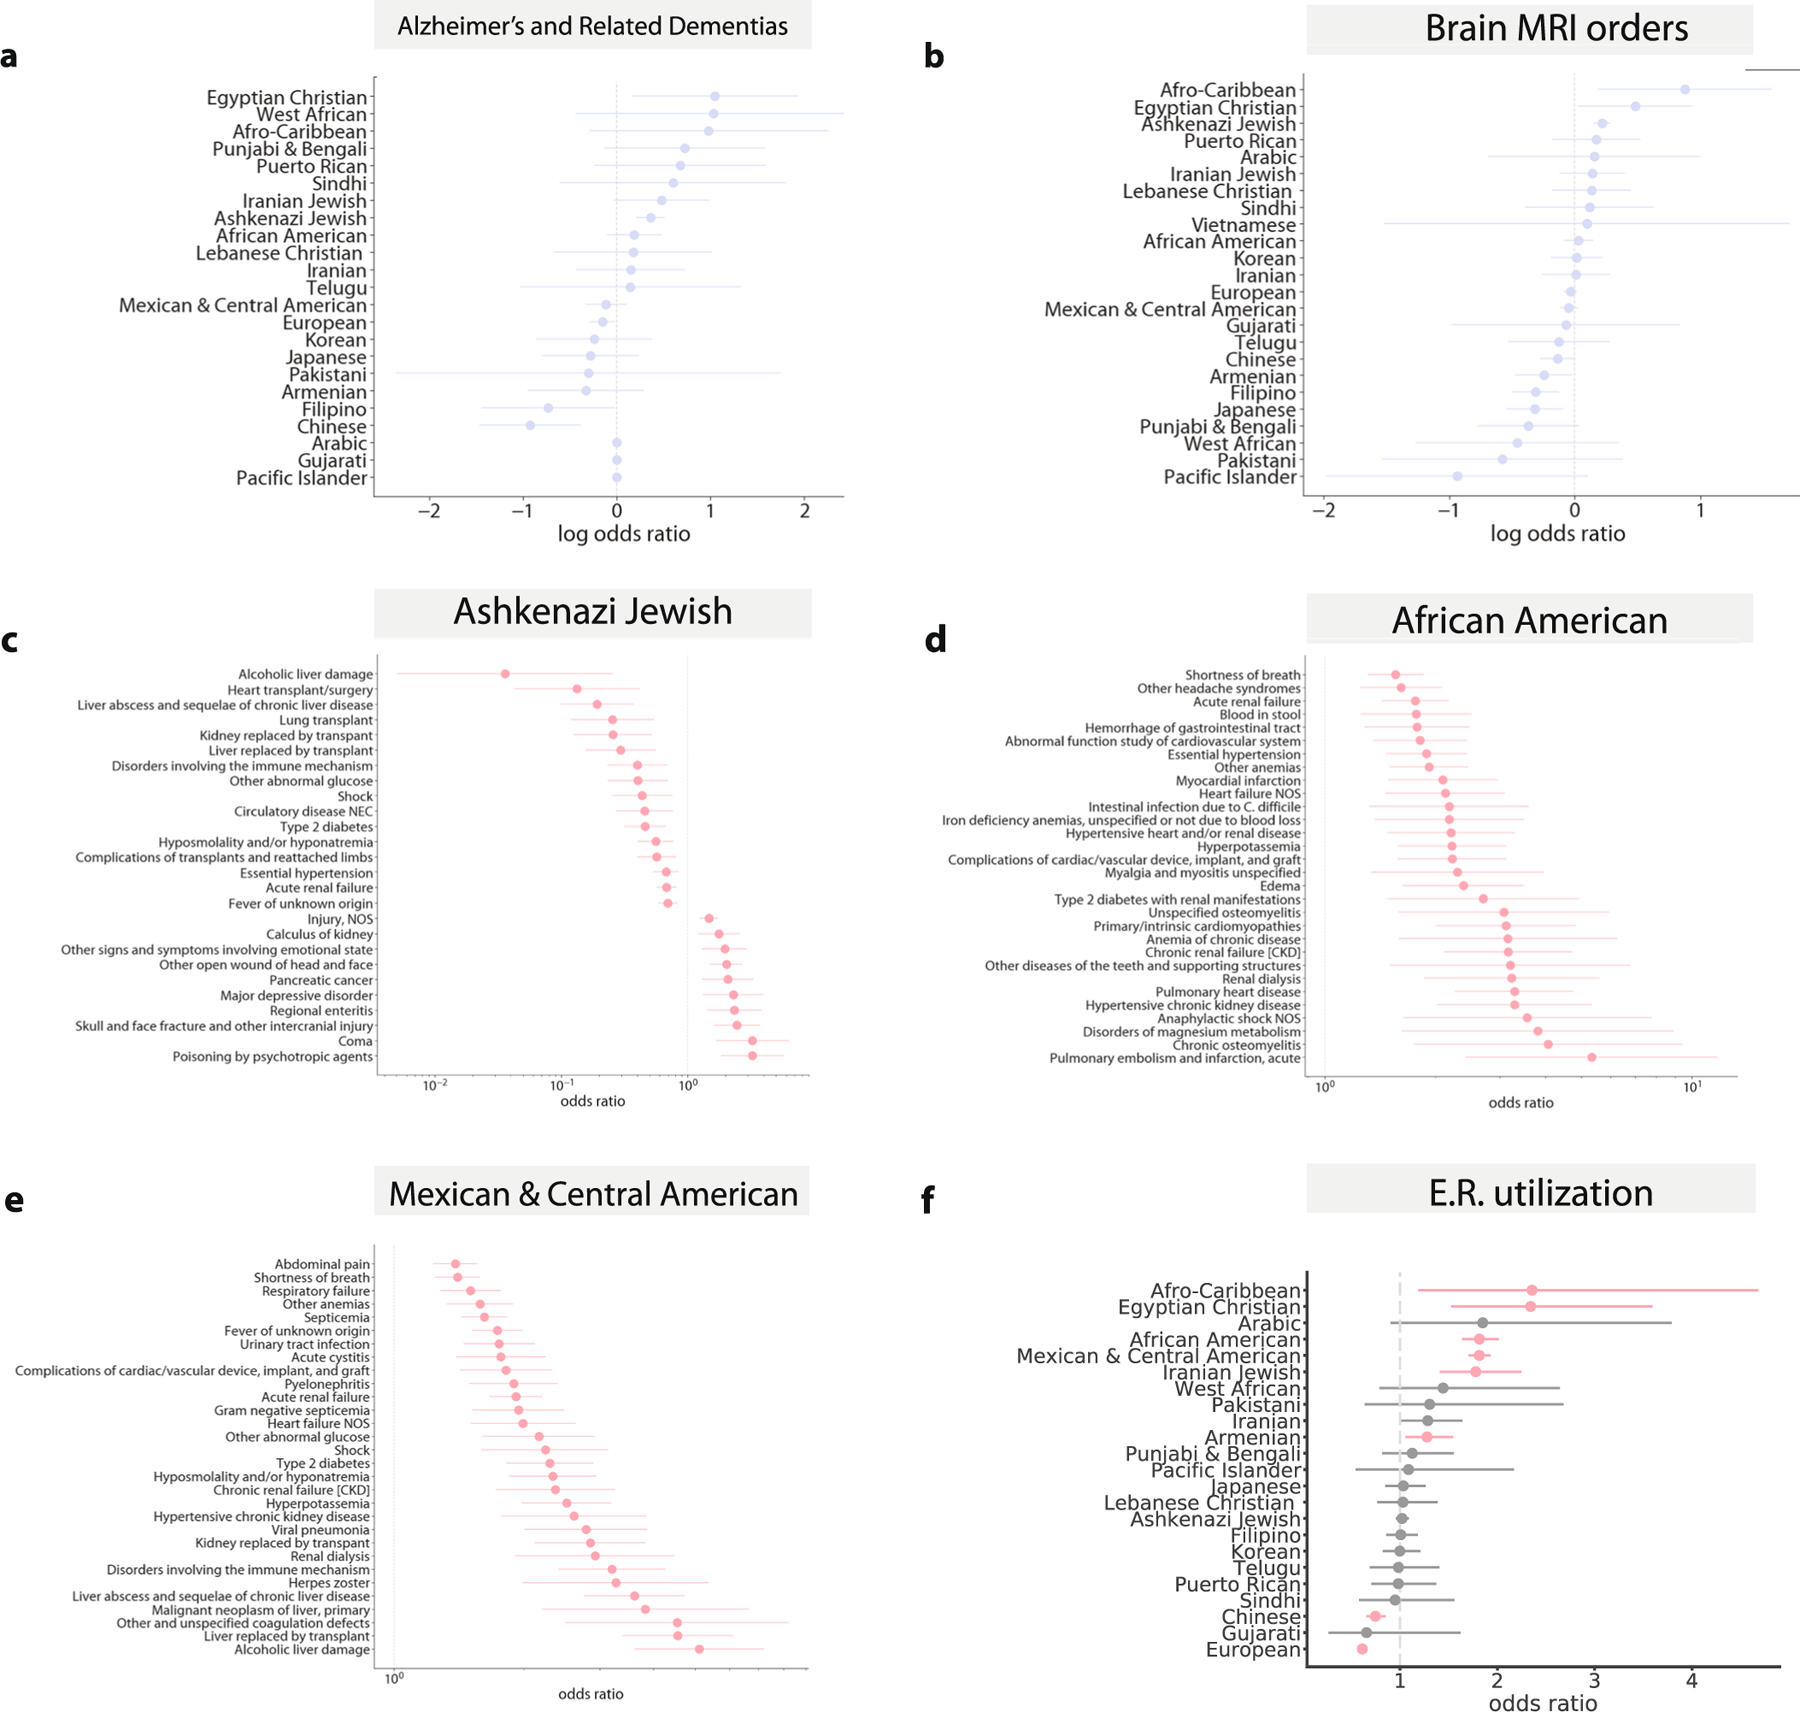
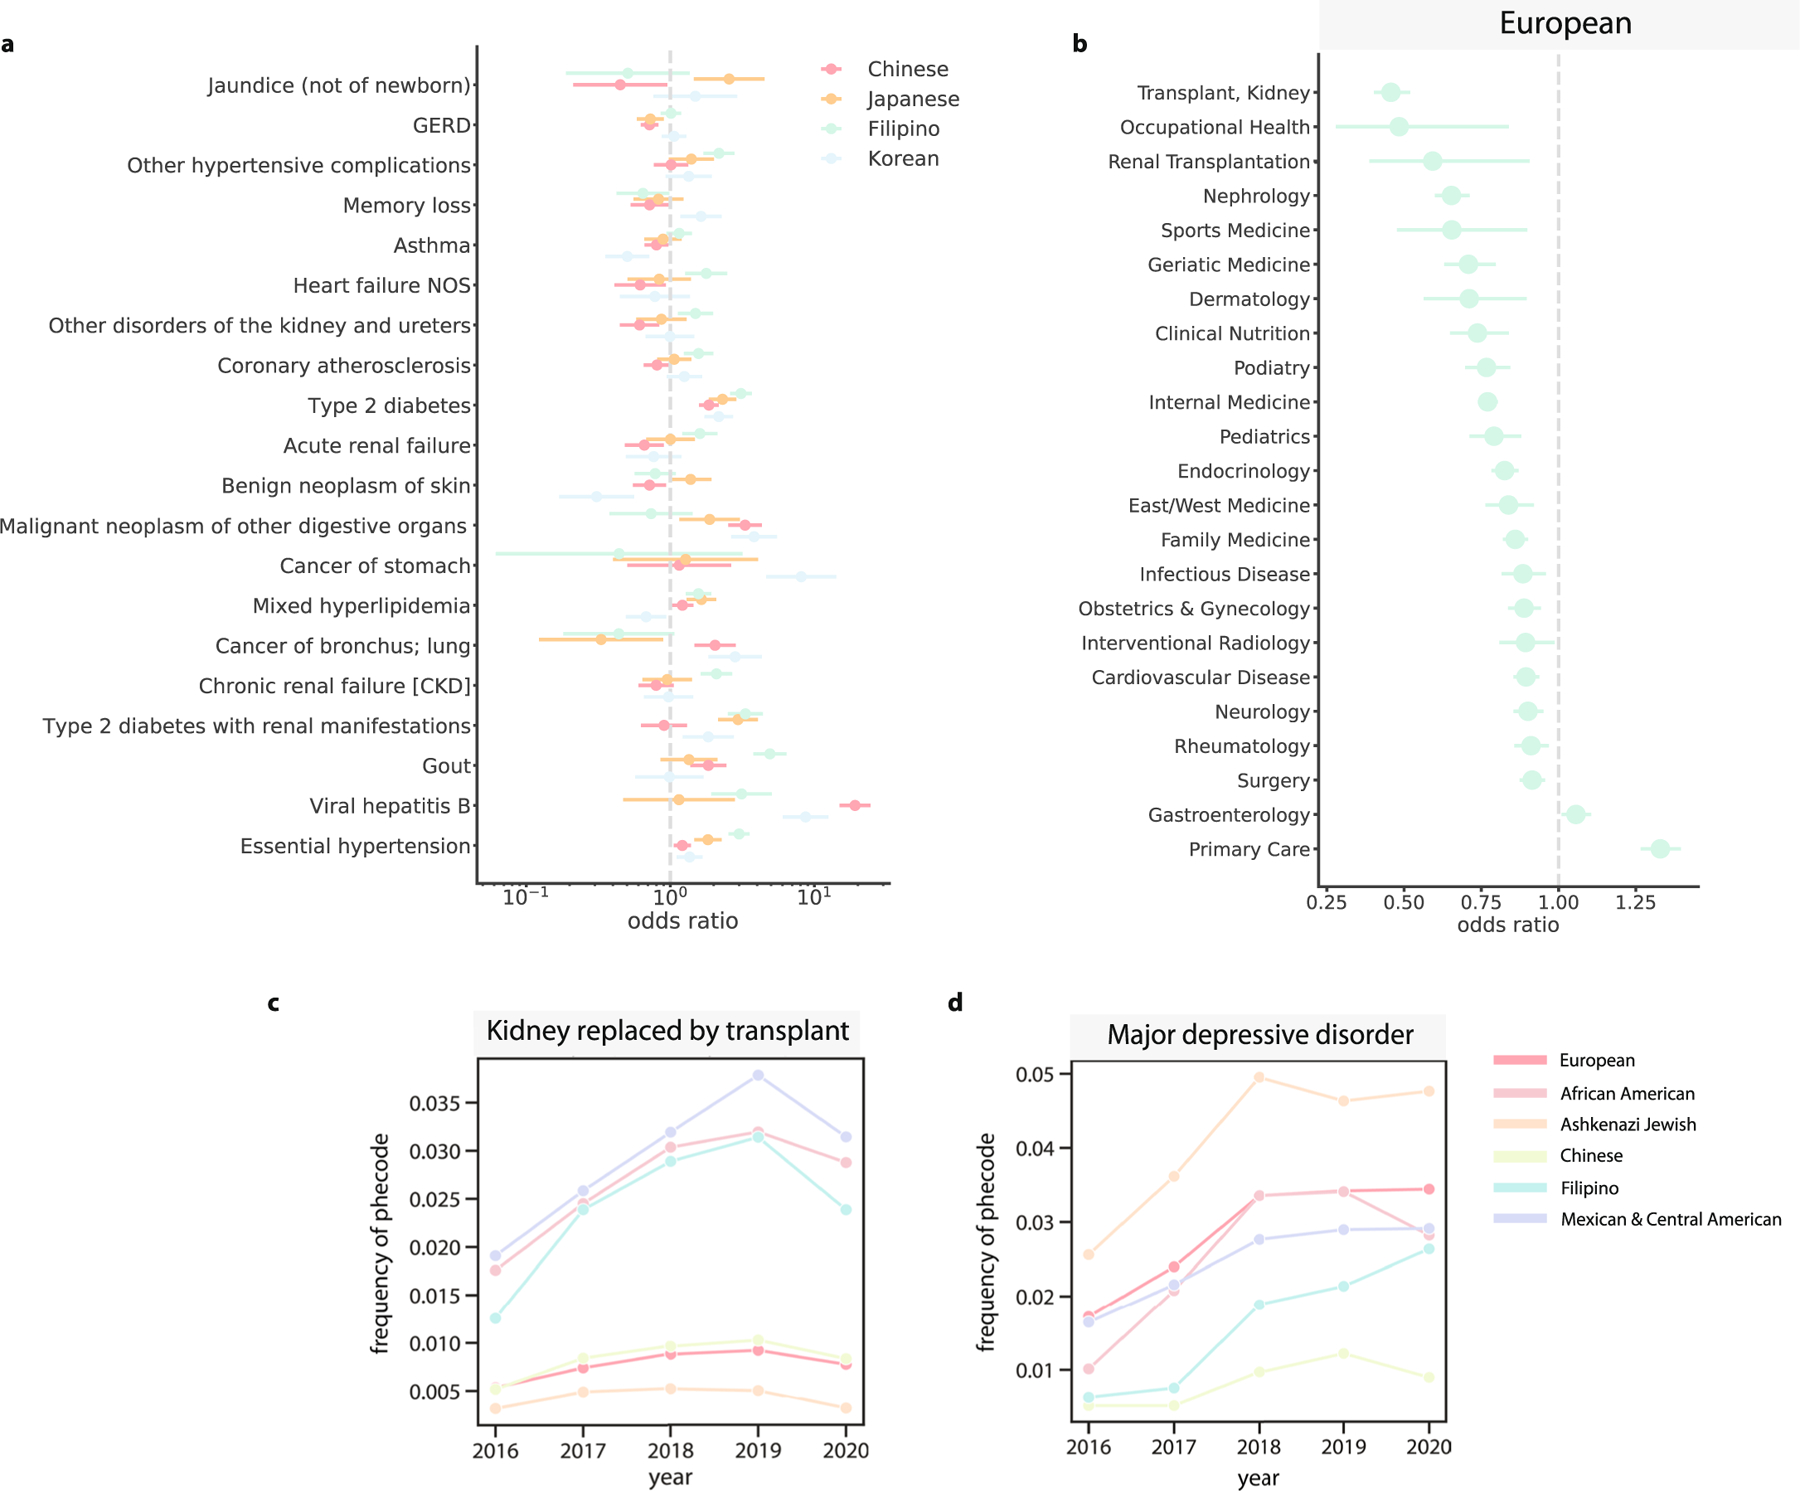
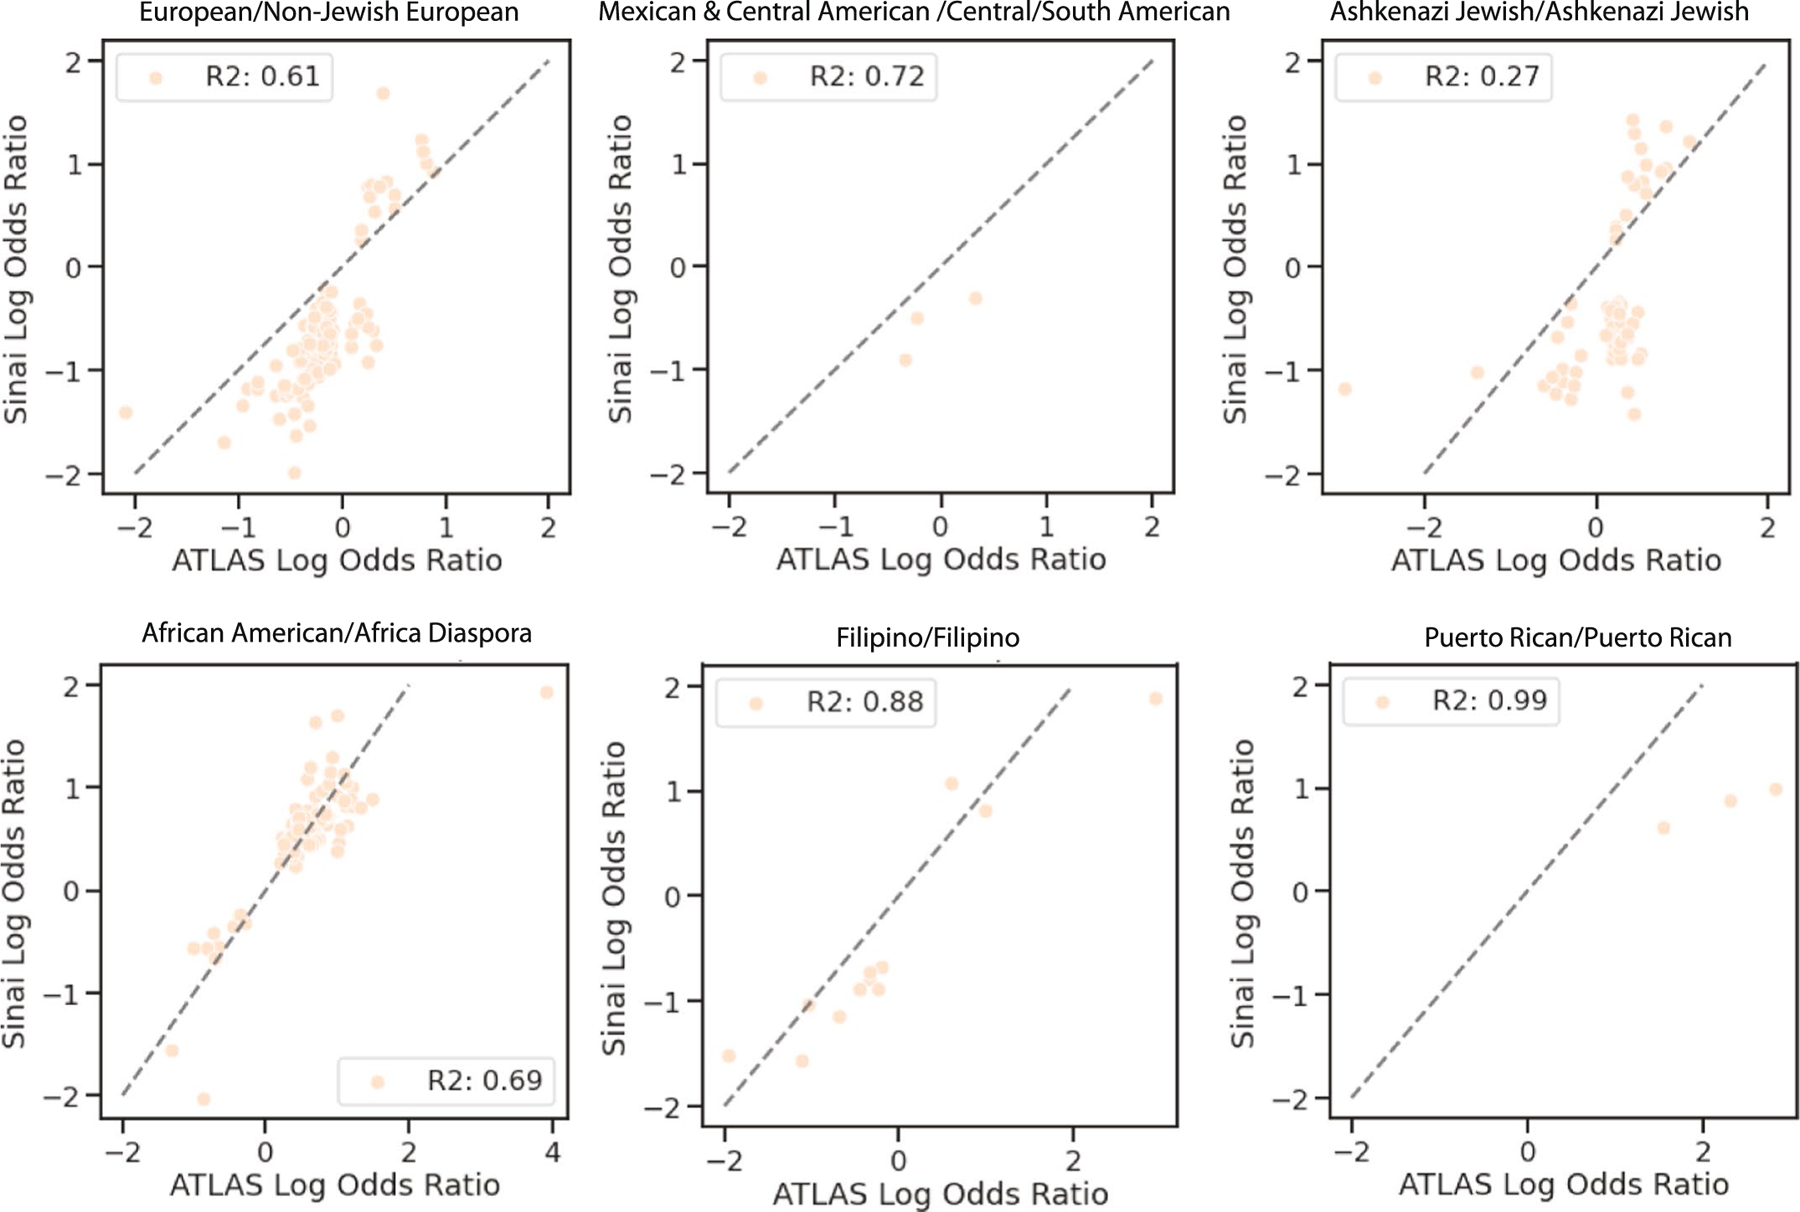
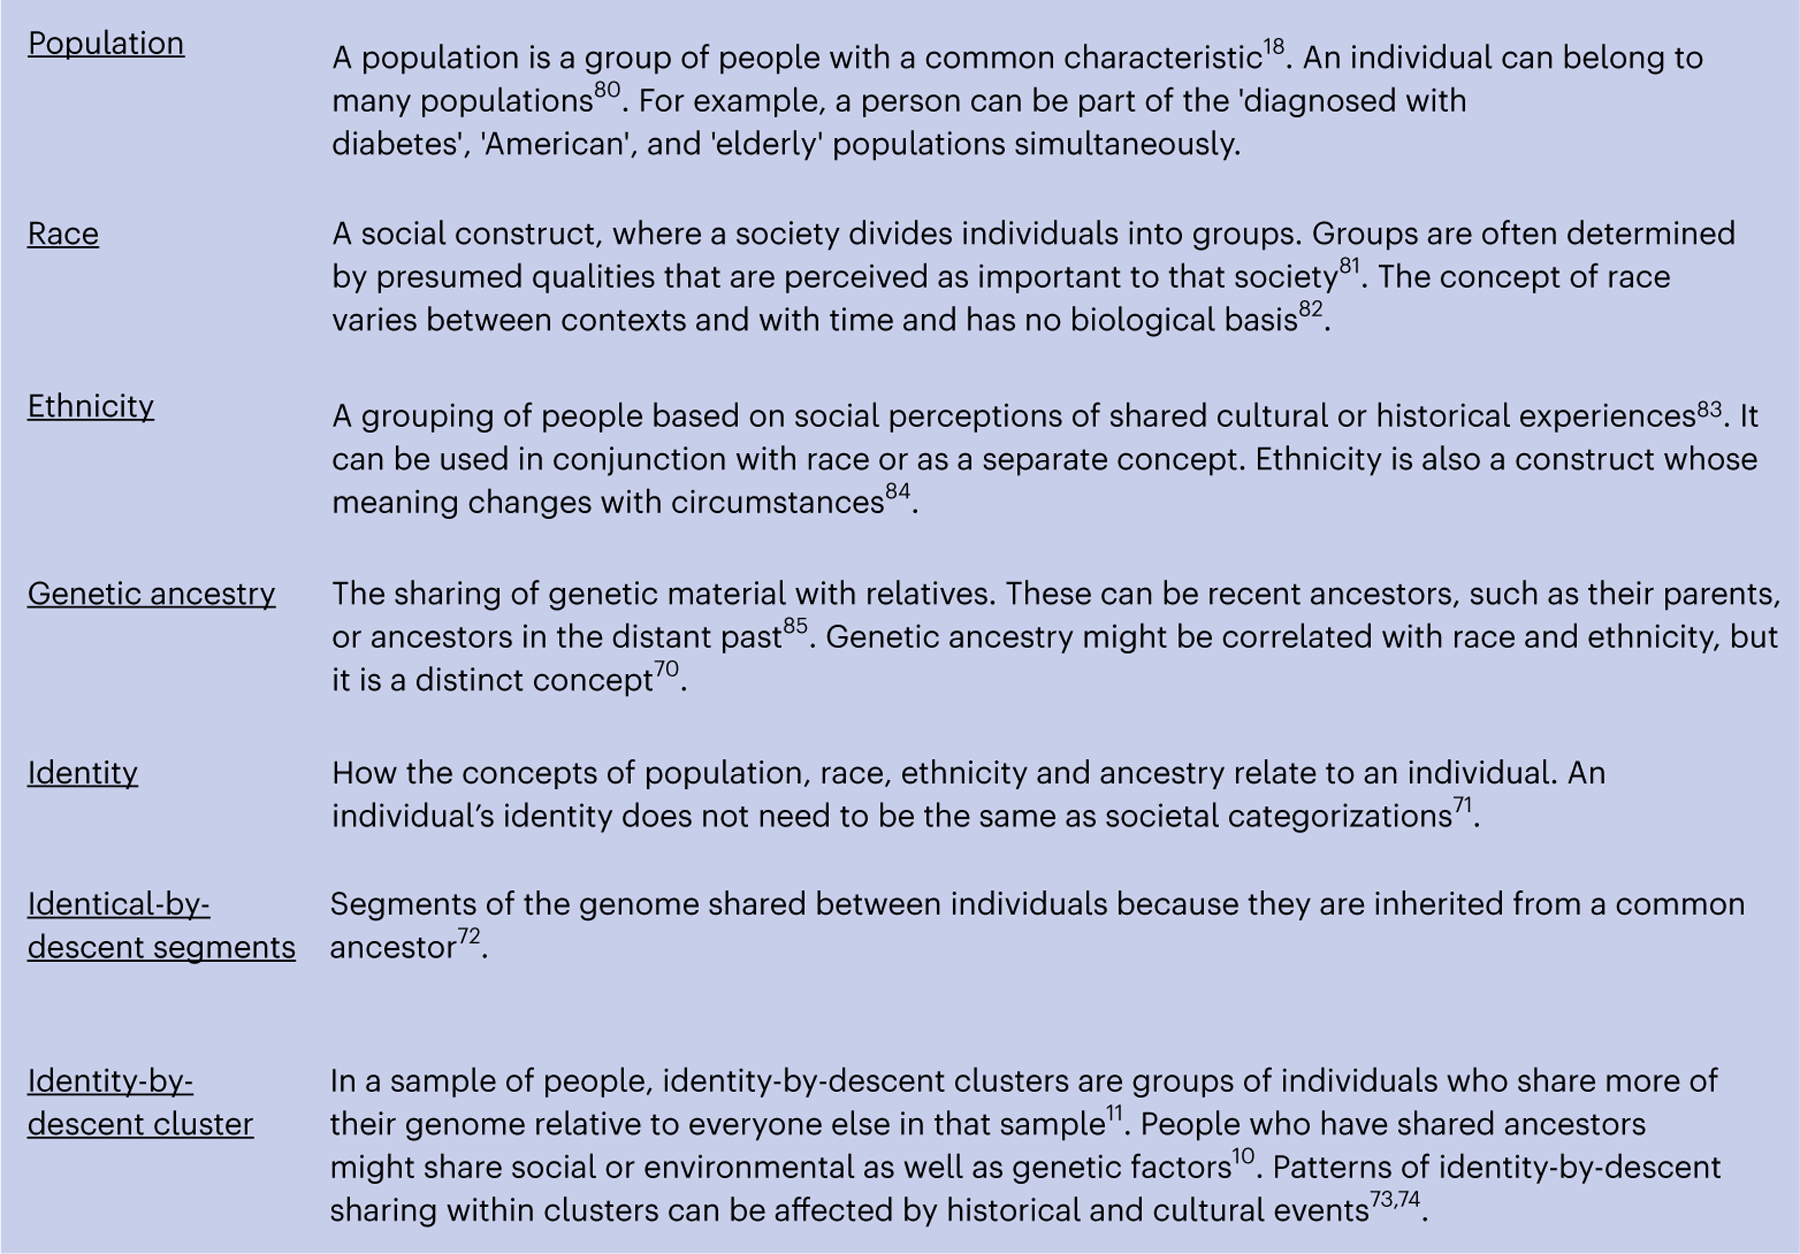
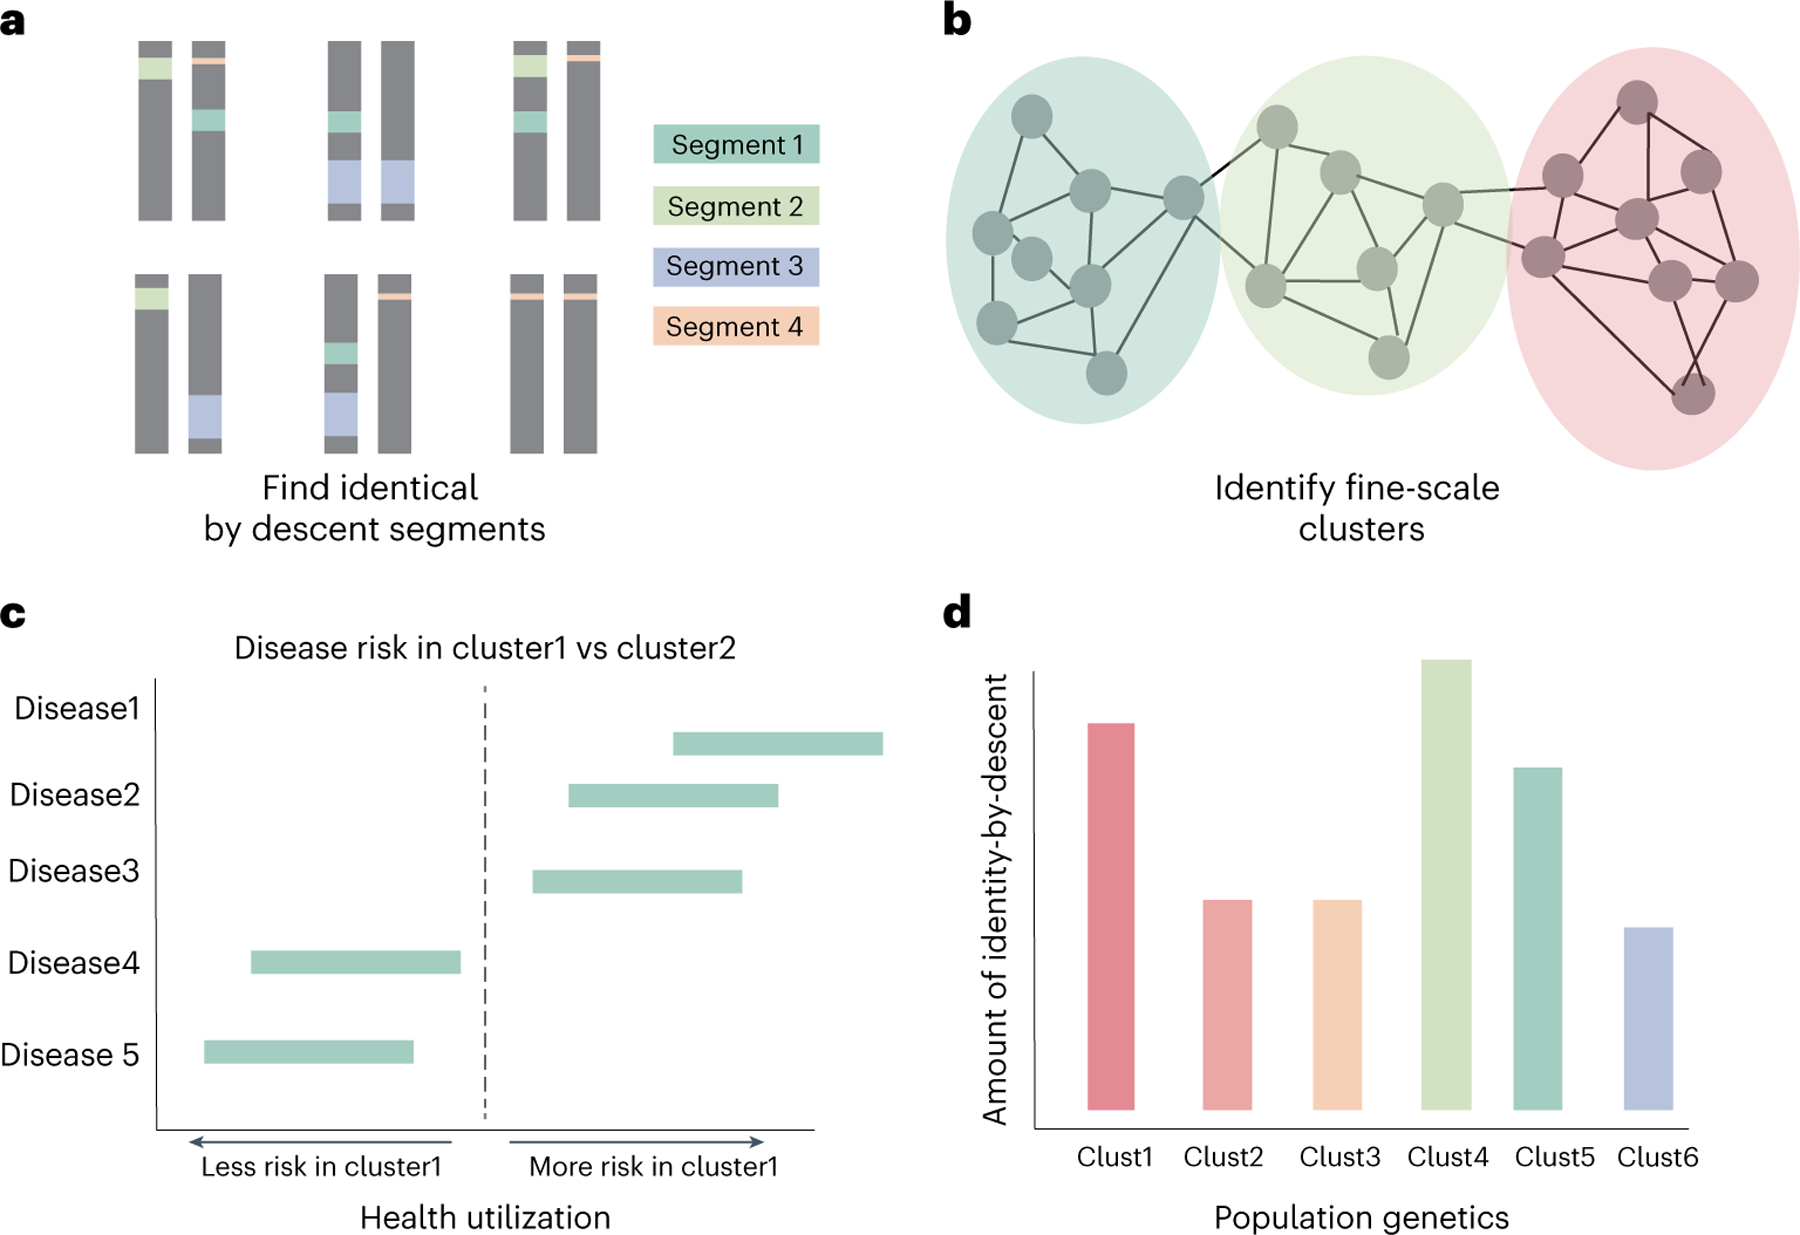
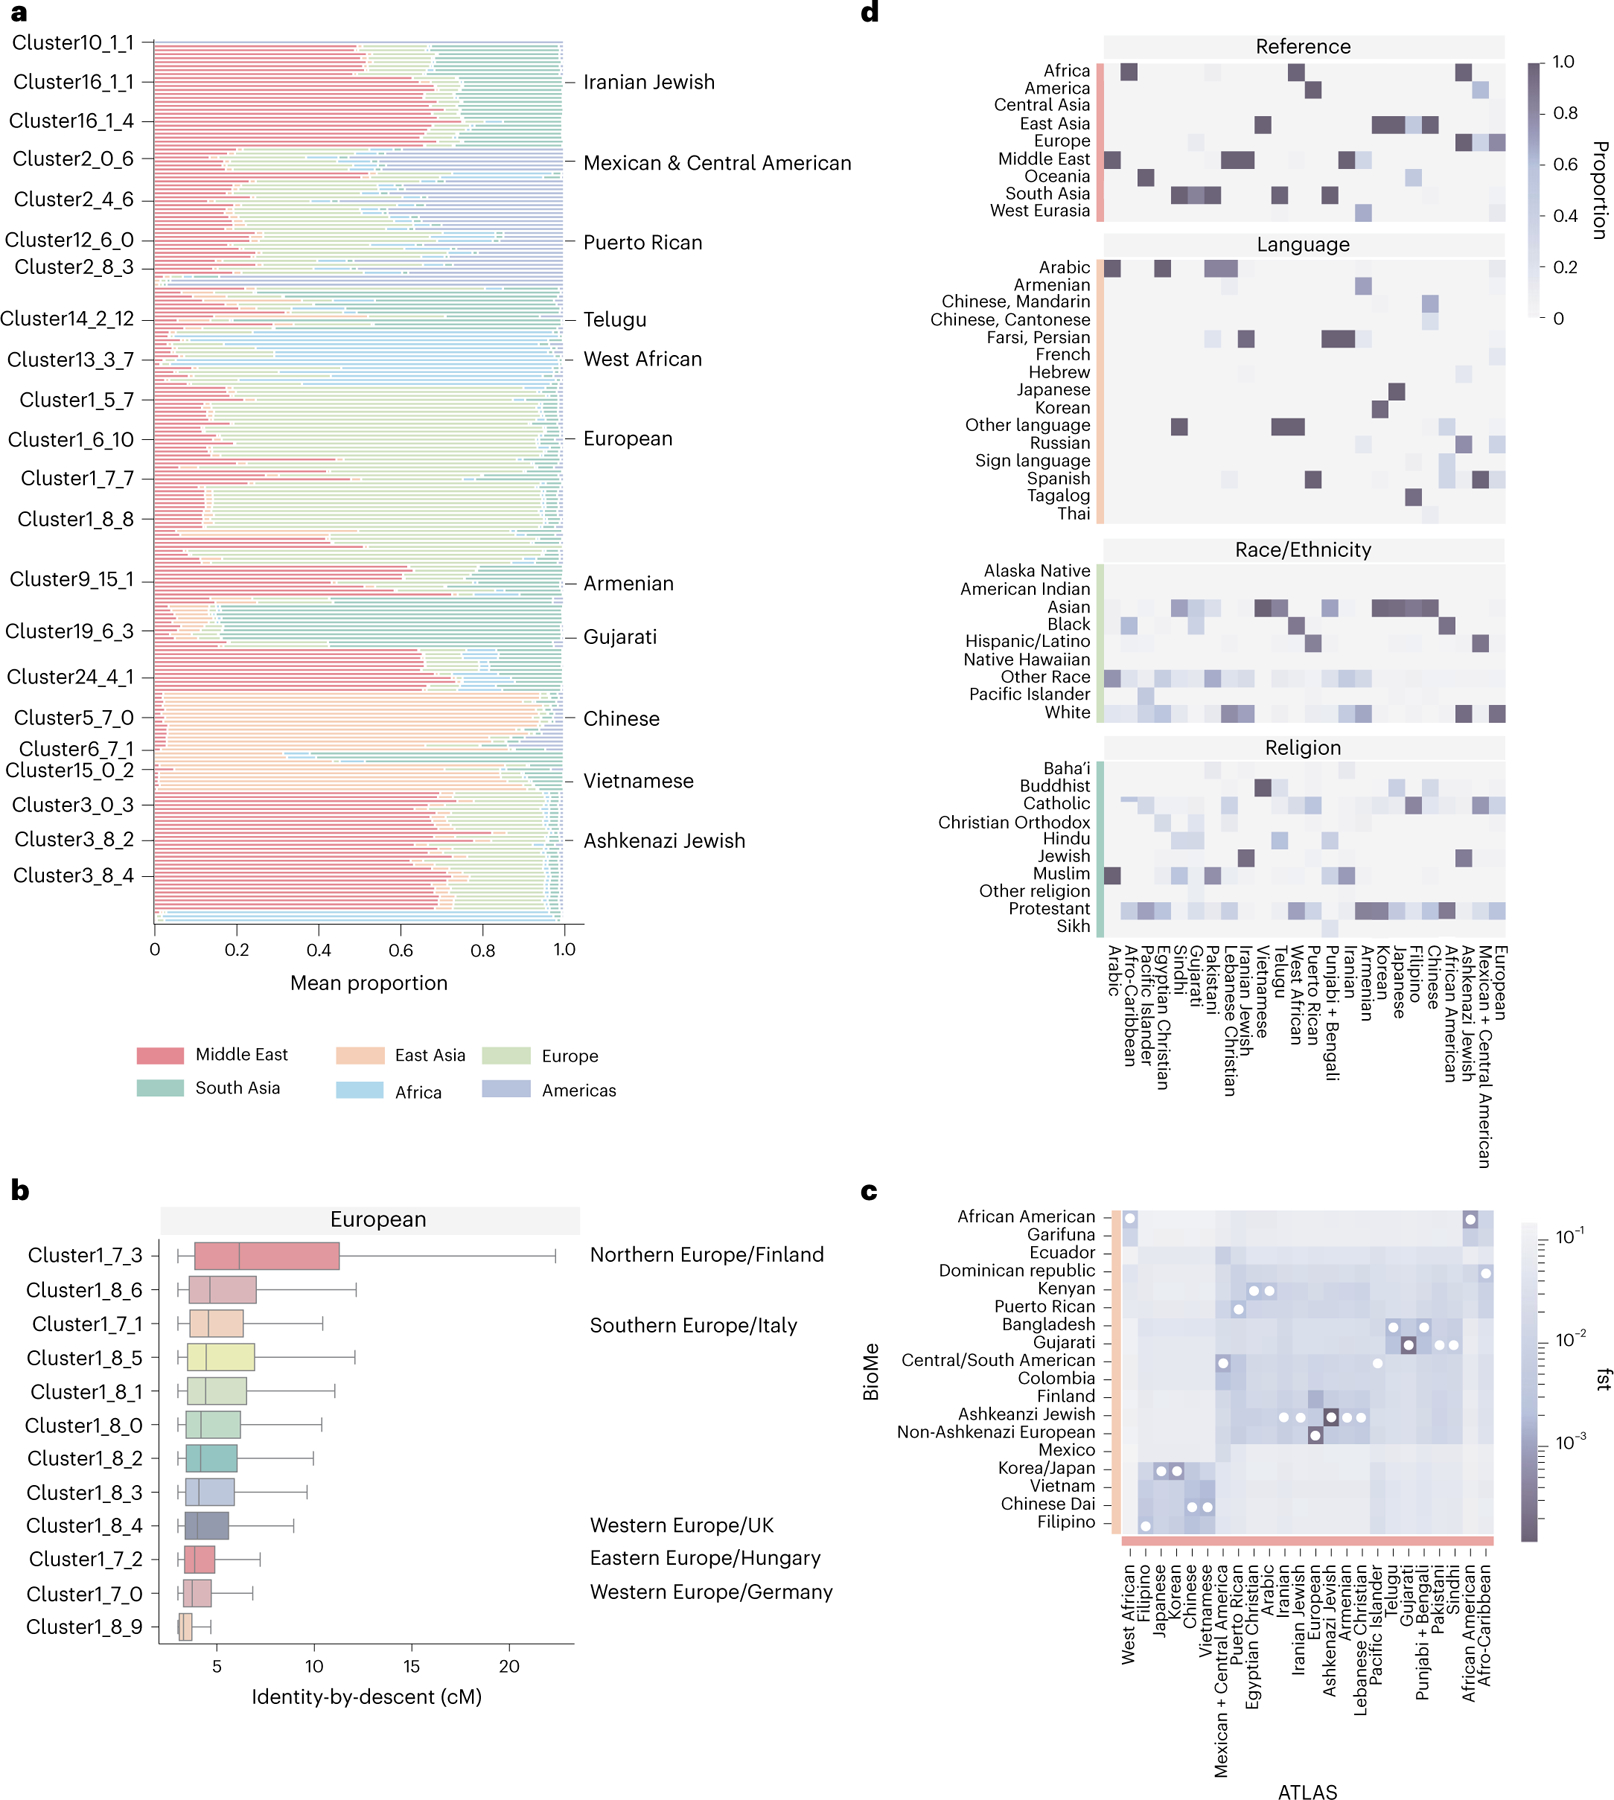
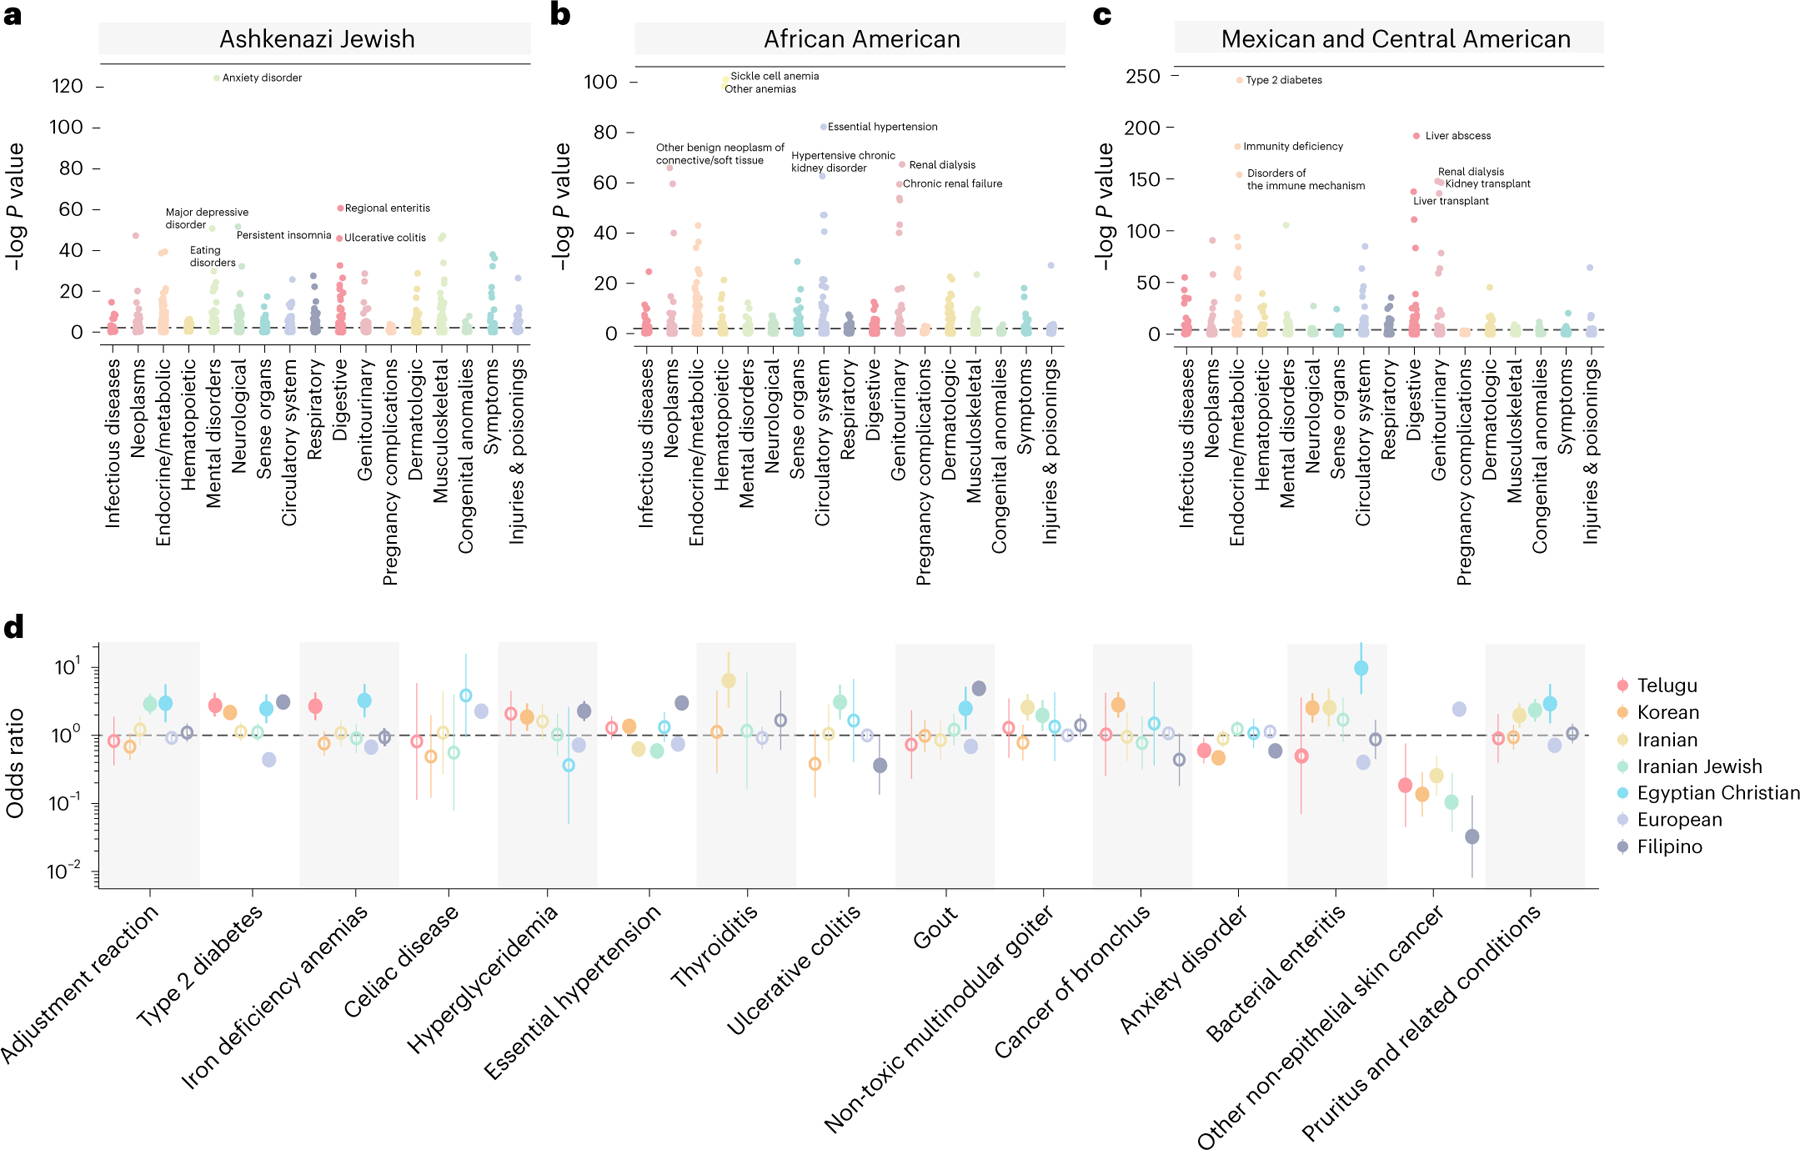
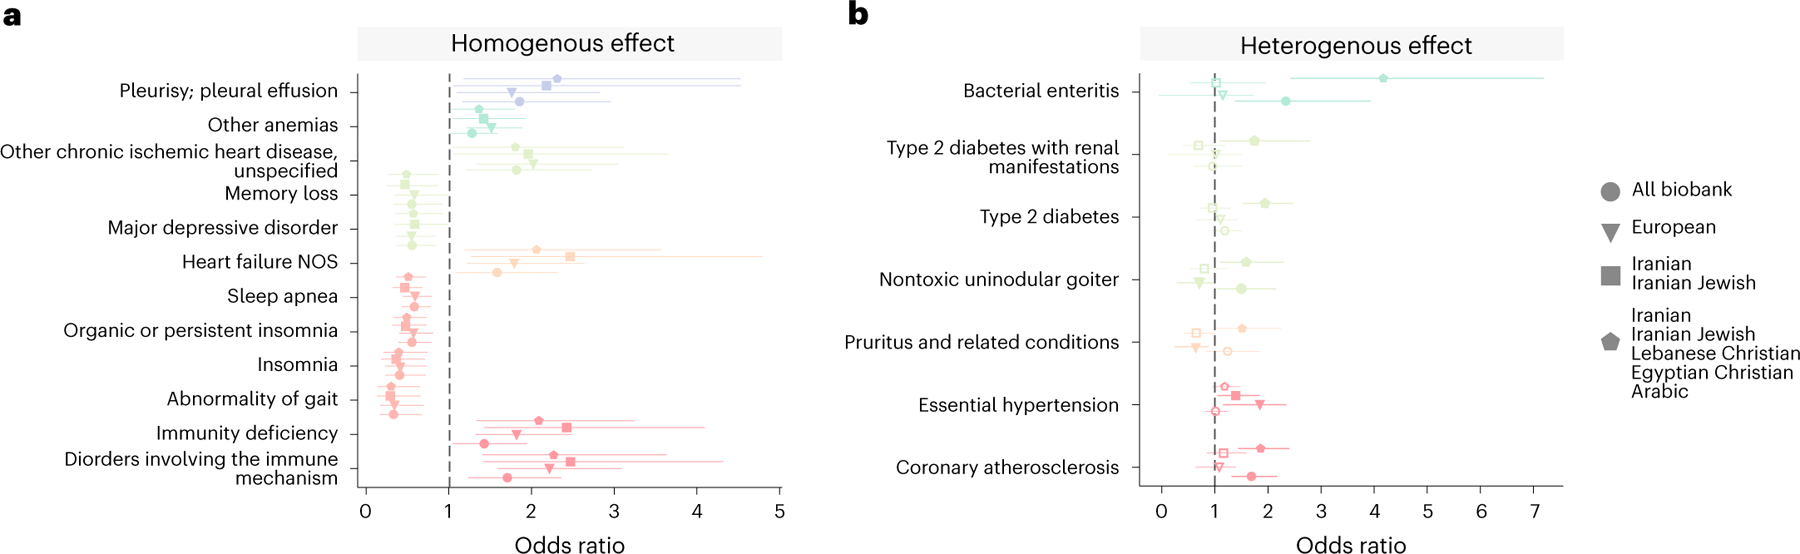
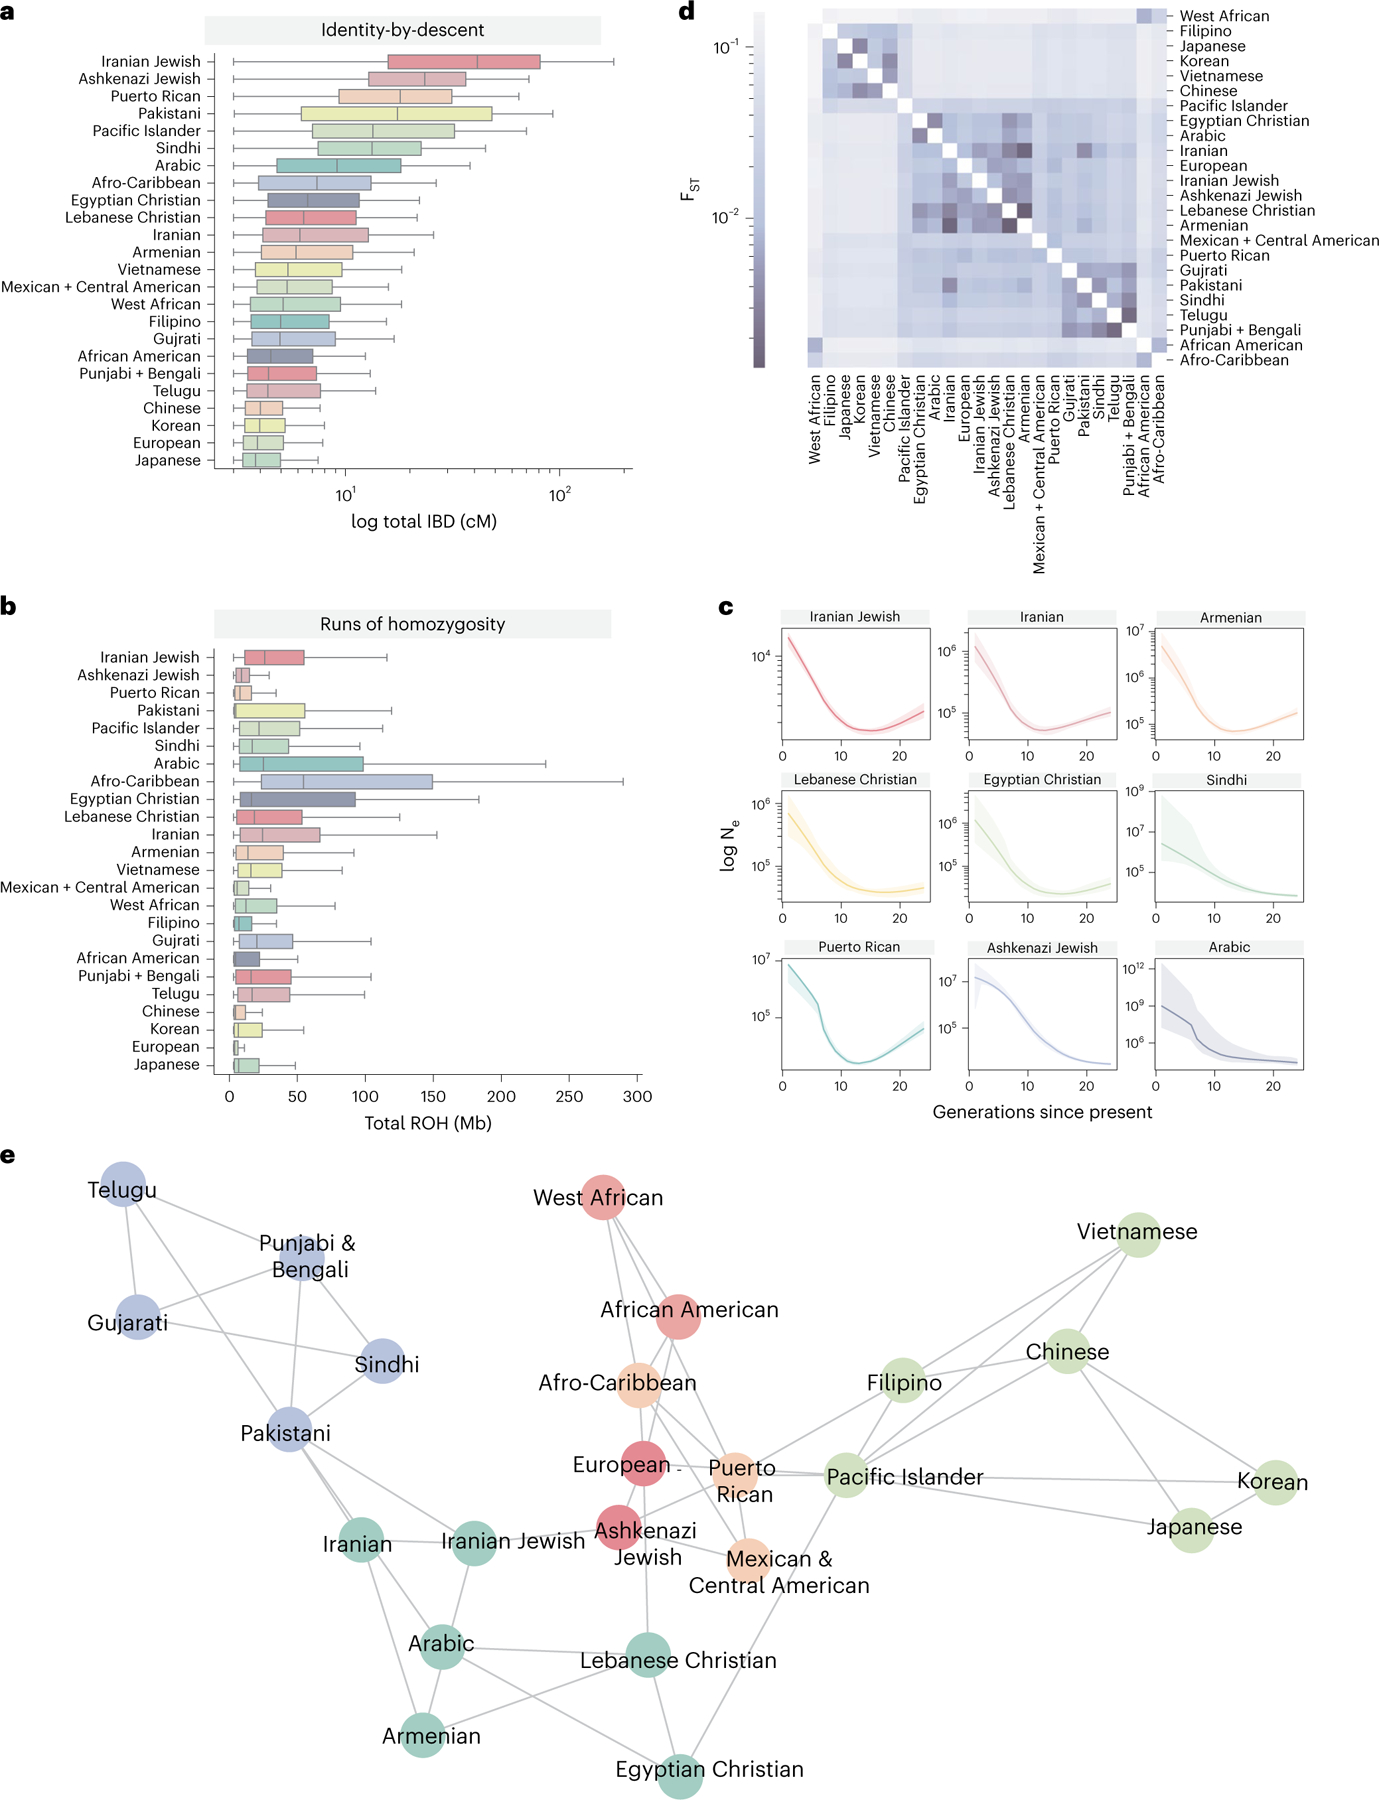
An individual's disease risk is affected by the populations that they belong to, due to shared genetics and environmental factors. The study of fine-scale populations in clinical care is important for identifying and reducing health disparities and for developing personalized interventions. To assess patterns of clinical diagnoses and healthcare utilization by fine-scale populations, we leveraged genetic data and electronic medical records from 35,968 patients as part of the UCLA ATLAS Community Health Initiative. We defined clusters of individuals using identity by descent, a form of genetic relatedness that utilizes shared genomic segments arising due to a common ancestor. In total, we identified 376 clusters, including clusters with patients of Afro-Caribbean, Puerto Rican, Lebanese Christian, Iranian Jewish and Gujarati ancestry. Our analysis uncovered 1,218 significant associations between disease diagnoses and clusters and 124 significant associations with specialty visits. We also examined the distribution of pathogenic alleles and found 189 significant alleles at elevated frequency in particular clusters, including many that are not regularly included in population screening efforts. Overall, this work progresses the understanding of health in understudied communities and can provide the foundation for further study into health inequities.


Conflict of interest statement

Competing interests

C.R.G. owns stock in 23andMe, Inc. E.E.K. has received personal fees from Regeneron Pharmaceuticals, 23andMe, Allelica and Illumina; has received research funding from Allelica; and serves on the advisory boards for Encompass Biosciences, Overtone and Galateo Bio. All other authors declare no competing interests.

Figures

Extended Data Fig. 1 |
Extended Data Fig. 1 |. Principal component analysis of ATLAS and reference data.
(a) PC1-PC4 of reference data and (b) ATLAS projected onto the reference data PC’s.
Extended Data Fig. 2 |
Extended Data Fig. 2 |. ATLAS and Los Angeles demographics.
For patients who had recorded EHR demographic information, the proportion of ATLAS or the overall UCLA DDR patient population (a) recorded as each race, (b) recorded as Hispanic or Latino ethnicity, (c) and recorded as Male/Female or Other. (d) The distribution of patient age in ATLAS and the general UCLA patient population (where patients over 90 years old are censored to 90 for privacy reasons).
Extended Data Fig. 3 |
Extended Data Fig. 3 |. Sensitivity and degree centrality of clusters.
(a) The relationship between identity-by-descent called with Shapeit4 + iLASH (x-axis) and Eagle + hap-ibd (y-axis). Each dot represents the total identity-by-descent sharing between one pair of individuals. (b) The consistency between the Louvain clusters that were identified with the Shapeit4 + iLASH approach (‘original’) and Eagle + hap-ibd (‘new’) approaches. For 10,000 random pairs of individuals, we assessed whether the pair remained in the same cluster in the new approach, or vice-versa. (c) The proportion of participants in the ‘new’ clusters in each of the original clusters. (d) The degree centrality distribution (node degree divided by the max possible degree in the cluster) of selected clusters from the final round of Louvain clustering for a cluster where nearly every individual in the cluster is connected to every other member of the cluster. (e) is an example of a cluster where individuals share some connections, but on average are less connected to each other, and (f ) is an example where individuals are moderately connected to each other.
Extended Data Fig. 4 |
Extended Data Fig. 4 |. FST between clusters and external reference data.
(a) FST between one set of subclusters (subclusters UCLA_3_7_*) that made up the European cluster and samples from the UKBioBank who were born outside the United Kingdom, combined with a random sample of 100 individuals born in the United Kingdom. The second set of European subclusters (subclusters UCLA_3_8_*) are shown in (b). (c) FST between the Greater Middle East Variome populations and UCLA clusters with Middle Eastern or Central Asian ancestry and (d) FST between modern day Middle Eastern populations and UCLA clusters with Middle Eastern/Central Asian ancestry. (e) FST between UKBB participants born in the Americas and subclusters that made up the Central/South American cluster. (f ) FST between UKBioBank participants born in Africa or the Americas and the three Black/African American clusters. For all plots, the country with the smallest FST to the ATLAS cluster is labeled. The ATLAS cluster name the subcluster belongs to is indicated in parentheses. The brighter the color, the smaller the FST value, suggesting less differentiation between the two groups.
Extended Data Fig. 5 |
Extended Data Fig. 5 |. Cluster admixture and principal component analysis.
(a) For the 24 largest clusters, the admixture proportions inferred with SCOPE with K = 6 for 100 randomly selected individuals. If the cluster has less than 100 individuals, all individuals are shown. (b) The twenty-four largest clusters were colored on a PCA analysis where ATLAS biobank participants were projected onto principal components calculated over the reference individuals.
Extended Data Fig. 6 |
Extended Data Fig. 6 |. Mexican/Central American Subclusters.
(a) The seven subclusters were visualized using a force-directed graph, where each dot represents one individual and the color of the dot indicates which cluster that individual belongs. (b) The number of Mexican indigenous reference samples in each subcluster, colored by primary geographic region. (c) Hudson’s FST between the clusters. (d) The proportion of each subcluster preferring to speak English or Spanish. (e) The proportion of each subcluster preferring a religion in the EHR, if any. (f ) The proportion of each subcluster identifying as each race in the EHR. (g) The proportion of each subcluster identifying as each ethnicity subcategory in the EHR. (h) The odds ratio of phecodes associated with membership in the Central American (n = 1998), Puerto Rican (n = 288), Afro-Caribbean (n = 39), Central Mexican (n = 2094) and Northern Mexican (n = 1115) identity-by-descent clusters. The dot represents the odds ratio and the error bar represents the standard error.
Extended Data Fig. 7 |
Extended Data Fig. 7 |. Demographics of clusters.
For each of the largest identity-by-descent clusters, the (a) distribution of median patient BMI of participants in the cluster, (b) the distribution of max patient age of participants in the cluster, (c) the proportion of the cluster that is female based on EHR demographic records, and (d) the proportion of the cluster reported to be on private or public insurance. In the box plots, the center line of the box indicates the mean, the outer edges of the box indicate the upper and lower quartiles, and the whiskers indicate the maxima and minima of the distribution.
Extended Data Fig. 8 |
Extended Data Fig. 8 |. Healthcare utilization in alternative contexts.
(a) The association between identity-by-descent cluster membership and a manually curated list of Alzheimer’s and dementia ICD codes and (b) the association between identity-by-descent cluster membership and brain MRI imaging orders. The odds ratio of whether a given phecode assignment is associated with membership in the (c) Ashkenazi Jewish (n = 5309) (d) African American (n = 1877) and (e) Mexican and Central American (n = 6075) identity-by-descent clusters versus the remaining biobank participants, in emergency room settings. Phecodes significant at FDR 5% are shown and if there are more than 30 significant associations, we plot only the top 40 with the largest absolute log odds ratio. (f ) The odds ratio of patients in a given identity-by-descent cluster visiting the emergency room relative to the remaining biobank participants, after controlling for age, sex, and BMI. In each plot, the dot represents the odds ratio and the bar represents the standard error.
Extended Data Fig. 9 |
Extended Data Fig. 9 |. Fine-scale health utilization in ATLAS.
(a) For the Chinese (n = 1547), Japanese (n = 596), Filipino (n = 796), and Korean (n = 546) identity-by-descent clusters, phecodes that have significantly different odds ratios between the clusters. Error bars indicate the standard errors. (b) The odds ratio of the European identity-by-descent cluster visiting a particular specialty, assessed against all other biobank participants. Error bars represent the standard error. For 6 clusters, the proportion of that identity-by-descent cluster that visited the UCLA Health system each year in an outpatient setting receiving (c) kidney replaced by transplant, and (d) major depressive disorder.
Extended Data Fig. 10 |
Extended Data Fig. 10 |. Replication of effect sizes.
For phecodes significant in ATLAS, the log odds ratio of ATLAS (x-axis) versus the log odds ratio of BioMe (y-axis) for six ATLAS clusters (European: n = 17017, Mexican & Central American: n = 6075, Ashkenazi Jewish: n = 5039, African American: n = 1877, Filipino: n = 796, and Puerto Rican: n = 288) that were enriched for similar populations in the two biobanks (indicated by title).
Fig. 1 |
Fig. 1 |. Definitions of key phrases.
For several frequently used words relating to ancestry and identity, we contextualize each word and provide a working definition.
Fig. 2 |
Fig. 2 |. An overview of the fine-scale cluster detection approach.
A schematic of identity-by-descent calling and cluster annotation. a, We first inferred identity-by-descent segments for all biobank participants and reference samples. We then identified fine-scale clusters using Louvain clustering (b), and we explored patterns of enrichment for cluster-specific health utilization (c). d, Finally, we measured patterns of genetic relatedness both within and between clusters.
Fig. 3 |
Fig. 3 |. Genetic and demographic properties of clusters.
a, The mean admixture fractions for each of the identity-by-descent clusters. Each line corresponds to one ATLAS cluster. The components refer to genetic ancestry from the Middle East, East Asia, Europe, South or Central Asia, Africa and the Americas. The left column indicates the identity-by-decent cluster number, and the right column gives examples of names given to the largest clusters. b, The distribution of identity by descent within subclusters that were merged to make one European cluster (n = 17,017). The names on the left indicates the identity-by-descent cluster number, and the name on the right indicates relatedness from comparison with the UK BioBank. The center line of the box indicates the mean; the outer edges of the box indicate the upper and lower quartiles; and the whiskers indicate the maxima and minima of the distribution. c, The Hudson’s fixation index (FST) value between identity-by-descent clusters identified in BioMe at Mount Sinai and ATLAS identity-by-descent clusters demonstrates the relationship between ATLAS and populations outside of UCLA Health. The darker the color, the smaller the FST value. The smallest FST value for each of the ATLAS clusters is indicated by a white dot. d, For each of the largest clusters (from top to bottom), the proportion of reference data by continent in each cluster, the proportion that indicated they prefer a specific religion, the proportion of EHR race/ethnicity category and the proportion of language preferred.
Fig. 4 |
Fig. 4 |. Phecode associations for selected clusters.
Phecodes associations for n = 1,131 identity-by-descent clusters relative to the remaining biobank participants. Results are shown for the Ashkenazi Jewish (n = 5,309) (a), African American (n = 1,877) (b) and Mexican and Central American (n = 6,075) (c) identity-by-descent clusters. Phecodes are grouped by phenotypic category. Top significant (Benjamini–Hochberg FDR at 5%) associations for each cluster are labeled. Bonferroni significance is indicated by a gray dotted line. d, ORs of association between identity-by-descent clusters and phecodes for the Telugu (n = 276), Korean (n = 546), Iranian (n = 350), Iranian Jewish (n = 264), Egyptian Christian (n = 92), European (n = 17,017) and Filipino (n = 796) clusters. Vertical bars indicate the standard error. Dots represent the OR, and a solid line indicates significance at FDR 5%. Open dots indicate a non-significant association.
Fig. 5 |
Fig. 5 |. Phecodes associated with the Armenian identity-by-descent cluster.
For each phecode, the OR that membership in the Armenian cluster (n = 491) was associated with that phecode compared to the rest of the biobank, the European cluster (n = 17,017), the Iranian and Iranian Jewish clusters (n = 614) and MENA ancestry clusters (n = 960). In a, phecodes that are FDR significant at 5% (where logistic regression q < 0.05) in all comparison groups and had the same direction of effect (‘homogenous effect’) are shown. In b, phecodes that have a ‘heterogeneous effect’ (mixed-effects meta-regression test where P < 0.05) are shown. Phecodes of the same color are from the same phecode category. In each plot, the dot represents the OR, and the lines represent the standard error. NOS, nitric oxide synthases.
Fig. 6 |
Fig. 6 |. The genetic properties of the largest identity-by-descent clusters.
The distribution of total pairwise identity by descent (cM) (a) and total amount of ROH detected shared among individuals of a given cluster (b). The center line of the box indicates the mean; the outer edges of the box indicate the upper and lower quartiles; and the whiskers indicate the maxima and minima of the distribution. c, IBDNe estimates of historic population size (Ne) for nine selected clusters, where the line is the mean estimate of the population size for each generation from present, and the shaded region indicates the 95% CI of the estimate. Dips in the population size can suggest founder effects. d, Pairwise Hudson’s FST estimates between UCLA ATLAS identity-by-descent clusters, where the darker color indicates lower FST, suggesting less differentiation between the pair of clusters. e, A network diagram of identity-by-descent sharing between clusters, where each node is a cluster and each edge is weighted by the amount of identity by descent shared between the clusters. The graph was visualized using 1,000 iterations of the Fruchterman–Reingold algorithm. For clarity, the three edges with the largest amount of identity by descent shared per cluster are displayed.

Comment in

References

    1. Williams DR, Mohammed SA, Leavell J & Collins C Race, socioeconomic status, and health: complexities, ongoing challenges, and research opportunities. Ann. N. Y. Acad. Sci. 1186, 69–101 (2010). - PMC - PubMed
    1. Fiscella K & Williams DR Health disparities based on socioeconomic inequities: implications for urban health care. Acad. Med. 79, 1139–1147 (2004). - PubMed
    1. Geneviève LD, Martani A, Shaw D, Elger BS & Wangmo T Structural racism in precision medicine: leaving no one behind. BMC Med. Ethics 21, 17 (2020). - PMC - PubMed
    1. Martin AR et al. Clinical use of current polygenic risk scores may exacerbate health disparities. Nat. Genet. 51, 584 (2019). - PMC - PubMed
    1. Majara L et al. Low and differential polygenic score generalizability among African populations due largely to genetic diversity. HGG Adv. 4, 100184 (2023). - PMC - PubMed

Publication types