. 2023 Jul;55(7):1531-1543.
doi: 10.1038/s12276-023-01041-w. Epub 2023 Jul 18.

Nicotinamide enhances osteoblast differentiation through activation of the mitochondrial antioxidant defense system

Affiliations

Nicotinamide enhances osteoblast differentiation through activation of the mitochondrial antioxidant defense system

Heein Yoon et al. Exp Mol Med. 2023 Jul.

Abstract

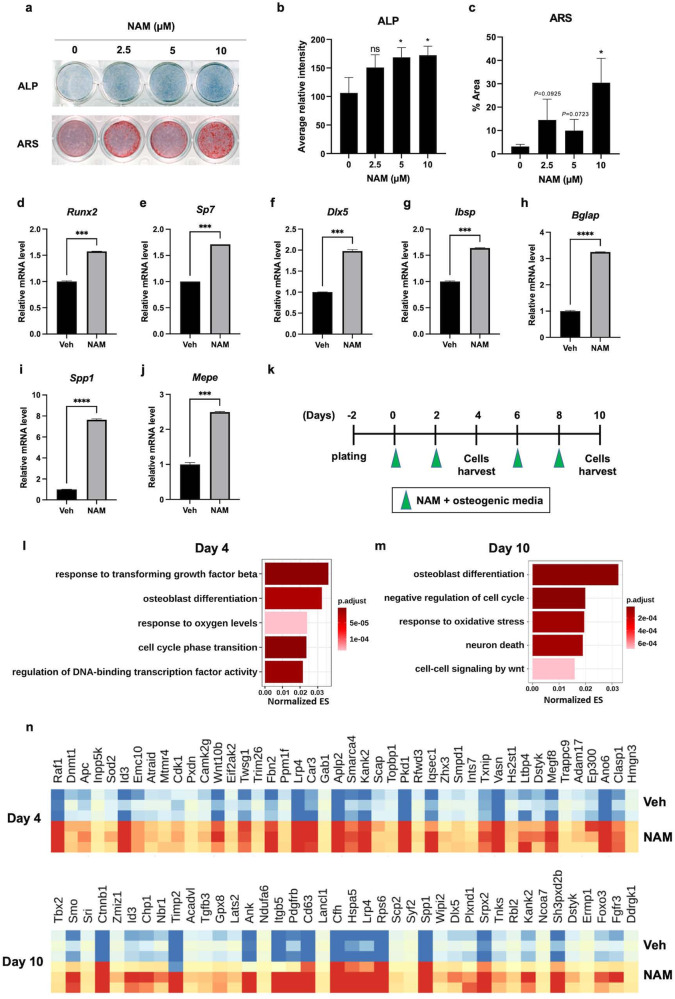
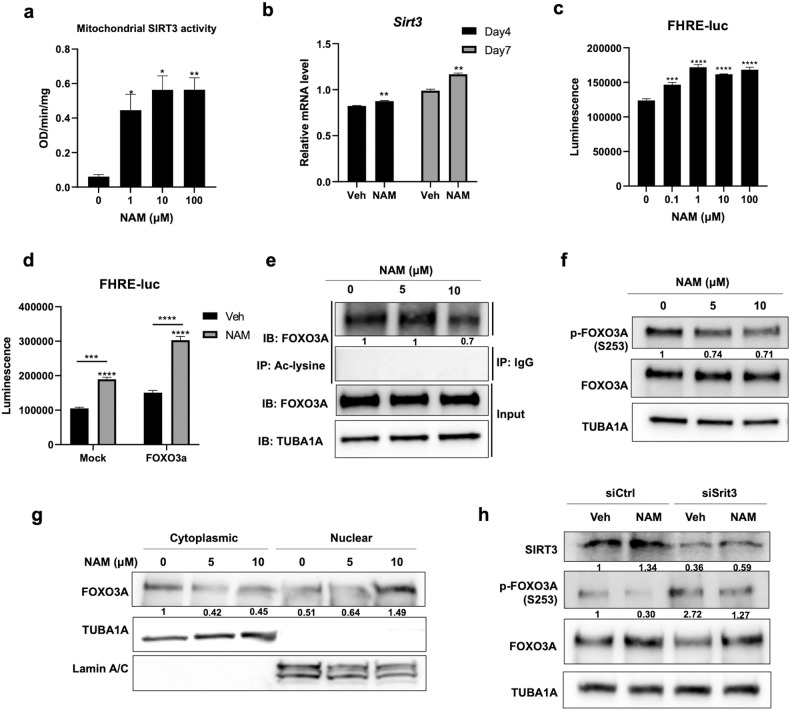
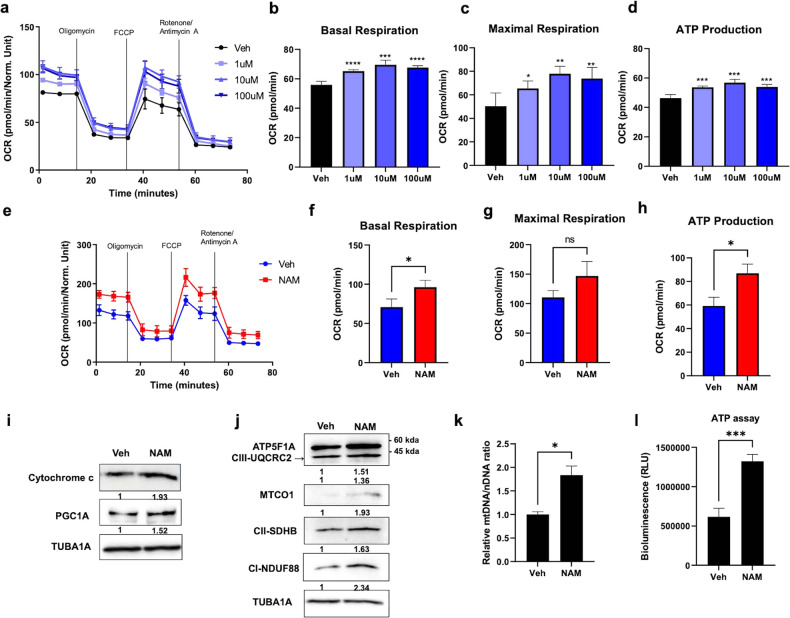
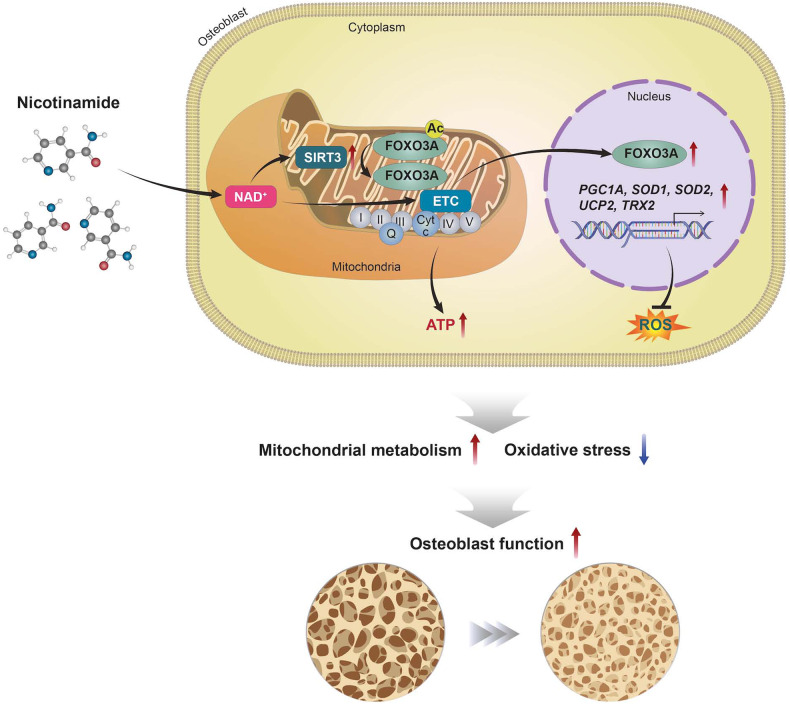
Although the normal physiological level of oxidative stress is beneficial for maintaining bone homeostasis, imbalance between reactive oxygen species (ROS) production and antioxidant defense can cause various bone diseases. The purpose of this study was to determine whether nicotinamide (NAM), an NAD+ precursor, can support the maintenance of bone homeostasis by regulating osteoblasts. Here, we found that NAM enhances osteoblast differentiation and mitochondrial metabolism. NAM increases the expression of antioxidant enzymes, which is due to increased FOXO3A transcriptional activity via SIRT3 activation. NAM has not only a preventive effect against weak and chronic oxidative stress but also a therapeutic effect against strong and acute exposure to H2O2 in osteoblast differentiation. Collectively, the results indicate that NAM increases mitochondrial biogenesis and antioxidant enzyme expression through activation of the SIRT3-FOXO3A axis, which consequently enhances osteoblast differentiation. These results suggest that NAM could be a potential preventive or therapeutic agent for bone diseases caused by ROS.


Conflict of interest statement

The authors declare no competing interests.

Figures

Fig. 1
Fig. 1. Nicotinamide (NAM) stimulated osteoblast differentiation.
a ALP and Alizarin Red S (ARS) staining were performed in MC3T3-E1 cells cultured in osteogenic medium supplemented with the indicated concentrations of NAM for 5 and 12 days. The osteogenic medium containing NAM was replaced every other day. b, c Quantification of each staining was performed by ImageJ. dj The mRNA levels of osteoblast differentiation marker genes were determined by RT‒qPCR on Day 10. k Scheme of NAM treatment for RNA-seq analysis. MC3T3-E1 cells were cultured with 10 μM NAM in osteogenic medium. The osteogenic medium containing NAM was replaced every two days until the cells were harvested. The green arrows indicate the days of NAM treatment. l, m Correlation analysis was conducted with NAM-increased DEGs on Days 4 and 10. A normalized correlation matrix is used to show the correlations among GO terms in the biological process category. The GO analysis of genes included in Cluster 4 on Day 4 and Day 10 (yellow box in Supplementary Figs. 2a and 3a) is shown with a bar plot. The top 5 GOs were selected based on the adjusted p values and sorted by enrichment scores. n Heatmap of the genes included in Cluster 4 on Day 4 and Day 10 (Supplementary Fig. 2a and 3a). Z score normalization was performed based on statistics calculated by DEseq2. The data are expressed as the mean ± SD. *P < 0.05. **P < 0.01. ***P < 0.001. ****P < 0.0001. ns, not significant.
Fig. 2
Fig. 2. NAM reduces mitochondrial ROS levels by increasing antioxidant enzymes.
a The oxidative stress in MC3T3-E1 cells was determined by CellROXTM reagent after 10 μM NAM treatment with osteogenic media for 7 d. b The fluorescence intensity of (a) was calculated via ImageJ. c Mitochondrial superoxide was detected by MitoSOXTM mitochondrial superoxide indicator in MC3T3-E1 cells after 10 μM NAM treatment in osteogenic media for 7 d. d The fluorescence intensity of (c) was measured by ImageJ. ei The mRNA expression levels of Pgc1α and ROS scavenger enzymes in MC3T3-E1 cells cultured in osteogenic medium supplemented with or without 10 μM NAM for 4 and 7 d were determined by RT‒qPCR. j The mitochondrial fraction was isolated from the culture under the same conditions to measure SOD2 enzymatic activity. ko To understand the influence of PGC1A on ROS scavenger enzyme gene expression, MC3T3-E1 cells transfected with siCtrl or siPgc1α were cultured in osteogenic medium with or without 10 μM NAM for 4 d. p MC3T3-E1 cells were cultured in osteogenic medium with or without 10 μM NAM for 7 d. The protein expression level of ROS scavenger enzymes was determined by immunoblot analysis. Data are expressed as mean ± SD. *P < 0.05. **P < 0.01. ***P < 0.001. ****P < 0.0001. ns, not significant.
Fig. 3
Fig. 3. NAM-induced SIRT3 and FOXO3A activation mediates the upregulation of mitochondrial antioxidants.
a The mitochondrial fraction was isolated after 10 μM NAM treatment with osteogenic medium for 1 d. SIRT3 activity was determined with the mitochondrial fraction via a SIRT activity assay kit. b MC3T3-E1 cells were treated with 10 μM NAM in osteogenic medium for 4 and 7 d. The mRNA level of Sirt3 was determined by RT‒qPCR. c The transactivation activity of FOXO3A was measured in MC3T3-E1 cells transfected with FHRE-Luc after NAM treatment for 2 d. d Luciferase activity was determined after co-transfection of an FHRE-Luc plasmid and a control plasmid (pcDNA3.1) or with plasmids expressing FOXO3A and treatment with NAM for 2 d. e The acetylation level of FOXO3A was determined by immunoprecipitation (IP) with an anti-acetylated-lysine antibody followed by immunoblot analysis with an anti-FOXO3A antibody. f MC3T3-E1 cells were treated with the indicated concentrations of NAM for 4 d in osteogenic medium, and cell lysates were immunoblotted with p-FOXO3A (S253) and FOXO3A antibodies. g MC3T3-E1 cells were treated with NAM in osteogenic medium for 4 d, after which they were subjected to subcellular fractionation. The subcellular localization of FOXO3A was determined by immunoblot analysis. h MC3T3-E1 cells were transfected with siCtrl or siSirt3. The cells were cultured in osteogenic medium with or without 10 μM NAM for 4 d, and the cell lysates were immunoblotted with SIRT3, p-FOXO3A (S253) and FOXO3A antibodies. The data are expressed as the mean ± SD. *P < 0.05. **P < 0.01. ***P < 0.001. ****P < 0.0001. ns, not significant.
Fig. 4
Fig. 4. NAM enhances mitochondrial function in osteoblast differentiation.
ad MC3T3-E1 cells were cultured with the indicated concentrations of NAM in growth medium for 1 d, and the OCR was measured. e MC3T3-E1 cells were cultured in osteogenic medium supplemented with or without 10 µM NAM for 7 days, and the OCR was measured and analyzed with bar plots (fh). i The protein expression levels of Cytochrome C and PGC1A under the same culture conditions were assessed by immunoblot analysis. j The protein levels of OXPHOS mitochondrial complexes were measured by immunoblot analysis using a total OXPHOS Rodent WB antibody cocktail. k The relative copy numbers of mitochondrial DNA (mtDNA) and nuclear DNA (nDNA) from the same culture condition were evaluated by RT‒qPCR. The mtDNA/nDNA ratio was calculated by comparing the ΔΔCt values. l MC3T3-E1 cells cultured under the same conditions were measured for ATP levels. The data are expressed as the mean ± SD. *P < 0.05. **P < 0.01. ***P < 0.001. ****P < 0.0001. ns, not significant.
Fig. 5
Fig. 5. NAM prevents ROS-induced mitochondrial and functional impairment in osteoblasts.
a ALP staining and ARS staining were performed after 10 μM NAM treatment with osteogenic medium in the presence or absence of 100 μM H2O2 for 5 and 12 days. b, c Quantification of each staining was performed by ImageJ. d H2O2-decreased DEGs restored by NAM were investigated by GO analysis in biological process on Day 10. The top 20 GO terms were selected and listed based on the adjusted P value and enrichment score. e, f Correlation analysis was performed on the genes in (d). The normalized correlation matrix was created to show the correlations between GO terms. The circular bar plots depict the ratios of genes associated with each GO term. g The mitochondrial OCR was evaluated after treatment with 10 μM NAM with or without 100 μM H2O2 for 7 d in osteogenic medium using an XF96 Extracellular Flux Analyzer. hj The parameters calculated from the curved OCR plot are described in bar plots. kl MC3T3-E1 cells were treated with 100 μM H2O2 alone or in combination with 10 μM NAM for 24 h. Immunostaining was performed using a γH2AX antibody (red) and DAPI (blue). To quantify the number of cells with γH2AX foci, the cells containing ≥10 foci were counted. mp MC3T3-E1 cells were treated with 300 μM H2O2 in combination with or without 10 μM NAM. To detect H2O2-induced cell death, flow cytometry analysis after Annexin V and PI double staining was performed. q The percentages of each cell population are presented in a bar plot (n = 3). The data are expressed as the mean ± SD. *P < 0.05. **P < 0.01. ***P < 0.001. ****P < 0.0001. ns, not significant.
Fig. 6
Fig. 6. NAM improves osteoblast differentiation and mitochondrial metabolism.
NAM increases mitochondrial biogenesis and antioxidant enzyme expression through activation of the SIRT3, FOXO3A, and PGC1A, which consequently enhances osteoblast differentiation. NAM facilitates osteogenic differentiation both in normal physiological conditions and under oxidative stress.

References

    1. Alfadda AA, Sallam RM. Reactive oxygen species in health and disease. J. Biomed. Biotechnol. 2012;2012:936486. doi: 10.1155/2012/936486. - DOI - PMC - PubMed
    1. Auten RL, Davis JM. Oxygen toxicity and reactive oxygen species: the devil is in the details. Pediatr. Res. 2009;66:121–127. doi: 10.1203/PDR.0b013e3181a9eafb. - DOI - PubMed
    1. Wilson C. Oxidative stress and osteoporosis. Nat. Rev. Endocrinol. 2014;10:3–3. - PubMed
    1. Balaban RS, Nemoto S, Finkel T. Mitochondria, oxidants, and aging. Cell. 2005;120:483–495. doi: 10.1016/j.cell.2005.02.001. - DOI - PubMed
    1. Gao J, et al. SIRT3/SOD2 maintains osteoblast differentiation and bone formation by regulating mitochondrial stress. Cell Death Differ. 2018;25:229–240. doi: 10.1038/cdd.2017.144. - DOI - PMC - PubMed

Publication types