. 2023 Oct;72(10):3279-3292.
doi: 10.1007/s00262-023-03487-3. Epub 2023 Jul 18.

Piper nigrum extract suppresses tumor growth and enhances the antitumor immune response in murine models of breast cancer and melanoma

Affiliations

Piper nigrum extract suppresses tumor growth and enhances the antitumor immune response in murine models of breast cancer and melanoma

Paola Lasso et al. Cancer Immunol Immunother. 2023 Oct.

Abstract

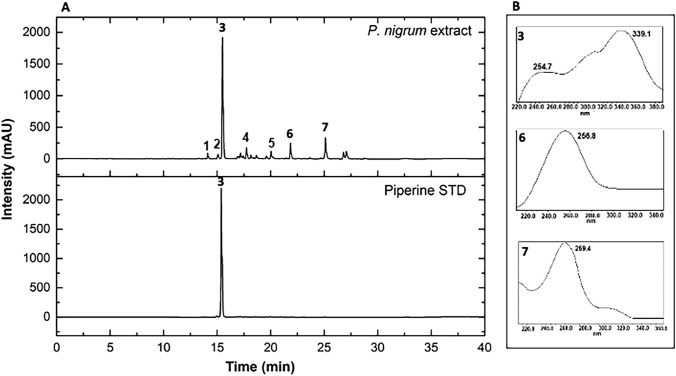
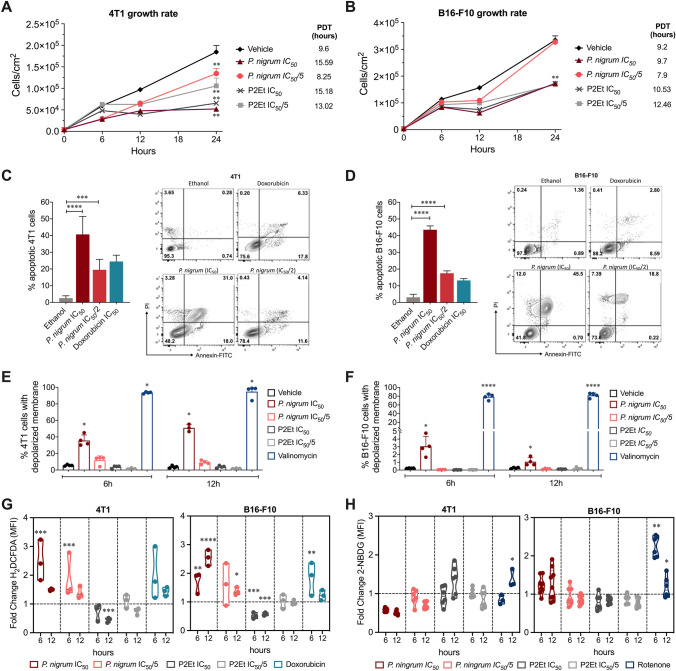
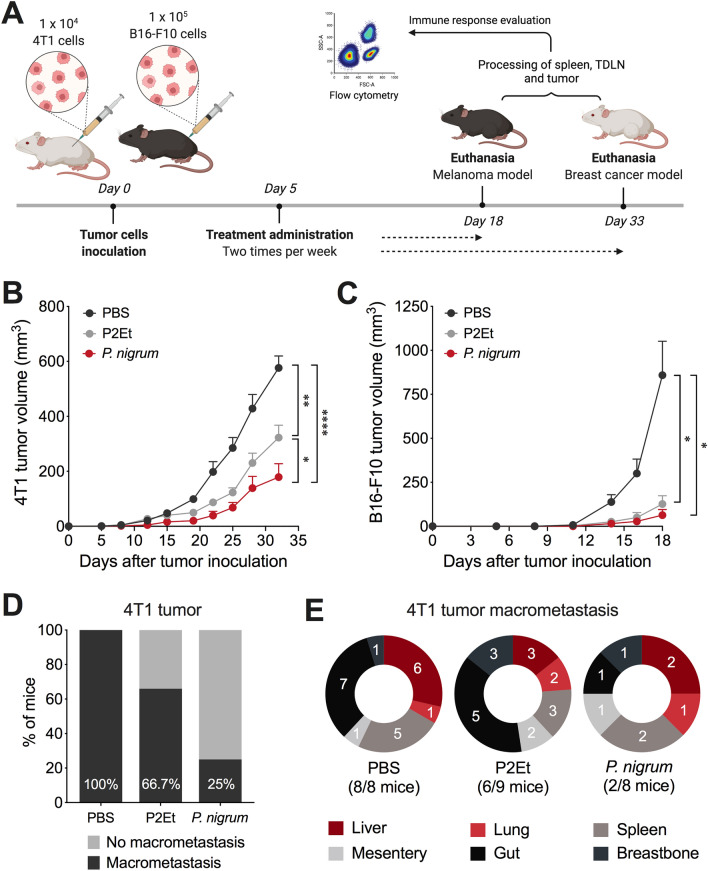
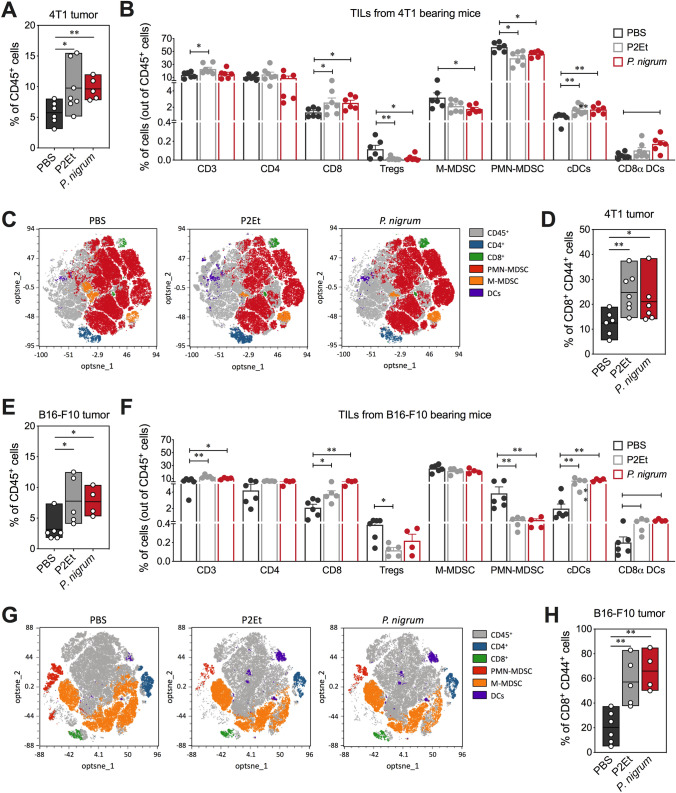
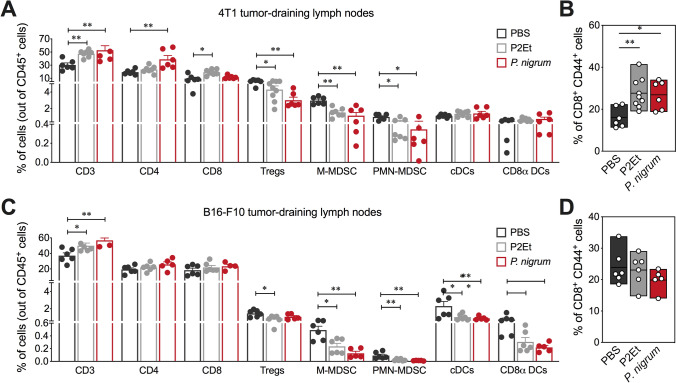
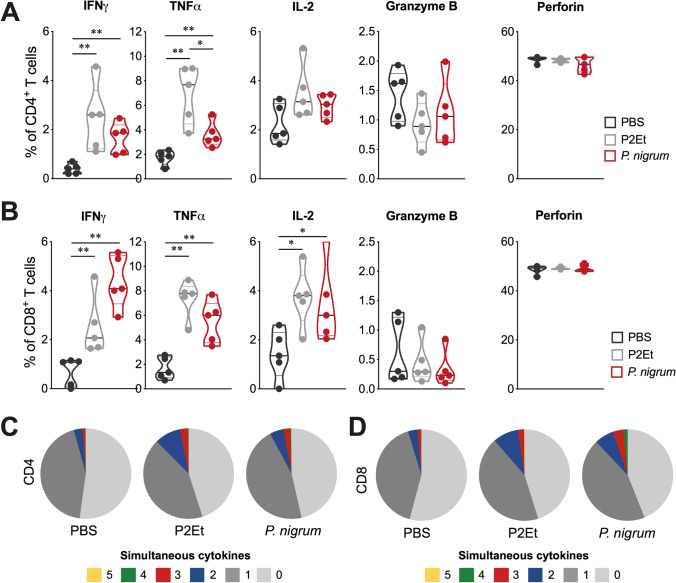
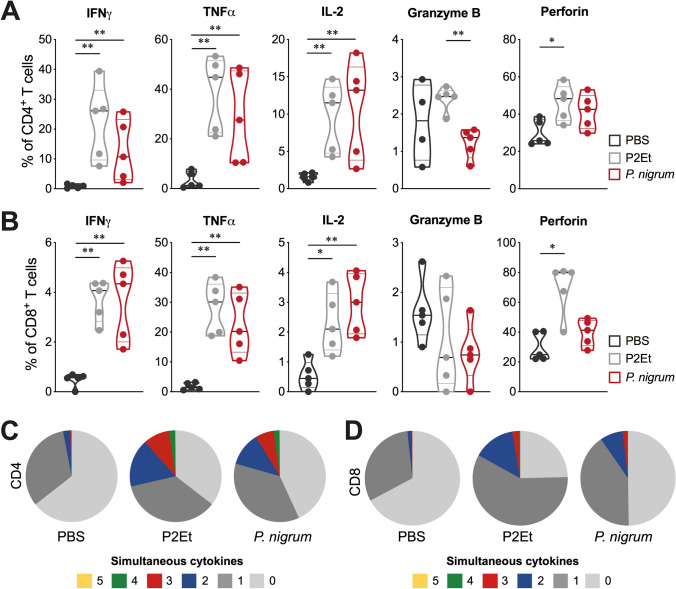
Although the antitumor effect of P. nigrum has been widely studied, research related to its possible immunomodulatory effects is relatively scarce. Here, the antitumor and immunomodulatory activity of an ethanolic extract of P. nigrum were evaluated in the murine models of 4T1 breast cancer and B16-F10 melanoma. In vitro evaluations showed that the P. nigrum extract has cytotoxic activity, induces apoptotic cell death, and has a pro-oxidant effect in both cell lines, but it regulates glucose uptake differently in both lines, decreasing it in 4T1 but not in B16-F10. P. nigrum extract significantly reduced tumor size in both models and decreased the occurrence of macrometastases in 4T1 model. Evaluation of immune subpopulations by flow cytometry revealed that the P. nigrum extract significantly increases the frequency of dendritic cells and activated CD8+ T cells and decreases the frequency of myeloid-derived suppressor like cells and Tregs in the tumor microenvironment of both models but with different dynamics. Our findings strongly suggest that the P. nigrum extract exerts immunomodulatory functions, slightly related to the modulation of cellular energy metabolism, which could ultimately contribute to the promising antitumor effect of P. nigrum.

Keywords: Antitumor; Breast cancer; Immunomodulation; Melanoma; Piper nigrum; Plant extracts.


Conflict of interest statement

S.F. and C.U. are inventors of a granted patent related to P2Et. SF and CU are partners of the DreemBio company who was a licensee of related patents. The rest of the authors declare no competing interests.

Figures

Fig. 1
Fig. 1
A Top: UPLC-DAD chromatogram of the P. nigrum extract at 254 nm showing the major peaks at different retention times. Bottom: Comparison of compound 3 with the commercial standard (STD) of piperine. B UV spectra of the major peaks identified as (3) piperine, (6) piperolein A, and (7) piperolein B
Fig. 2
Fig. 2
In vitro activity of ethanolic P. nigrum extract. Cell count per cm2 of 4T1 (A) and B16-F10 (B) cells after treatments for 0, 6, 12, and 24 h. Population doubling times (PDT) are shown. Representative contour plots of 4T1 (C) and B16-F10 (D) cells incubated with IC50 and IC50/2 of P. nigrum extract, ethanol (negative control) or IC50 of doxorubicin (positive control) for 24 h. Representative flow cytometry analysis showing necrotic (Annexin V, PI+), late apoptotic (Annexin V+, PI+), early apoptotic (Annexin V+, PI) and viable (Annexin V, PI) cells. Frequency of 4T1 (C) and B16-F10 (D) cells in apoptosis (sum of early and late apoptosis) expressed as mean ± SEM for three independent experiments. Frequency of 4T1 (E) and B16-F10 (F) cells with depolarized membrane evaluated by flow cytometry after treatments for 6 and 12 h. G. Fold change of H2DCFDA MFI after the treatments with IC50 and IC50/5 of P. nigrum extract, IC50 and IC50/5 of P2Et extract, or IC50 of doxorubicin (positive control) for 6, 12, and 24 h in both cell lines. H. Fold change of 2-NBDG MFI after treatments with IC50 and IC50/5 of P. nigrum extract, IC50 and IC50/5 of P2Et extract, or rotenone (positive control) for 6 and 12 h. In all cases, fold change was determined using MFI of each treatment relative to vehicle (ethanol or DMSO). Data of three independent experiments are shown. *p < 0.05; **p < 0.01; **p < 0.001; ***p < 0.0001
Fig. 3
Fig. 3
In vivo P. nigrum treatment delays tumor growth. A. Experimental design to evaluate the effect of P. nigrum extract in 4T1 and B16-F10 tumor bearing mice. Tumor was established by injection of 4T1 and B16-F10 cells in young (6 to 12 weeks old) female BALB/cAnNCrl or C57BL/6NCrl mice and 5 days after tumor cell injection, treatments were administrated two times per week until the end of the experiment. Tumor volume in 4T1 (B) and B16-F10 (C) tumor-bearing mice treated with each treatment. D Bars showing the percentage of mice that developed macrometastasis in 4T1 breast cancer model. E Distribution of multi-organ metastasis of 4T1 tumors for all groups. The numbers on the pies show the mice with macrometastasis and numbers in parenthesis corresponds to the total of mice with macrometastases. The p values were calculated using Kruskal – Wallis and Dunn’s posttest for multiple comparisons. *p < 0.05; **p < 0.01; ****p < 0.0001
Fig. 4
Fig. 4
P. nigrum extract modulates the tumor microenvironment. A Frequency of 4T1 intratumor CD45+ cells in mice treated with P. nigrum, P2Et (positive control), or PBS (negative control). B Overview of the immune cell composition in the 4T1 TME shown in percentage of cells (out of CD45+ cells) on a per-mouse basis. C opt-SNE visualization of clustering of some subpopulations from 4T1 tumor detected by flow cytometry, each dot corresponds to one single cell. D Frequency of activated CD8+ T cells (CD44+). E Frequency of B16-F10 intratumor CD45+ cells in mice groups. F Overview of the immune cell composition in the B16-F10 TME shown in percentage of cells (out of CD45+ cells). G opt-SNE visualization of clustering of some immune subpopulations from B16-F10 tumor. H Frequency of activated CD8+ T cells (CD44+). In all cases, data are represented as the mean ± SEM. The p values were calculated using Mann–Whitney U test. *p < 0.05; **p < 0.01
Fig. 5
Fig. 5
P. nigrum extract modulates the immune response in lymph nodes. A Overview of the immune cell composition in lymph nodes from 4T1 tumor-bearing mice shown in percentage of cells on a per-mouse basis. B. Frequency of activated CD8+ T cells (CD44+). C Overview of the immune cell composition in lymph nodes from B16-F10 tumor-bearing mice shown in percentage of cells on a per-mouse basis. D Frequency of activated CD8+ T cells (CD44+). In all cases, data are represented as the mean ± SEM. The p values were calculated using Mann–Whitney U test. *p < 0.05; **p < 0.01
Fig. 6
Fig. 6
P. nigrum extract enhances the functional activity of the T cells in the breast cancer model. Frequency of CD4+ (A) or CD8+ (B) T cells from spleen producing IFNγ, TNFα, IL-2, granzyme B and perforin following stimulation with PMA/ionomycin (P/I). Functional activity of CD4+ (C) or CD8+ (D) T cells in each mice group determined using a five functions assay to measure simultaneous IFNγ, TNFα, IL-2, granzyme B, and perforin expression after stimulation with P/I. The functional profiles are grouped and color-coded according to the number of simultaneous T cell functions, as shown in the pie charts. Multifunctional analyzes were performed using a Boolean gating strategy with FlowJo v10.8.1 software and subsequently, data were analyzed and plotted with Pestle v2.0 and SPICE v6.1 software. Data are presented by violin plots showing all points with its corresponding median *p < 0.05; **p < 0.01
Fig. 7
Fig. 7
P. nigrum extract modulates the functional activity of the T cells in the melanoma model. Frequency of CD4+ (A) or CD8+ (B) T cells from spleen producing IFNγ, TNFα, IL-2, granzyme B and perforin following stimulation with PMA/ionomycin (P/I). Functional activity of CD4+ (C) or CD8+ (D) T cells in each mice group determined using a five functions assay to measure simultaneous IFNγ, TNFα, IL-2, granzyme B, and perforin expression after stimulation with P/I. The functional profiles are grouped and color-coded according to the number of simultaneous T cell functions, as shown in the pie charts. Multifunctional analyzes were performed using a Boolean gating strategy with FlowJo v10.8.1 software and subsequently, data was analyzed and plotted with Pestle v2.0 and SPICE v6.1 software. Data are presented by violin plots showing all points with its corresponding median *p < 0.05; **p < 0.01

Similar articles

Cited by

References

    1. Asprey G, Thornton P. Medical plants of Jamaica. The West Indian Med J. 1954;3:17–41. - PubMed
    1. Domínguez XA, Alcorn JB. Screening of medicinal plants used by Huastec Mayans of northeastern Mexico. J Ethnopharmacol. 1985;13:139–156. doi: 10.1016/0378-8741(85)90002-9. - DOI - PubMed
    1. Kirtikar K, Basu B (1935) Indian medicinal plants. Indian Medicinal Plants
    1. Ahmad N, Fazal H, Abbasi BH, Farooq S, Ali M, Khan MA. Biological role of Piper nigrum L. (Black pepper): a review. Asian Pac J Trop Biomed. 2012;2:S1945–S1953. doi: 10.1016/S2221-1691(12)60524-3. - DOI
    1. Turrini E, Sestili P, Fimognari C. Overview of the Anticancer Potential of the "King of Spices" Piper nigrum and its Main Constituent Piperine. Toxins (Basel) 2020 doi: 10.3390/toxins12120747. - DOI - PMC - PubMed