. 2023 Jul 18;11(1):118.
doi: 10.1186/s40478-023-01603-z.

Alterations in iron content, iron-regulatory proteins and behaviour without tau pathology at one year following repetitive mild traumatic brain injury

Affiliations

Alterations in iron content, iron-regulatory proteins and behaviour without tau pathology at one year following repetitive mild traumatic brain injury

Sydney M A Juan et al. Acta Neuropathol Commun. .

Abstract

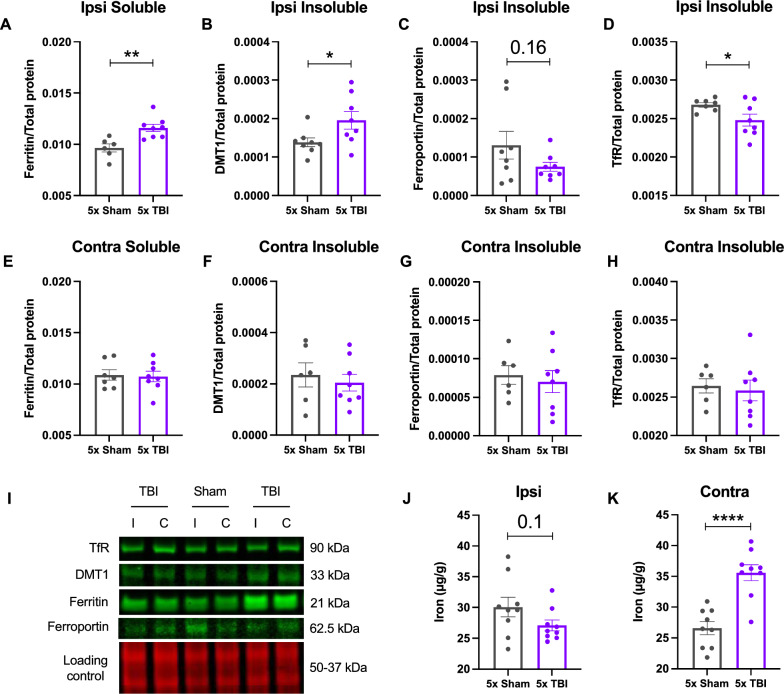
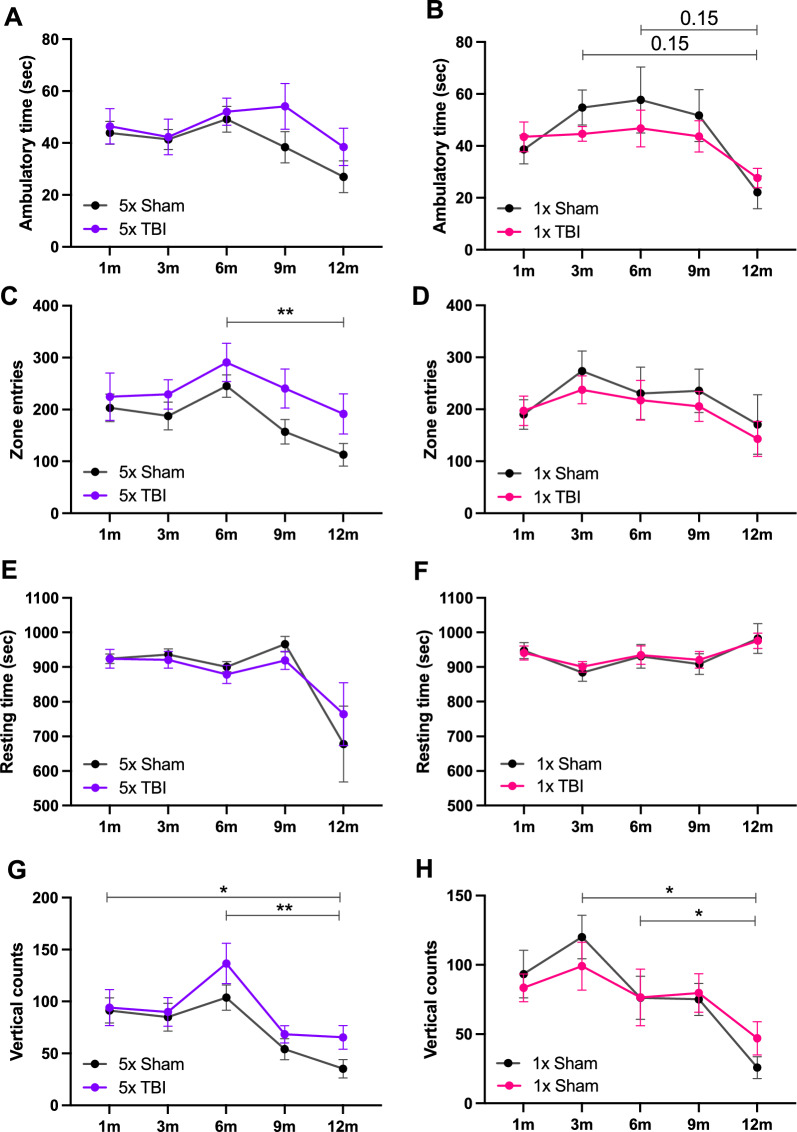
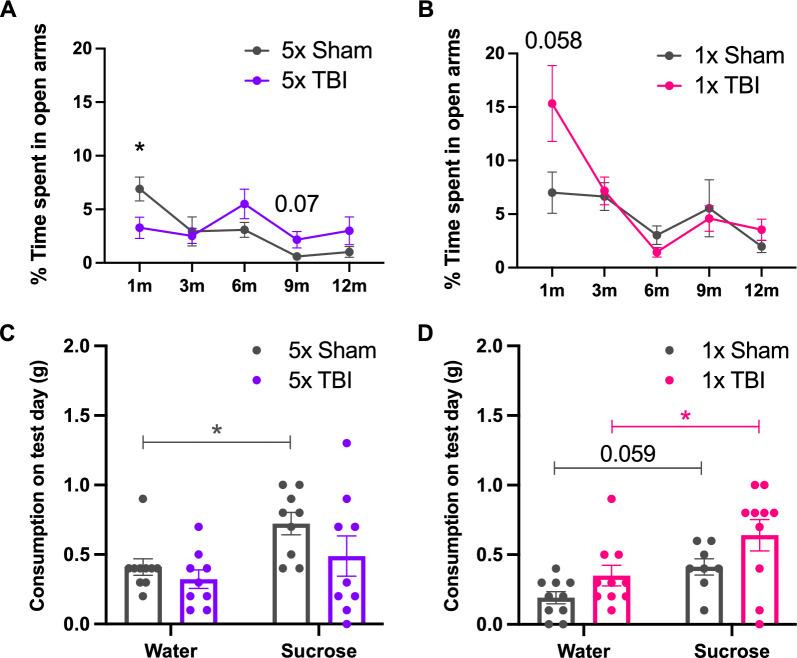
Repetitive mild traumatic brain injury (r-mTBI) has increasingly become recognised as a risk factor for the development of neurodegenerative diseases, many of which are characterised by tau pathology, metal dyshomeostasis and behavioural impairments. We aimed to characterise the status of tau and the involvement of iron dyshomeostasis in repetitive controlled cortical impact injury (5 impacts, 48 h apart) in 3-month-old C57Bl6 mice at the chronic (12-month) time point. We performed a battery of behavioural tests, characterised the status of neurodegeneration-associated proteins (tau and tau-regulatory proteins, amyloid precursor protein and iron-regulatory proteins) via western blot; and metal levels using bulk inductively coupled plasma-mass spectrometry (ICP-MS). We report significant changes in various ipsilateral iron-regulatory proteins following five but not a single injury, and significant increases in contralateral iron, zinc and copper levels following five impacts. There was no evidence of tau pathology or changes in tau-regulatory proteins following five impacts, although some changes were observed following a single injury. Five impacts resulted in significant gait deficits, mild anhedonia and mild cognitive deficits at 9-12 months post-injury, effects not seen following a single injury. To the best of our knowledge, we are the first to describe chronic changes in metals and iron-regulatory proteins in a mouse model of r-mTBI, providing a strong indication towards an overall increase in brain iron levels (and other metals) in the chronic phase following r-mTBI. These results bring to question the relevance of tau and highlight the involvement of iron dysregulation in the development and/or progression of neurodegeneration following injury, which may lead to new therapeutic approaches in the future.

Keywords: Iron-regulatory proteins; Metal dyshomeostasis; Neurodegeneration; Repetitive mild traumatic brain injury; Tau phosphorylation.


Conflict of interest statement

The authors declare that no financial and non-financial competing interests exist.

Figures

Fig. 1
Fig. 1
Experimental timeline and design. Timeline of injury induction for the experimental groups: 1x Sham, 1x TBI, 5x Sham and 5x TBI, and the animals were anaesthetised prior to each injury (left). Experimental timeline of behavioural, RNA sequencing, biochemical and metal analyses post-TBI (right)
Fig. 2
Fig. 2
Multidimensional scaling (MDS) plots for each variable. A MDS plot of 5x Sham and 5x TBI animals revealed no clustering of samples by treatment group. B MDS plot of ipsilateral and contralateral hemispheres revealed no clustering of samples by hemisphere. C MDS plot of male and female animals revealed clustering of samples by sex. n = 10 Sham, 10 TBI (5 of each sex per treatment group for both hemispheres, total n = 40 samples)
Fig. 3
Fig. 3
Heatmap of hierarchical clustering of samplesfor the top 50 most variable genes in the dataset. The colour key represents Z scores, where a value of 0 indicates average gene expression, -2 indicates underexpression and + 3 indicates overexpression. This heatmap further demonstrates clustering of genes by sex
Fig. 4
Fig. 4
Differential gene expression (DGE) analysis. A Table as outputted from RStudio of the comparisons made for DGE analysis. Sham versus TBI comparisons yielded no differentially expressed genes, but the Male versus Female comparisons yielded a number of differentially expressed genes. B Histogram of P-values exhibit a uniform distribution for the Sham vs. TBI comparison, indicating no significant difference. C Histogram of P-values have a higher frequency at smaller significant P-values and a lower frequency at higher non-significant P-values for the Male vs. Female comparison, indicating a significant difference. D List of the 10 most differentially expressed genes from the Males versus Females comparison, all genes are located on sex chromosomes. E Stripchart of normalised log2 expression levels of individual samples for the most differentially expressed “Xist” gene (significant) in Males vs. Females, which is located on the X chromosome. F Stripchart of normalised log2 expression levels of individual samples for the most differentially expressed “Tbc1d19” gene (not significant) in Sham vs. TBI, which is a protein-coding gene located on chromosome 4 that is predicted to act as a GTPase activating protein. Plots in B, C, E and F were generated in RStudio
Fig. 5
Fig. 5
Expression of iron-regulatory proteins and total iron content in mice following single or r-mTBI. Iron-regulatory proteins (A-I) and total iron content (J and K) in the ipsilateral and contralateral hemispheres of the parietal cortex (injury site) following five impacts at 12 months post-injury. Iron-regulatory proteins were measured by western blot and total iron content via ICP-MS. (A) Significant increase in ferritin in the ipsilateral soluble fraction of 5x TBI animals compared to Shams. B Significant increase in DMT1, C trend towards a decrease in ferroportin and D significant decrease in transferrin receptor (TfR) in the ipsilateral insoluble fraction of 5x TBI animals compared to Shams, respectively. E No significant differences in ferritin in the contralateral soluble fraction of 5x TBI animals compared to Shams. No significant differences in DMT1 (F), ferroportin G or transferrin receptor H in the contralateral insoluble fraction of 5x TBI animals compared to Shams. I Representative western blot images correspond to the hemisphere and fraction of the protein depicted in the graph. Example of a loading control blot for ferritin from the 5 hit group. J ICP-MS revealed no changes in total iron content in the ipsilateral hemisphere of 5x TBI animals compared to Shams. K Significant increase in total iron content within the contralateral hemisphere of 5x TBI animals compared to Shams. Note that each of the antibodies were run on separate blots but are represented herein as a composite image for the purpose of clarity. Unpaired two-tailed Student’s t-test. Data expressed as mean ± SEM, *P < 0.05, **P < 0.01, ****P < 0.0001, n = 6–9 (Sham), n = 8–9 (TBI)
Fig. 6
Fig. 6
Expression profile of neurodegeneration-associated proteins in mice following single or r-mTBI. Western blots in the parietal cortex following five (A) and one (B) impact at 12 months post-injury. A-I to A-VII Following five impacts, there were no significant changes in the expression of any proteins of interest at 12 months post-injury. B-III Following one impact, there was a significant increase in T22 oligomeric tau and (B-VI) a trend towards increased Thr231 in the soluble fraction of the contralateral hemisphere at 12 months post-injury. B-II, IV, V and VII There were no other changes in the expression of other proteins of interest at 12 months post-injury. Representative western blot images (A-I and B-I) correspond to the hemisphere and fraction of the protein depicted in the graph. Example of a loading control blot for Total tau from the 5 hit group (A-I) and the 1 hit group (B-I). All phospho-tau proteins are normalised to total protein content and total tau of each sample. Note that each of the antibodies were run on separate blots but are represented herein as a composite image for the purpose of clarity. Unpaired two-tailed Student’s t-test. Data expressed as mean ± SEM, *P < 0.05, n = 7 (Sham), n = 8 (TBI)
Fig. 7
Fig. 7
Expression of iron-regulatory proteins and total iron content in mice following single or r-mTBI. Iron-regulatory proteins (A-I) and total iron content (J and K) in the ipsilateral and contralateral hemispheres of the parietal cortex at 12 months post-injury. (A-II to VII) Following five impacts, there were no significant changes in the expression of any proteins of interest at 12 months post-injury despite a slight trend towards increased Pin1 in the ipsilateral insoluble fraction (A-III). B-II to VII Following one impact, there were no significant changes in the expression of any proteins at 12 months post-injury, despite a trend towards increased levels of PP2A-a subunit (B-V) in the contralateral insoluble fraction. Representative western blot images (A-I and B-I) correspond to the hemisphere and fraction of the protein depicted in the graph. Example of a loading control blot for PME1 from the 5 hit group (A-I) and the 1 hit group (B-I). Note that each of the antibodies were run on separate blots but are represented herein as a composite image for the purpose of clarity. Unpaired two-tailed Student’s t-test. Data expressed as mean ± SEM, *P < 0.05, n = 7 (Sham), n = 7–8 (TBI)
Fig. 8
Fig. 8
Neurological status in mice following single or r-mTBI. Assessment of neurological status using the mNSS test following five (A) and one (B) impact at 1, 3, 6, 9 and 12 months post-injury. (A) Significant increase in mNSS scores following five impacts compared to Shams at 1-month post-injury, with no differences thereafter. (B) No significant differences in mNSS scores following one impact across all time points. Two separate cohorts of animals were used at 1–6 and 9–12 months post-injury for both injury groups, represented by a gap on the x-axis. A Two-way repeated measures ANOVA (1–6 months) and a mixed-effects analysis (9–12 months) were conducted separately for each cohort. Because both cohorts followed similar trends, the data are presented on the same graph solely for illustrative purposes. Note that the 1-month time point presented in this figure has been previously published elsewhere [44] and that the authors have obtained permission to re-use this data. Data expressed as mean ± SEM, #P < 0.05, ##p < 0.01, ****P < 0.0001, n = 7–10 (Sham), n = 9–10 (TBI), * indicates a significant difference between Sham and TBI animals, # indicates a significant difference within Sham animals across time points
Fig. 9
Fig. 9
Locomotor activity in mice following single or r-mTBI. Locomotor activity following five (A, C, E and G) and one (B, D, F and H) impact at 1, 3, 6, 9 and 12 months post-injury . There were no significant changes in all four parameters between TBI and Sham animals across both injury groups. On average (not significant), A 5x TBI animals spent more time being ambulatory than Shams, B 1x TBI animals spent less time being ambulatory than Shams, C 5x TBI animals made more zone entries than Shams, D 1x TBI animals made less zone entries than Shams, E and F no major differences in resting time for 5x and 1x TBI animals compared to their respective Shams, G 5x TBI animals made more vertical counts than Shams, (H) 1x TBI animals on average made less vertical counts up to 6 months which was reversed up to 12 months post-injury. Mixed effects analysis with Holm-Sidak post-hoc for all graphs except for (D and F) which were analysed by two-way repeated measures ANOVA due to no missing values. Data expressed as mean ± SEM, *P < 0.05, **P < 0.01, n = 8–10/group, * indicates a significant difference within Sham animals across time points
Fig. 10
Fig. 10
Assessment of gait in mice following single or r-mTBI. Gait deficits assessed using DigiGait following five impacts at 1, 3, 6, 9 and 12 months post-injury. A Swing is significantly increased at 9 months following 5x TBI compared to Shams. B %SwingStride is significantly increased at 9 months following 5x TBI compared to Shams. C Significant increase in midline distance at 9 and 12 months following 5x TBI versus Shams. D %PropelStride is significantly decreased at 9 and 12 months following 5x TBI versus Shams. E Significant increase in stance width at 9 months following 5x TBI compared to Shams. Mixed-effects analysis and uncorrected Fisher’s LSD post-hoc. Data expressed as mean ± SEM, *P < 0.05, **P < 0.01, n = 9–10 (Sham), n = 8–10 (TBI), * indicates a significant difference between TBI and Sham animals at a specific time point
Fig. 11
Fig. 11
Anxiety-like and depressive-like behaviours in mice following single or r-mTBI. Assessment of anxiety-like behaviour on the Elevated Plus Maze (A and B) and depressive-like behaviour with the Sucrose Preference Test (C and D) following five (A and C) and one (B and D) impact at 1, 3, 6, 9 and 12 months post-injury (for the EPM) and 12 months post-injury only (for the SPT). Note that the 1-month time point presented in this figure (A and B) has been previously published elsewhere [44] and that the authors have obtained permission to re-use this data. A Significant decrease in time spent in the open arms following 5x TBI at 1 month post-injury. No significant changes thereafter. B Strong trend towards increased time spent in the open arms of the maze in the 1x TBI group compared to Shams at 1-month post-injury with no changes thereafter. C Significant increase in sucrose consumption in the Sham group only. D Significant increase in sucrose consumption in the 1x TBI group with a strong trend towards increased sucrose consumption in the Sham group. A and B Mixed-effects analysis with uncorrected Fisher’s LSD post-hoc. C and D Ordinary Two-way ANOVA with Holm-Sidak post-hoc. Data expressed as mean ± SEM, *P < 0.05, n = 9–10/group
Fig. 12
Fig. 12
Cognitive testing in mice following single or r-mTBI. Assessment of spatial learning and memory on the Morris Water Maze (A and B) and short-term memory on the Y-maze (C) following five (A and C-I) and one (B and C-II) impact at 12 months (A and B) and 1, 3, 6, 9 and 12 months (C) post-injury. At 12 months following five impacts, there were (A-I) no significant changes in average trial duration across all days, (A-II) no differences in time spent in the correct quadrant on the Probe day but (A-III) there was a significant decrease in total bouts made to the platform on the Probe day in the 5x TBI group. At 12 months following one impact, there were (B-I) no changes in average trial duration across all days, (B-II) no differences in time spent in the correct quadrant on the Probe day and (B-III) no differences in total bouts made to the platform on the Probe day. No significant changes in time spent in the novel arm following (C-I) five impacts or (C-II) one impact across all time points post-injury. A-I Two-way repeated measures ANOVA with Hold-Sidak post-hoc, B-I mixed-effects analysis with Holm-Sidak post-hoc, (A-II, III and B-II, III) unpaired two-tailed Student’s t-test and (C) mixed-effects analysis with Holm-Sidak post-hoc. Data expressed as mean ± SEM, *P < 0.05, n = 7–10 (Sham), n = 8–10 (TBI)

Similar articles

Cited by

References

    1. Xiong Y, Mahmood A, Chopp M. Animal models of traumatic brain injury. Nat Rev Neurosci. 2013;14:128–142. doi: 10.1038/nrn3407. - DOI - PMC - PubMed
    1. Nguyen R, Fiest KM, McChesney J, Kwon C-S, Jette N, Frolkis AD, et al. The International Incidence of Traumatic Brain Injury: a systematic review and Meta-analysis. Can J Neurol Sci. 2016;43:774–785. doi: 10.1017/cjn.2016.290. - DOI - PubMed
    1. Feigin VL, Theadom A, Barker-Collo S, Starkey NJ, McPherson K, Kahan M, et al. Incidence of traumatic brain injury in New Zealand: a population-based study. Lancet Neurol. 2013;12:53–64. doi: 10.1016/S1474-4422(12)70262-4. - DOI - PubMed
    1. Hicks R, Smith D, Lowenstein D, Marie RS, McIntosh T. Mild experimental brain injury in the rat induces cognitive deficits associated with regional neuronal loss in the hippocampus. J Neurotrauma. 1993;10:405–414. doi: 10.1089/neu.1993.10.405. - DOI - PubMed
    1. Blennow K, Brody DL, Kochanek PM, Levin H, McKee A, Ribbers GM, et al. Traumatic brain injuries. Nat reviews Disease primers. 2016;2:e16084–e16084. doi: 10.1038/nrdp.2016.84. - DOI - PubMed

Publication types