. 2023 Jul 18;15(1):53.
doi: 10.1186/s13073-023-01205-3.

Single-cell RNA-seq reveals alterations in peripheral CX3CR1 and nonclassical monocytes in familial tauopathy

Affiliations

Single-cell RNA-seq reveals alterations in peripheral CX3CR1 and nonclassical monocytes in familial tauopathy

Daniel W Sirkis et al. Genome Med. .

Abstract

Background: Emerging evidence from mouse models is beginning to elucidate the brain's immune response to tau pathology, but little is known about the nature of this response in humans. In addition, it remains unclear to what extent tau pathology and the local inflammatory response within the brain influence the broader immune system.

Methods: To address these questions, we performed single-cell RNA sequencing (scRNA-seq) of peripheral blood mononuclear cells (PBMCs) from carriers of pathogenic variants in MAPT, the gene encoding tau (n = 8), and healthy non-carrier controls (n = 8). Primary findings from our scRNA-seq analyses were confirmed and extended via flow cytometry, droplet digital (dd)PCR, and secondary analyses of publicly available transcriptomics datasets.

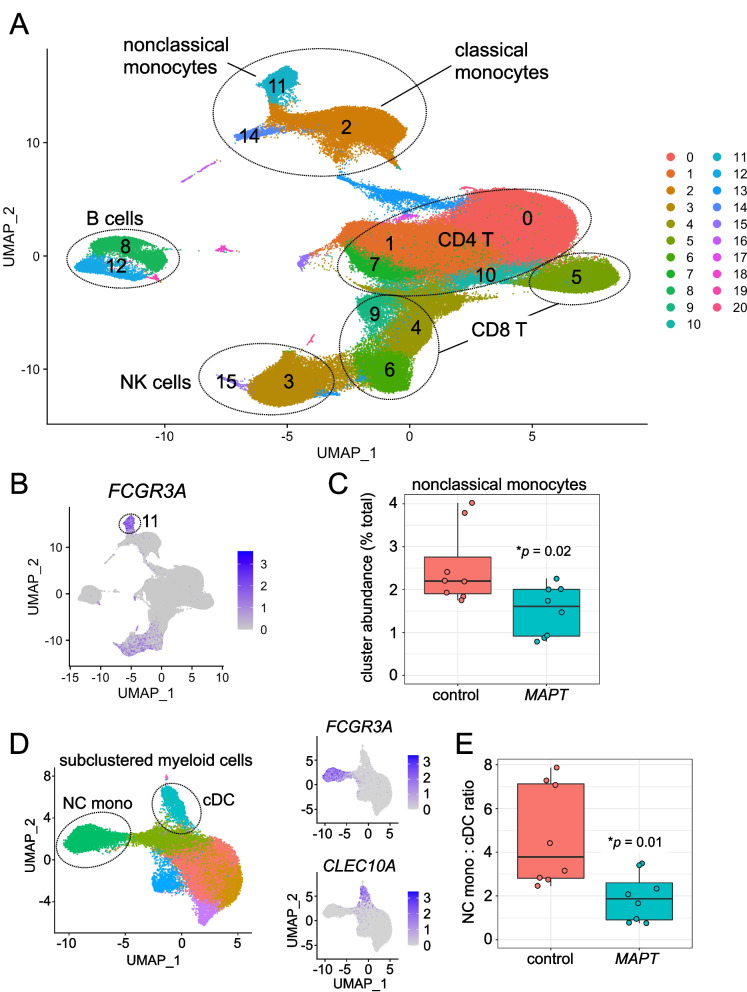
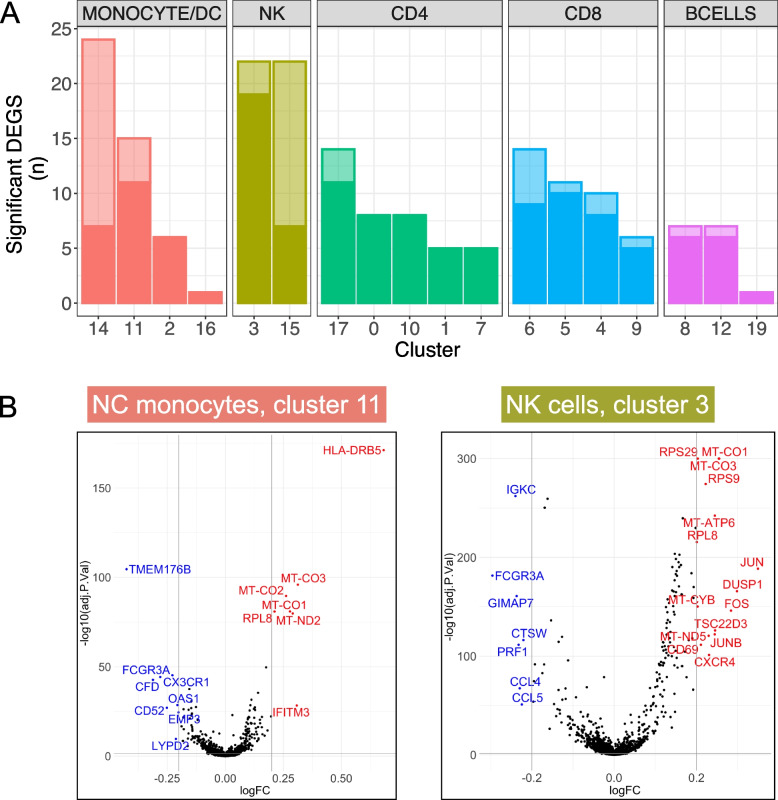
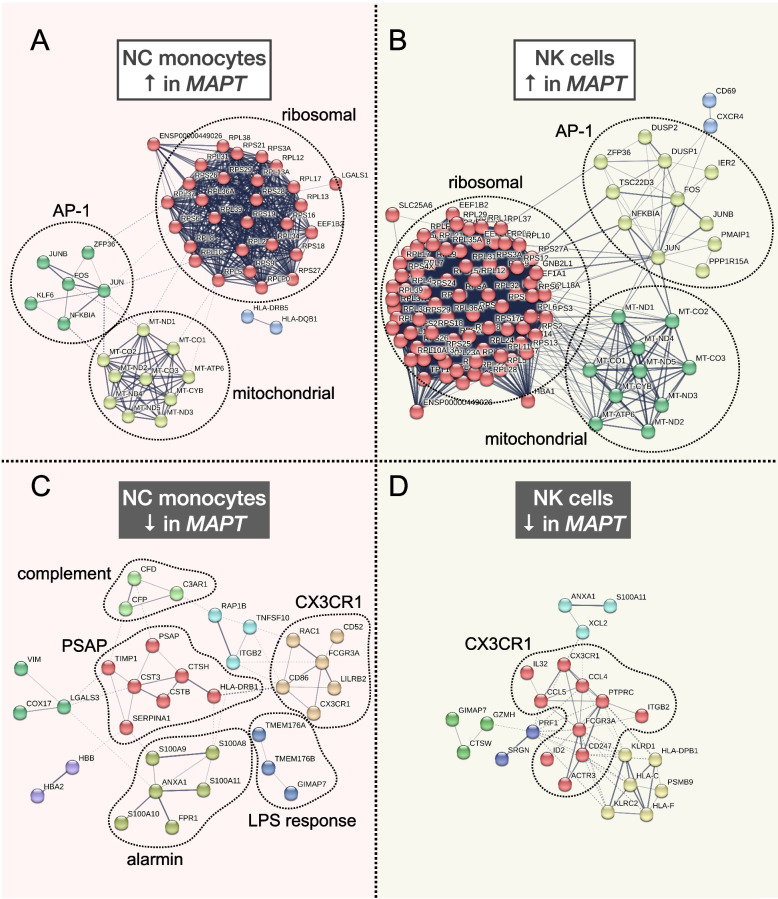
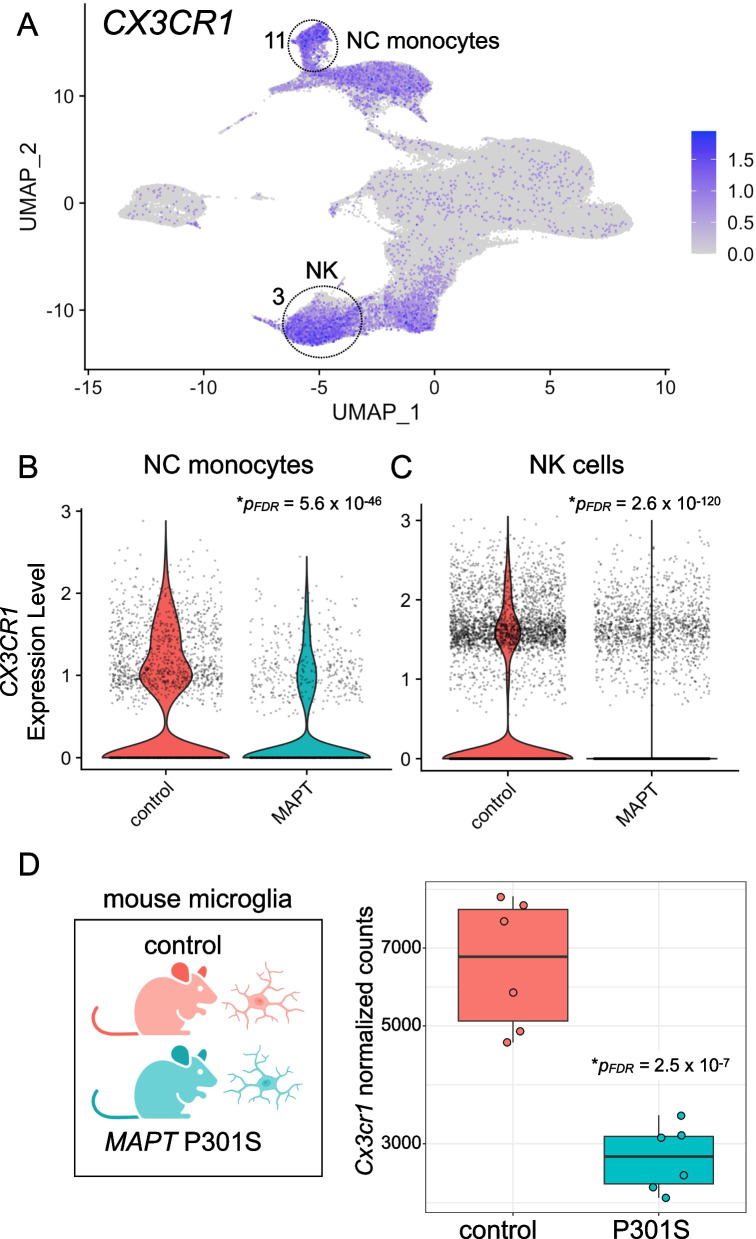
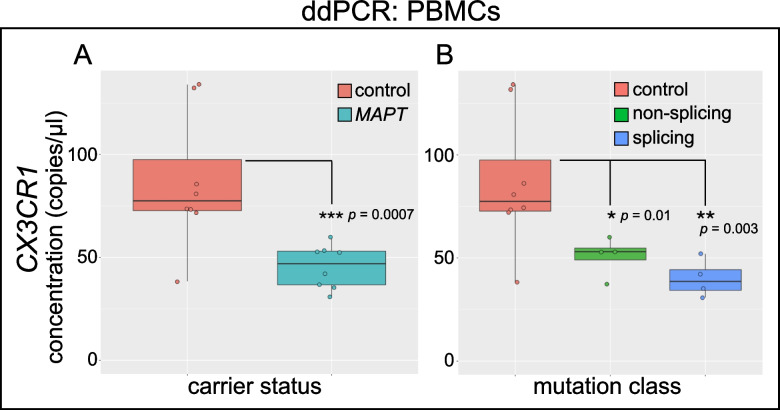
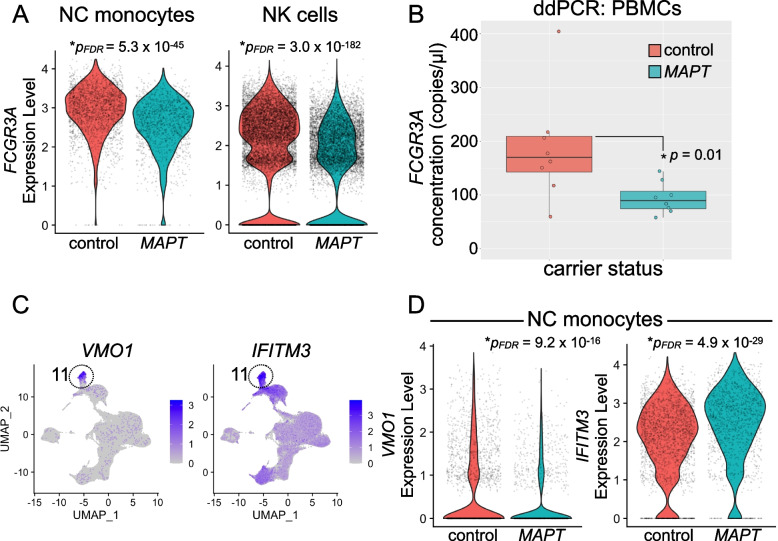
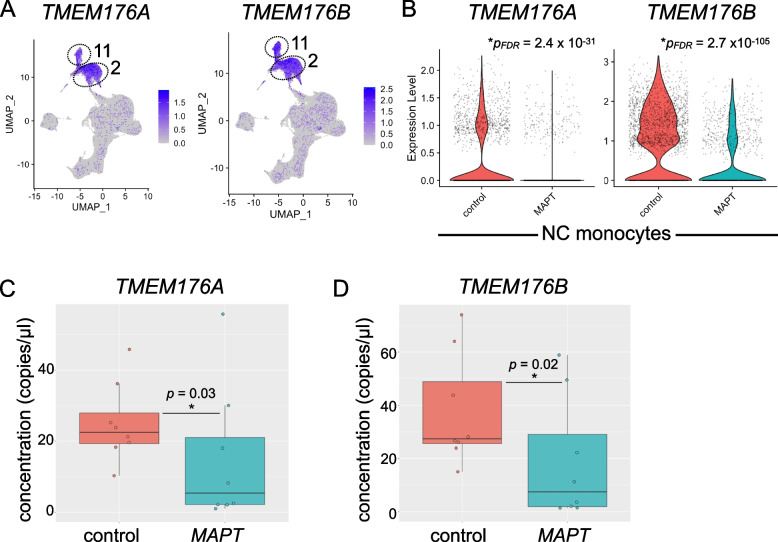
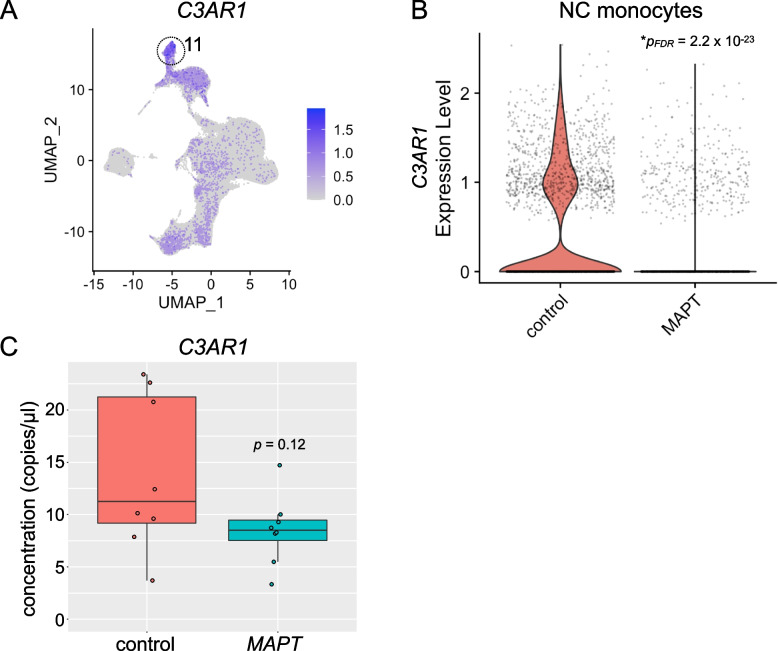
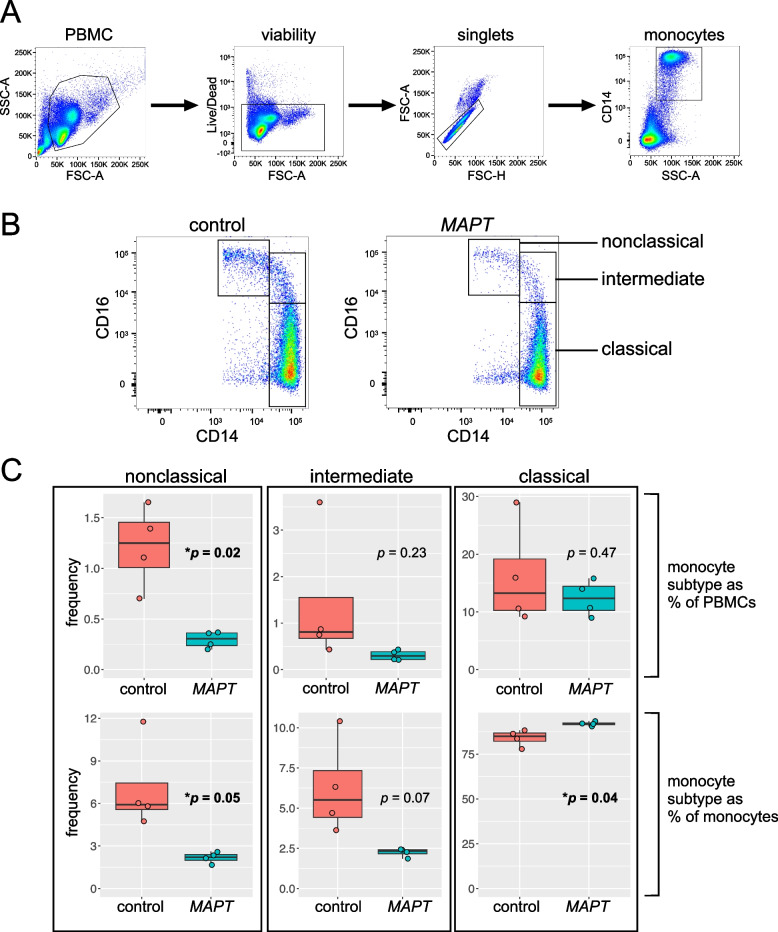
Results: Analysis of ~ 181,000 individual PBMC transcriptomes demonstrated striking differential expression in monocytes and natural killer (NK) cells in MAPT pathogenic variant carriers. In particular, we observed a marked reduction in the expression of CX3CR1-the gene encoding the fractalkine receptor that is known to modulate tau pathology in mouse models-in monocytes and NK cells. We also observed a significant reduction in the abundance of nonclassical monocytes and dysregulated expression of nonclassical monocyte marker genes, including FCGR3A. Finally, we identified reductions in TMEM176A and TMEM176B, genes thought to be involved in the inflammatory response in human microglia but with unclear function in peripheral monocytes. We confirmed the reduction in nonclassical monocytes by flow cytometry and the differential expression of select biologically relevant genes dysregulated in our scRNA-seq data using ddPCR.

Conclusions: Our results suggest that human peripheral immune cell expression and abundance are modulated by tau-associated pathophysiologic changes. CX3CR1 and nonclassical monocytes in particular will be a focus of future work exploring the role of these peripheral signals in additional tau-associated neurodegenerative diseases.

Keywords: CX3CR1; Dementia; MAPT; Microglia; Neurodegeneration; Nonclassical monocytes; PBMCs; Single-cell RNA-seq; Tau; Tauopathy.


Conflict of interest statement

JSY serves on the scientific advisory board for the Epstein Family Alzheimer’s Research Collaboration. ALB has served as a consultant for Aeovian, AGTC, Alector, Arkuda, Arvinas, AviadoBio, Boehringer Ingelheim, Denali, GSK, Life Edit, Humana, Oligomerix, Oscotec, Roche, Transposon, TrueBinding and Wave. The remaining authors declare that they have no competing interests.

Figures

Fig. 1
Fig. 1
Single-cell RNA-seq reveals reductions in nonclassical monocytes in MAPT pathogenic variant carriers. A Two-dimensional UMAP plot of ~ 181,000 PBMCs from MAPT variant carriers and non-carrier controls, colored by cluster identity. Major cell types are labeled within the plot. B, C Cluster 11, marked by high FCGR3A expression and identified as NC monocytes, was significantly reduced in MAPT carriers (p = 0.02; data are expressed as percentage of total PBMCs for each sample). D Myeloid cells (clusters 2, 11, 14) were subset and re-clustered. NC monocyte and cDC2 subclusters were identified by FCGR3A and CLEC10A expression, respectively (D, right). E The ratio of NC monocytes to cDC2 was significantly reduced in MAPT variant carriers (p = 0.01)
Fig. 2
Fig. 2
Differential expression in MAPT variant carriers by cell cluster. A Clusters are grouped by cell type and ranked by the number of DEGs with pFDR < 0.05 and absolute LFC > 0.2. Differential expression was determined in MAPT variant carriers relative to non-carrier controls while covarying for age, sex, and scRNA-seq batch. Solid-colored portions of the bars indicate DEGs shared by at least one other cluster, while the translucent portions indicate DEGs unique to a given cluster. cDCs (cluster 14), NK cells (clusters 3 and 15), and NC monocytes (cluster 11) had the highest numbers of DEGs with absolute LFC > 0.2. B Volcano plots of the NC monocyte cluster and major NK cell cluster; DEGs with absolute LFC > 0.2 are labeled in blue (downregulated) or red (upregulated). Several NK cell DEGs (right) with − log10(pFDR) values > 300 were set to 300 for visualization purposes
Fig. 3
Fig. 3
STRING interaction networks reveal relationships among nonclassical monocyte and natural killer cell differentially expressed genes. A, B Upregulated DEGs in NC monocytes and NK cells had similar overall network architecture, with large ribosomal and mitochondrial modules, and a third module containing members of the AP-1 transcription factor, among other genes. C The downregulated DEGs in NC monocytes contained a module featuring CX3CR1 and FCGR3A as members, in addition to modules harboring genes involved in LPS response, the alternative and classical complement cascades, the S100 alarmin molecules, as well as PSAP. D Downregulated DEGs in NK cells also featured a large module featuring both CX3CR1 and FCGR3A. All DEGs with pFDR < 0.05 and absolute LFC > 0.1 from clusters 3 and 11 were input into the STRING database as described in the “Methods” section. Modules are colored according to the results of MCL clustering
Fig. 4
Fig. 4
CX3CR1 expression is reduced in peripheral myeloid and lymphoid cells in familial tauopathy. A CX3CR1 is robustly expressed in both NC monocytes (cluster 11) and NK cells (cluster 3). NC monocytes (B; pFDR = 5.6 × 10−46) and NK cells (C; pFDR = 2.6 × 10−120) both show significantly reduced expression of CX3CR1 in MAPT pathogenic variant carriers. D Reanalysis of publicly available bulk RNA-seq data from mouse hippocampal CD11b+ microglia demonstrated a significant reduction (pFDR = 2.5 × 10−7) of Cx3cr1 in the MAPT P301S model
Fig. 5
Fig. 5
Confirmation of reduced CX3CR1 expression in MAPT variant carrier PBMCs via ddPCR. RNA was isolated from PBMCs from MAPT variant carriers and healthy, non-carrier controls; gene expression was determined by RT-ddPCR. A CX3CR1 was significantly reduced in MAPT carrier PBMCs (p = 0.0007) relative to controls. B Separation of samples according to MAPT variant class (non-splicing and splicing) reveals that CX3CR1 was significantly reduced in both groups, relative to controls (non-splicing, p = 0.01; splicing, p = 0.003)
Fig. 6
Fig. 6
Analysis of nonclassical monocyte marker genes in MAPT variant carriers. A FCGR3A, the NC monocyte marker gene encoding CD16, is robustly expressed not only in NC monocytes but also in NK cells. FCGR3A is significantly reduced in both NC monocytes (left; pFDR = 5.3 × 10−45) and NK cells (right; pFDR = 3.0 × 10−182) in MAPT pathogenic variant carriers. B ddPCR confirmed a reduction in FCGR3A reduction in MAPT variant carrier PBMCs (p = 0.01). C Additional genes expressed specifically (VMO1, left) or enriched in (IFITM3, right) NC monocytes showed significant alterations (D) in MAPT variant carrier NC monocytes. D VMO1 (left) was significantly reduced (pFDR = 9.2 × 10−16), while IFITM3 (right) was significantly increased (pFDR = 4.9 × 10−29) in MAPT carriers
Fig. 7
Fig. 7
Analysis of TMEM176A/B in MAPT pathogenic variant carriers. A TMEM176A/B are highly expressed in both classical (cluster 2) and NC (cluster 11) monocytes. B TMEM176A/B are significantly reduced in NC monocytes (TMEM176A, pFDR = 2.4 × 10−31; TMEM176B, pFDR = 2.7 × 10.−105) from MAPT carriers. These genes were similarly reduced in MAPT carrier classical monocytes (cluster 2; Additional file 5: Table S4). The reduction in TMEM176A (C) and TMEM176B (D) in MAPT variant carriers was confirmed using bulk PBMC RNA and ddPCR (TMEM176A, p = 0.03; TMEM176B, p = 0.02)
Fig. 8
Fig. 8
Potential dysregulation of C3AR1 in MAPT pathogenic variant carriers. A C3AR1 expression was enriched in the NC monocyte cluster (11). B C3AR1 expression in NC monocytes was significantly reduced in MAPT variant carriers (*pFDR = 2.2 × 10.−23). C ddPCR analysis of PBMC RNA revealed a trend toward reduced expression of C3AR1 in MAPT variant carriers which did not reach significance (p = 0.12)
Fig. 9
Fig. 9
Validation of the reduction in nonclassical monocytes via flow cytometry. A Gating scheme for identification and analysis of monocyte subtypes. PBMCs were gated as follows: debris was excluded, non-viable cells were excluded, then doublets were excluded. Next, monocytes were gated based on their high side scatter and CD14 expression. B Monocyte subtypes were gated based on their characteristic CD14 and CD16 expression, with classical monocytes having high CD14 expression and low CD16 expression, intermediate monocytes having high CD14 expression and moderate-to-high CD16 expression, and NC monocytes having low CD14 expression and high CD16 expression. C Quantification of the frequency of NC (left), intermediate (center), and classical monocytes (right), either as a percentage of PBMCs (top row) or all monocytes (bottom row). NC monocytes were reduced in MAPT pathogenic variant carriers as a fraction of PBMCs (upper left, p = 0.02) and as a fraction of monocytes (lower left, p = 0.05). Intermediate monocytes (center) showed a trend toward reduction relative to both PBMCs and monocytes. Classical monocytes (right) showed no change as a fraction of PBMCs but were significantly increased in MAPT pathogenic variant carriers as a fraction of all monocytes

References

    1. Hutton M, Lendon CL, Rizzu P, Baker M, Froelich S, Houlden H, et al. Association of missense and 5’-splice-site mutations in tau with the inherited dementia FTDP-17. Nature. 1998;393:702–705. doi: 10.1038/31508. - DOI - PubMed
    1. Spillantini MG, Murrell JR, Goedert M, Farlow MR, Klug A, Ghetti B. Mutation in the tau gene in familial multiple system tauopathy with presenile dementia. Proc Natl Acad Sci U S A. 1998;95:7737–7741. doi: 10.1073/pnas.95.13.7737. - DOI - PMC - PubMed
    1. Sirkis DW, Geier EG, Bonham LW, Karch CM, Yokoyama JS. Recent advances in the genetics of frontotemporal dementia. Curr Genet Med Rep. 2019;7:41–52. doi: 10.1007/s40142-019-0160-6. - DOI - PMC - PubMed
    1. VandeVrede L, Boxer AL, Polydoro M. Targeting tau: Clinical trials and novel therapeutic approaches. Neurosci Lett. 2020;731:134919. doi: 10.1016/j.neulet.2020.134919. - DOI - PMC - PubMed
    1. Chang CW, Shao E, Mucke L. Tau: Enabler of diverse brain disorders and target of rapidly evolving therapeutic strategies. Science. 2021;371:eabb8255. doi: 10.1126/science.abb8255. - DOI - PMC - PubMed

Publication types