

Glycolytic activity is required for the onset of neural plate folding during neural tube closure in mouse embryos
- PMID: 37465012
- PMCID: PMC10350492
- DOI: 10.3389/fcell.2023.1212375
Glycolytic activity is required for the onset of neural plate folding during neural tube closure in mouse embryos
Abstract
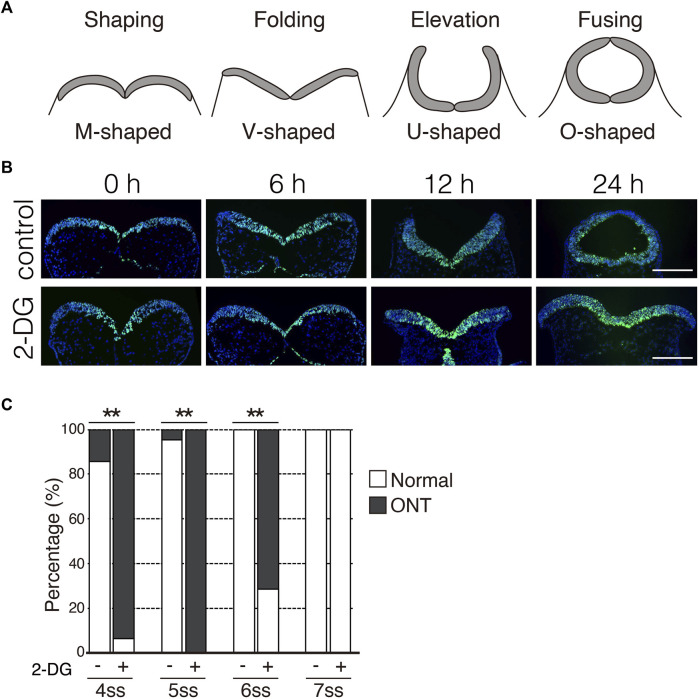
Physiological hypoxia is critical for placental mammalian development. However, the underlying mechanisms by which hypoxia regulates embryonic development remain unclear. We discovered that the expression of glycolytic genes partially depends on hypoxia in neuroepithelial cells of E8.25 mouse embryos. Consistent with this finding, inhibiting glycolysis during the early phase of neural tube closure (E8.0-8.5) resulted in a neural tube closure defect. In contrast, inhibiting the electron transport chain did not affect neural tube formation. Furthermore, inhibiting glycolysis affected cell proliferation, but not differentiation and survival. Inhibiting glycolysis repressed the phosphorylation of myosin light chain 2, and consequent neural plate folding. Our findings revealed that anaerobic glycolysis regulates neuroepithelial cell proliferation and apical constriction during the early phase of neural tube closure.
Keywords: glycolysis; hypoxia; metabolism; mouse; neural tube closure.
Copyright © 2023 Sakai, Murakami, Shigeta, Tomosugi, Sakata-Haga, Hatta and Shoji.
Conflict of interest statement
The authors declare that the research was conducted in the absence of any commercial or financial relationships that could be construed as a potential conflict of interest.
Figures


Similar articles
-
MiR-302 Regulates Glycolysis to Control Cell-Cycle during Neural Tube Closure.Int J Mol Sci. 2020 Oct 13;21(20):7534. doi: 10.3390/ijms21207534. Int J Mol Sci. 2020. PMID: 33066028 Free PMC article.
-
Formin homology 2 domain-containing 3 (Fhod3) controls neural plate morphogenesis in mouse cranial neurulation by regulating multidirectional apical constriction.J Biol Chem. 2019 Feb 22;294(8):2924-2934. doi: 10.1074/jbc.RA118.005471. Epub 2018 Dec 20. J Biol Chem. 2019. PMID: 30573686 Free PMC article.
-
Scribble mutation disrupts convergent extension and apical constriction during mammalian neural tube closure.Dev Biol. 2021 Oct;478:59-75. doi: 10.1016/j.ydbio.2021.05.013. Epub 2021 May 21. Dev Biol. 2021. PMID: 34029538 Free PMC article.
-
Molecular mechanisms of cell shape changes that contribute to vertebrate neural tube closure.Dev Growth Differ. 2012 Apr;54(3):266-76. doi: 10.1111/j.1440-169X.2012.01346.x. Dev Growth Differ. 2012. PMID: 22524600 Review.
-
Single-site neural tube closure in human embryos revisited.Clin Anat. 2017 Oct;30(7):988-999. doi: 10.1002/ca.22977. Epub 2017 Aug 29. Clin Anat. 2017. PMID: 28795440 Review.
Cited by
-
A primer on copper biology in the brain.Neurobiol Dis. 2025 Aug;212:106974. doi: 10.1016/j.nbd.2025.106974. Epub 2025 May 23. Neurobiol Dis. 2025. PMID: 40414313 Free PMC article. Review.
-
Adaptive protein synthesis in genetic models of copper deficiency and childhood neurodegeneration.bioRxiv [Preprint]. 2024 Nov 18:2024.09.09.612106. doi: 10.1101/2024.09.09.612106. bioRxiv. 2024. Update in: Mol Biol Cell. 2025 Mar 01;36(3):ar33. doi: 10.1091/mbc.E24-11-0512. PMID: 39314281 Free PMC article. Updated. Preprint.
-
Adaptive protein synthesis in genetic models of copper deficiency and childhood neurodegeneration.Mol Biol Cell. 2025 Mar 1;36(3):ar33. doi: 10.1091/mbc.E24-11-0512. Epub 2025 Jan 29. Mol Biol Cell. 2025. PMID: 39878654 Free PMC article.
-
The Role of One-Carbon Metabolism and Methyl Donors in Medically Assisted Reproduction: A Narrative Review of the Literature.Int J Mol Sci. 2024 May 2;25(9):4977. doi: 10.3390/ijms25094977. Int J Mol Sci. 2024. PMID: 38732193 Free PMC article. Review.
-
Brain development and bioenergetic changes.Neurobiol Dis. 2024 Sep;199:106550. doi: 10.1016/j.nbd.2024.106550. Epub 2024 Jun 6. Neurobiol Dis. 2024. PMID: 38849103 Free PMC article. Review.
References
-
- Compernolle V., Brusselmans K., Franco D., Moorman A., Dewerchin M., Collen D., et al. (2003). Cardia bifida, defective heart development and abnormal neural crest migration in embryos lacking hypoxia-inducible factor-1alpha. Cardiovasc Res. 60 (3), 569–579. 10.1016/j.cardiores.2003.07.003 - DOI - PubMed
Associated data
LinkOut - more resources
Full Text Sources
Molecular Biology Databases