. 2023 Jul 3:14:1168653.
doi: 10.3389/fmicb.2023.1168653. eCollection 2023.

Microbial community structural and functional differentiation in capped thickened oil sands tailings planted with native boreal species

Affiliations

Microbial community structural and functional differentiation in capped thickened oil sands tailings planted with native boreal species

Abdul Samad et al. Front Microbiol. .

Abstract

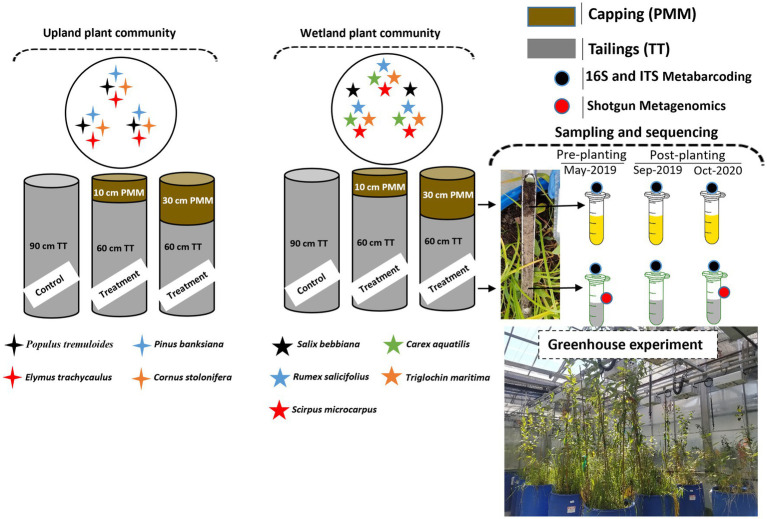
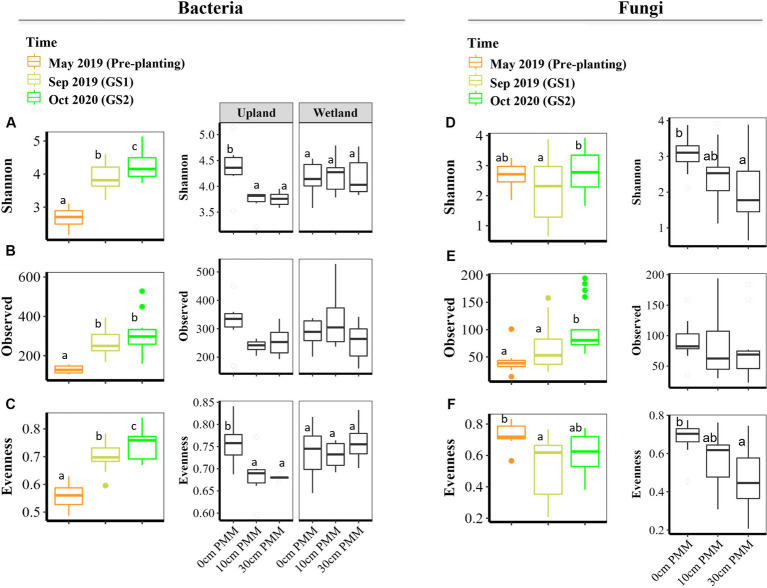
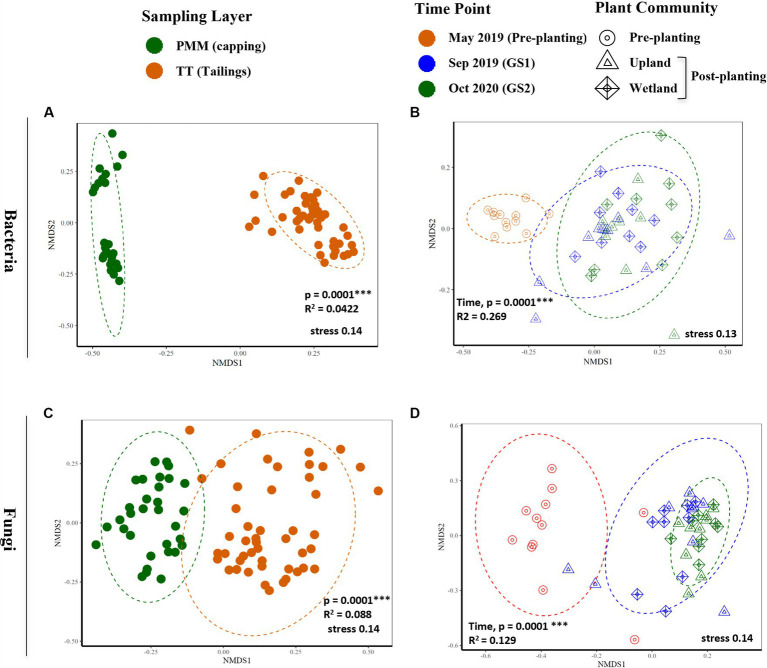
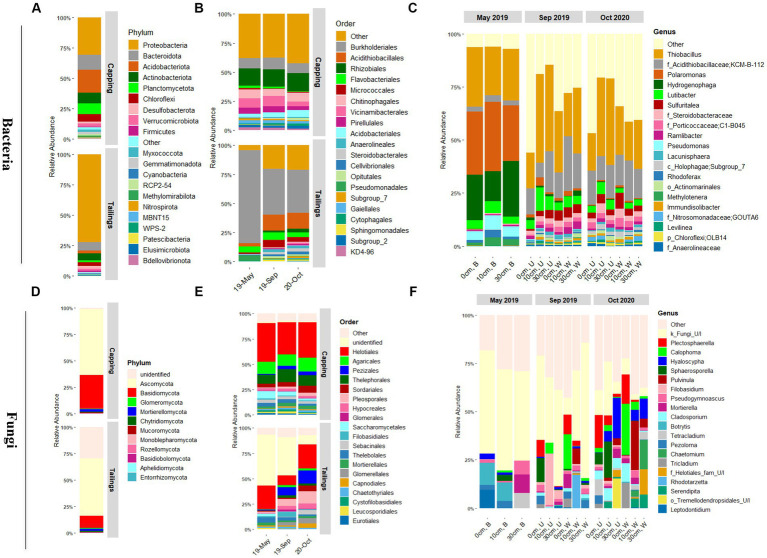
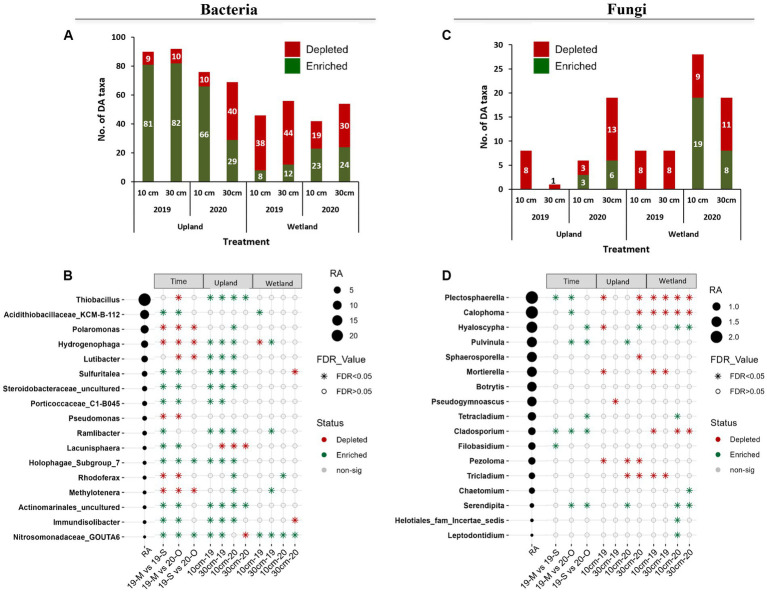
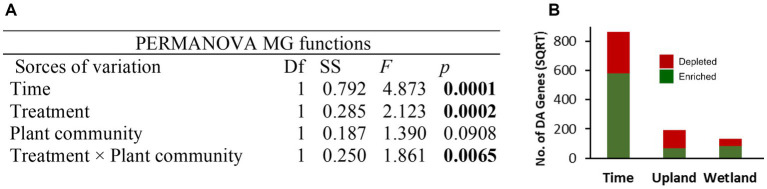
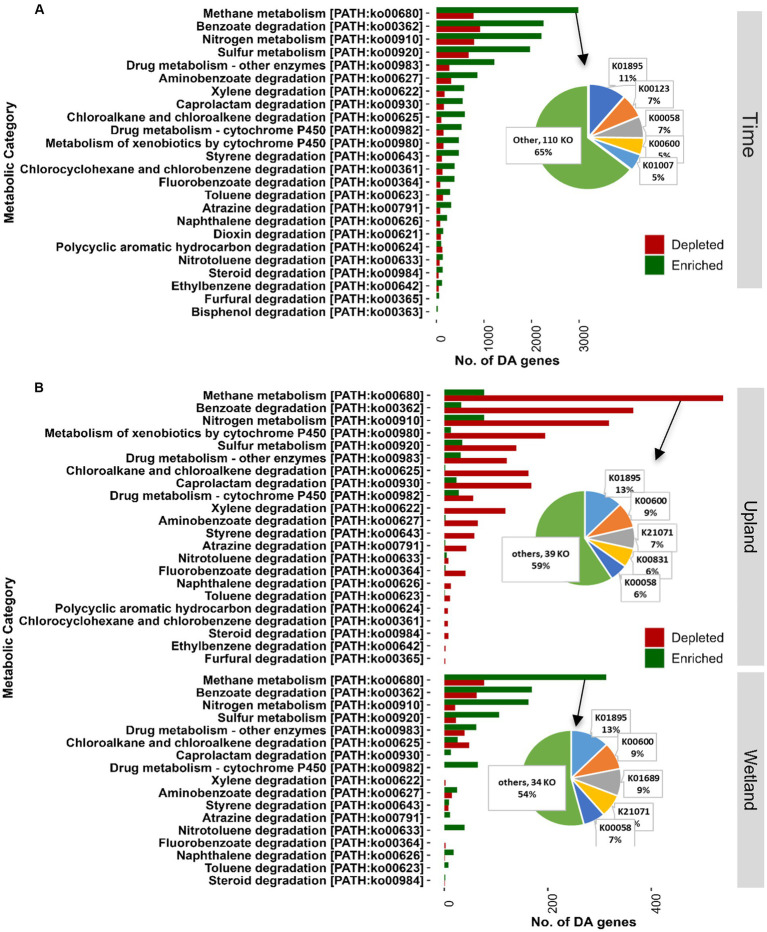
The oil sands mining operations in Alberta have produced billions of m3 of tailings which must be reclaimed and integrated into various mine closure landforms, including terrestrial landforms. Microorganisms play a central role in nutrient cycling during the reclamation of disturbed landscapes, contributing to successful vegetation restoration and long-term sustainability. However, microbial community succession and response in reconstructed and revegetated tailings remain largely unexplored. This study aimed to monitor the structural and functional responses of microbial communities in tailings subjected to different capping and vegetation strategies over two growing seasons (GS). To achieve this, a column-based greenhouse experiment was conducted to investigate microbial communities in tailings that were capped with a layer (10 or 30 cm) of peat-mineral mix (PMM) and planted with either upland or wetland communities. DNA metabarcoding analysis of the bacterial 16S rRNA gene and fungal ITS2 region as well as shotgun metagenomics were used to asses the impact of treatments on microbial taxonomy and functions, respectively. Results showed that tailings microbial diversity and community composition changed considerably after two GS compared to baseline samples, while communities in the PMM capping layer were much more stable. Likewise, several microbial functions were significantly enriched in tailings after two GS. Interestingly, the impact of capping on bacterial communities in tailings varied depending on the plant community, leading to a higher number of differentially abundant taxa and to a decrease in Shannon diversity and evenness in the upland treatment but not in the wetland treatment. Moreover, while capping in the presence of wetland vegetation increased the energy-related metabolic functions (carbon, nitrogen, and sulfur), these functions were depleted by capping in the upland treatment. Fungi represented a small proportion of the microbial community in tailings, but the relative abundance of several taxa changed over time, while the capping treatments favored the growth of some beneficial taxa, notably the root endophyte Serendipita, in both upland and wetland columns. The results suggest that selecting the right combination of capping material and vegetation type may contribute to improve below-ground microbial processes and sustain plant growth in harsh environments such as oil sands tailings.

Keywords: boreal forest; ecological restoration; metabarcoding; metagenomics; oil sands tailings; reclamation; soil microbiology.


Conflict of interest statement

The authors declare that the research was conducted in the absence of any commercial or financial relationships that could be construed as a potential conflict of interest.

Figures

Figure 1
Figure 1
Diagram of experimental design in which upland and wetland plant communities were grown on thickened tailings with or without PMM capping of different depths (10 and 30 cm). A total of 12 plants (indicated by 4-point stars) per column belonging to four different upland plant species and 14 plants (indicated by 5-point stars) per column belonging to five different wetland plant species were planted in upland and wetland columns, respectively. Four columns were assembled for each treatment (n = 4). The tailings and PMM layers were sampled at the start of the experiment (May 2019; Pre-planting baseline), after the first growing season (Sep 2019; GS1), and after the second growing season (Oct 2020; GS2). All samples were subjected to 16S and ITS metabarcoding (indicated by black circles). Tailings samples from baseline and GS2 were also sequenced by shotgun metagenomics (indicated by red circles). TT, thickened tailings; PMM, peat mineral mix.
Figure 2
Figure 2
Alpha diversity indices of bacterial and fungal communities in thickened tailings (TT) samples, determined by Observed ASVs (i.e., richness), Shannon diversity, and Pielou’s evenness for bacteria (A–C) and fungi (D–F). Generalized least squares (gls) models and three-way ANOVA was applied (see Supplementary Table S2) to determine how capping treatments (0, 10, 30 cm), plant communities (upland, wetland) and time points (Sep 2019, Oct 2020) and their interaction influence alpha diversity indices (n = 3). One-way ANOVA was applied to test how microbial communities changed after each growing season compared to pre-planting baseline samples (May 2019). FDR, false discovery rate; May 2019, baseline or pre-planting; Sep 2019, GS1; Oct 2020, GS2.
Figure 3
Figure 3
Non-metric multidimensional scaling (NMDS) based on Bray-Curtis dissimilarities of bacterial (A,B) and fungal (C,D) communities. (A,C) Differences between capping (PMM) and thickened tailings (TT) samples for bacterial and fungal communities, respectively. (B,D) Effect of time on TT samples for bacterial and fungal communities, respectively. p-values indicate statistical differences between capping layers (A,C) and time points (B,D) according to PERMANOVA. FDR-adjusted p < 0.05 was considered statistically significant, as indicated by asterisk, * < 0.05, ** < 0.005, *** < 0.0005. FDR, false discovery rate. Detailed results of PERMANOVA are provided in Table 2.
Figure 4
Figure 4
Taxonomic profiles of microbial communities in thickened tailings and capping material (PMM) as assessed by sequencing the 16S rRNA gene for bacteria (A–C), and ITS2 region for fungi (D–F). (A,D), taxonomic profiles at the phylum level across all samples for the capping (PMM) and tickened tailings (TT) layers. (B,E), taxonomic profiles at the order level as a function of time for the capping and tailing layers. (C,F), taxonomic profiles at the genus level as a function of time, vegetation type, and capping treatment for the tailings layer only. Only 20 most abundant classified bacterial and fungal taxa are shown (n ≥ 3). B, baseline; W, wetland; U, upland; 0 cm, control; U/I, unidentified.
Figure 5
Figure 5
Differential abundance analysis as determined by the ANCOM-BC method for bacteria (A,B) and fungi (C,D). (A,C) Total number of significantly enriched or depleted genera for capping treatments (10 cm vs. control and 30 cm vs. control). (B,D) List of significantly enriched or depleted genera for time point (May 2019 vs. Sep 2019, May 2019 vs. Oct 2020, and Sep 2019 vs. Oct 2020) and capping treatments (10 cm vs. control and 30 cm vs. control). Taxa with more than 0.05% relative abundance (RA) are sorted with decreasing RA. Taxa were considered as differentially abundant only if FDR adjusted p-values were significant (p < 0.05). 19-M, May 2019 (baseline); 19-S, Sep 2019 (GS1); 20-O, Oct 2020 (GS2); 0 cm, control; DA, differentially abundant; FDR, false discovery rate; AN-COMBC, analysis of the composition of microbiomes with bias correction.
Figure 6
Figure 6
Permutational multivariate analysis of variance (PERMANOVA, 9,999 permutations) on Bray–Curtis dissimilarity matrix based on shotgun metagenomic data after normalization of gene abundance table using the geometric mean of pairwise ratios (GMPR) method (A). The total number of differentially abundant (DA) genes are shown for each group comparison between different time points (May 2019 vs. Oct 2020) and caping treatments (30 cm vs. control) of upland and wetland community (B), details of the DA genes are provided in Figure 7. PERMANOVA, permutational multivariate analysis of variance.
Figure 7
Figure 7
Shotgun metagenomics analysis showing KEGG functional categories for energy metabolism (09102, methane, sulfur, and nitrogen) and xenobiotics biodegradation (09111). Differentially abundant genes were identified between different time points (May 2019 vs. Oct 2020; A) and the caping treatments (30 cm vs. control, B). Genes were considered as differentially abundant only if FDR-adjusted p-values were significant (p < 0.05). The list of differentially abundant genes assigned to KEGG Orthology and KEGG functional categories is provided in Supplementary Table S5. 0 cm, control; DA, differentially abundant; FDR, false discovery rate; KEGG, Kyoto Encyclopedia of Genes and Genomes.

Similar articles

References

    1. Abarenkov K., Henrik Nilsson R., Larsson K.-H., Alexander I. J., Eberhardt U., Erland S., et al. . (2010). The UNITE database for molecular identification of fungi--recent updates and future perspectives. New Phytol. 186, 281–285. doi: 10.1111/j.1469-8137.2009.03160.x - DOI - PubMed
    1. Alberta Energy Regulator (2020). State of fluid tailings management for mineable oil sands. Calgary, AB: Alberta Energy Regulator.
    1. Alberta Energy Regulator (2022). Directive 085: fluid tailings management for oil sands mining projects. Calgary, AB: Alberta Energy Regulator.
    1. Berta G., Fusconi A., Hooker J. E. (2002). “Arbuscular mycorrhizal modifications to plant root systems: scale, mechanisms and consequences” in Mycorrhizal technology in agriculture: from genes to bioproducts. eds. Gianinazzi S., Schüepp H., Barea J. M., Haselwandter K. (Basel: Birkhäuser; ), 71–85.
    1. Birnbaum C., Bradshaw L. E., Ruthrof K. X., Fontaine J. B. (2017). Topsoil stockpiling in restoration: impact of storage time on plant growth and symbiotic soil biota. Ecol. Res. 35, 237–245. doi: 10.3368/er.35.3.237 - DOI

LinkOut - more resources