. 2023 Jul 15;18(1):20220528.
doi: 10.1515/biol-2022-0528. eCollection 2023.

Integrated analysis of the microbiome and transcriptome in stomach adenocarcinoma

Affiliations

Integrated analysis of the microbiome and transcriptome in stomach adenocarcinoma

Daxiang Zhou et al. Open Life Sci. .

Abstract

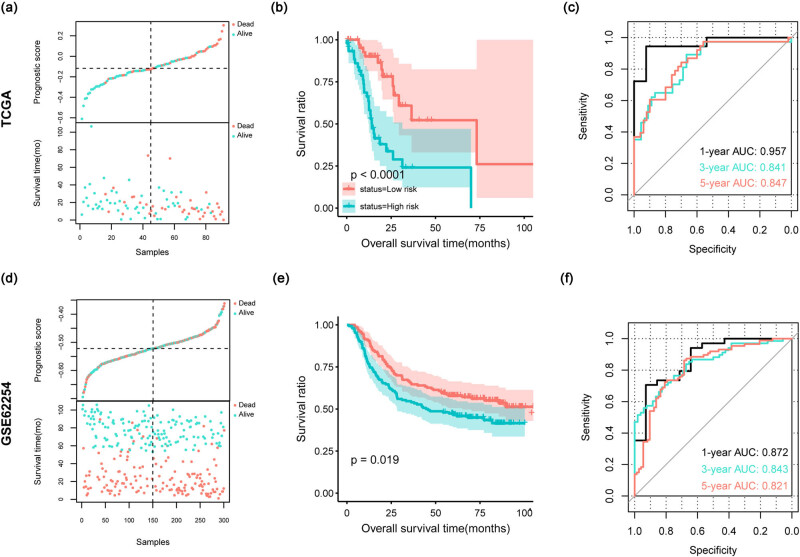
We aimed to characterize the stomach adenocarcinoma (STAD) microbiota and its clinical value using an integrated analysis of the microbiome and transcriptome. Microbiome and transcriptome data were downloaded from the Cancer Microbiome Atlas and the Cancer Genome Atlas databases. We identified nine differentially abundant microbial genera, including Helicobacter, Mycobacterium, and Streptococcus, which clustered patients into three subtypes with different survival rates. In total, 74 prognostic genes were screened from 925 feature genes of the subtypes, among which five genes were identified for prognostic model construction, including NTN5, MPV17L, MPLKIP, SIGLEC5, and SPAG16. The prognostic model could stratify patients into different risk groups. The high-risk group was associated with poor overall survival. A nomogram established using the prognostic risk score could accurately predict the 1, 3, and 5 year overall survival probabilities. The high-risk group had a higher proportion of histological grade 3 and recurrence samples. Immune infiltration analysis showed that samples in the high-risk group had a higher abundance of infiltrating neutrophils. The Notch signaling pathway activity showed a significant difference between the high- and low-risk groups. In conclusion, a prognostic model based on five feature genes of microbial subtypes could predict the overall survival for patients with STAD.

Keywords: immune infiltration; microbiota; prognostic model; stomach adenocarcinoma; subtype.


Conflict of interest statement

Conflict of interest: Authors state no conflict of interest

Figures

Figure 1
Figure 1
Identification of differential microbials and microbial subtypes. (a) Heatmaps showing the abundance of nine differential microbial genera between the STAD and histologically normal samples. The blue-to-red colors of the lateral bar on the left indicate the low-to-high relative abundance of differential microbial genera; (b) Bar graph of relative abundance of nine differential microbial genera between STAD (orange) and histologically normal samples (blue); (c) clustering heatmap reveals three microbial subtypes: subtype 1, subtype 2, and subtype 3; (d) heatmap showing the abundance of nine differential microbial genera among the three microbial subtypes; (e) KM survival curve showing the survival differences among three subtypes; (f) number of DEGs in subtype 1 vs subtypes 2 and 3, subtype 2 vs subtypes 1 and 3, and subtype 3 vs subtypes 1 and 2 groups; (g) Venn diagram for the DEGs of the three groups.
Figure 2
Figure 2
Results for functional enrichment analysis. The bubble diagram shows the significantly enriched biological processes (left) and KEGG pathways (right) for the DEGs in subtype 1 vs subtypes 2 and 3 (a), subtype 2 vs subtypes 1 and 3 (b), and subtype 3 vs subtypes 1 and 2 groups (c). The horizontal axis indicates the number of genes and the vertical axis indicates the terms of GO biological processes and KEGG pathways. The number of genes enriched in each functional and pathway term is proportional to dot size. P value is indicated by dot color from blue (small) to red (large).
Figure 3
Figure 3
The optimal prognostic genes screened by LASSO. (a) The LASSO coefficient spectrum of the 14 independent prognostic genes (left) and optimized lambda determined in the LASSO regression model (right); (b) forest plot of the optimal prognostic genes screened by LASSO; (c) KM survival curves show the prognostic value of these five genes.
Figure 4
Figure 4
Construction and validation for prognostic model. (a–c) results for TCGA dataset; (d–f) results for GSE62254 dataset. (a and d) the scatterplots in the top panel show the distribution of the risk score, and the scatterplots in the bottom show the survival status of patients; (b and e) KM survival curves show the survival differences between the two risk groups; (c and f) ROC curves show the predictive performance for 1, 3, and 5 year survival.
Figure 5
Figure 5
Associations of risk groups with clinical factors and microbial subtypes. (a) Heatmap showing the expression pattern of the five genes and clinical factor distribution in the high-risk and low-risk groups; (b) histograms showing the distribution of proportions for histologic grade and recurrence between two different risk groups; (c) univariate and multivariate Cox regression analysis of factors for overall survival; (d) a nomogram was constructed using the prognostic risk score to predict the 1, 3, and 5 year overall survival probabilities of STAD patients; (e) calibration curves showing the concordance between the predicted and actual 1, 3, and 5 year survival rates of patients.
Figure 6
Figure 6
Associations of risk groups with immune infiltration and pathways. (a) Violin plot showing the difference in abundance of the six infiltrating immune cells between the two risk groups; (b) heatmap showing the 15 significant differential KEGG pathways between the two risk groups analyzed by GSVA.
Figure A1
Figure A1
The workflow of this study.

References

    1. Smyth EC, Nilsson M, Grabsch HI, van Grieken NC, Lordick F. Gastric cancer. Lancet. 2020;396(10251):635–48. - PubMed
    1. Machlowska JBJ, Sitarz M, Maciejewski R, Sitarz R. Gastric cancer: Epidemiology, risk factors, classification, genomic characteristics and treatment strategies. Int J Mol Sci. 2020;21(11):4012. - PMC - PubMed
    1. Xie J, Fu L, Zhang J. Analysis of influencing factors on the occurrence and development of gastric cancer in high-incidence areas of digestive tract tumors based on high methylation of GPX3 gene. J Oncol. 2022;2022:3094881. - PMC - PubMed
    1. Johnston FM, Beckman M. Updates on management of gastric cancer. Curr Oncol Rep. 2019;21(8):67. - PubMed
    1. Brugère J-F, Mihajlovski A, Missaoui M, Peyret P. Tools for stools: The challenge of assessing human intestinal microbiota using molecular diagnostics. Expert Rev Mol Diagn. 2009;9(4):353–65. - PubMed

LinkOut - more resources