. 2023 Jul 3:14:1198417.
doi: 10.3389/fgene.2023.1198417. eCollection 2023.

Identification of biomarkers associated with diagnosis of postmenopausal osteoporosis patients based on bioinformatics and machine learning

Affiliations

Identification of biomarkers associated with diagnosis of postmenopausal osteoporosis patients based on bioinformatics and machine learning

Xinzhou Huang et al. Front Genet. .

Abstract

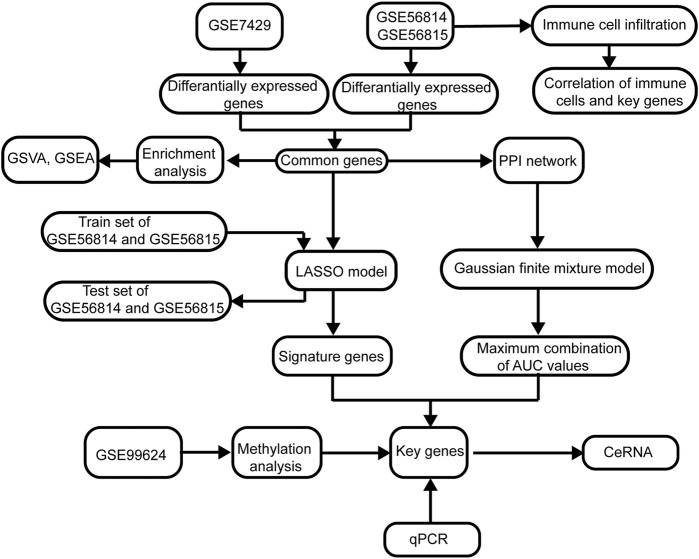
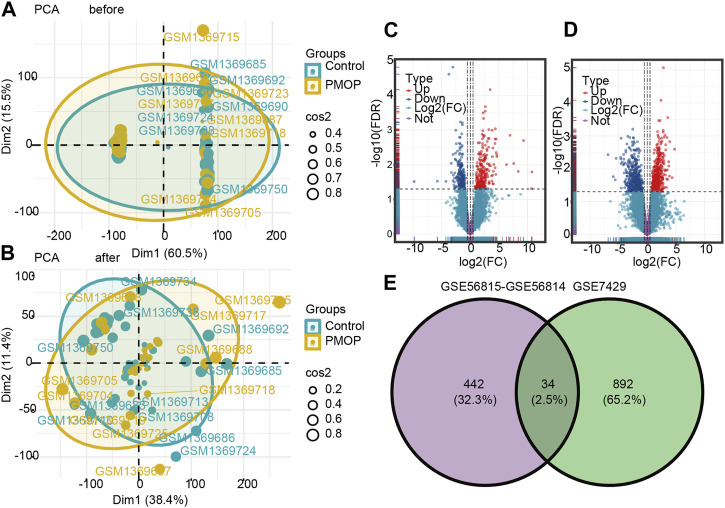
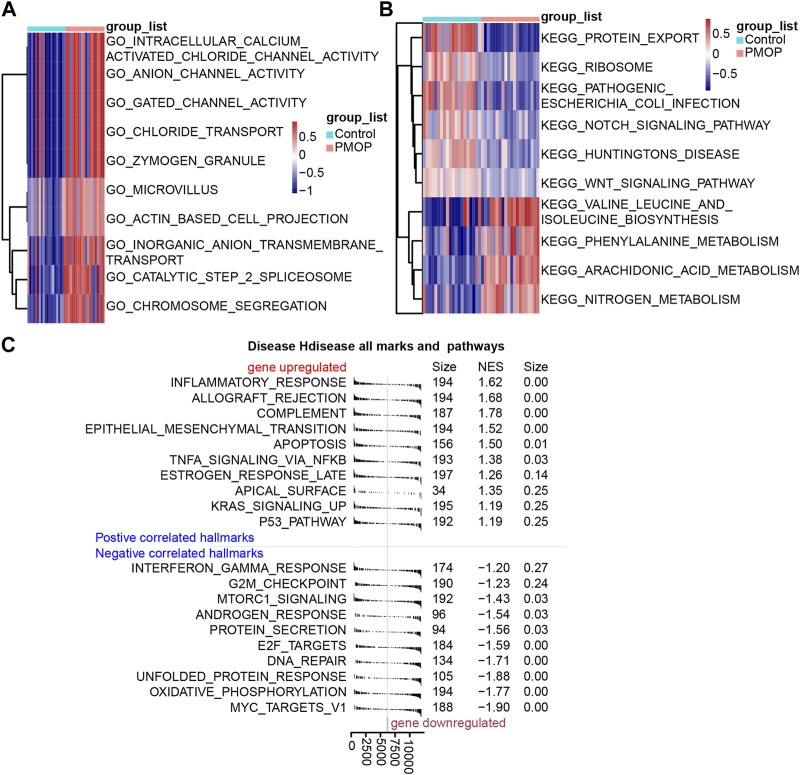
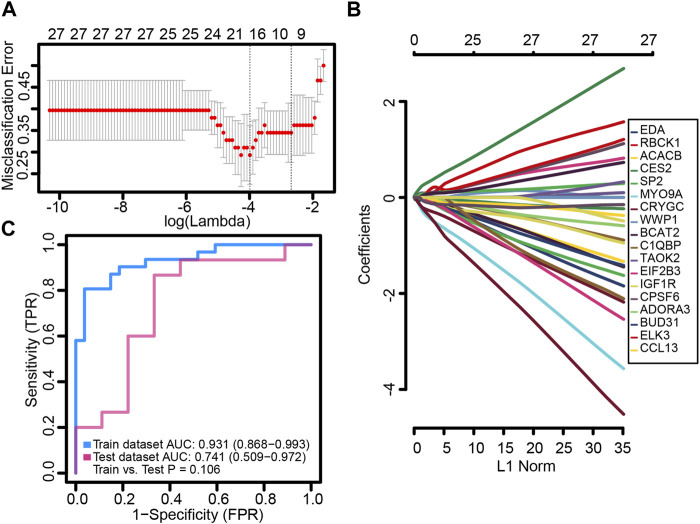
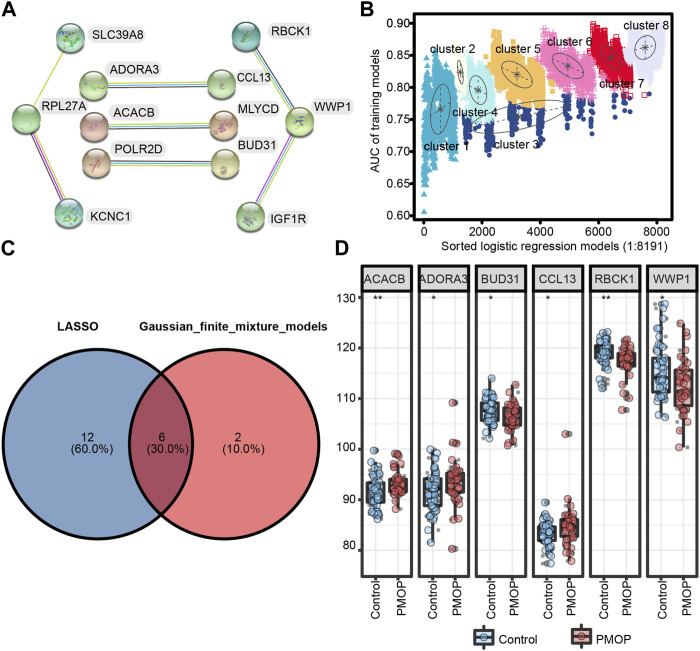
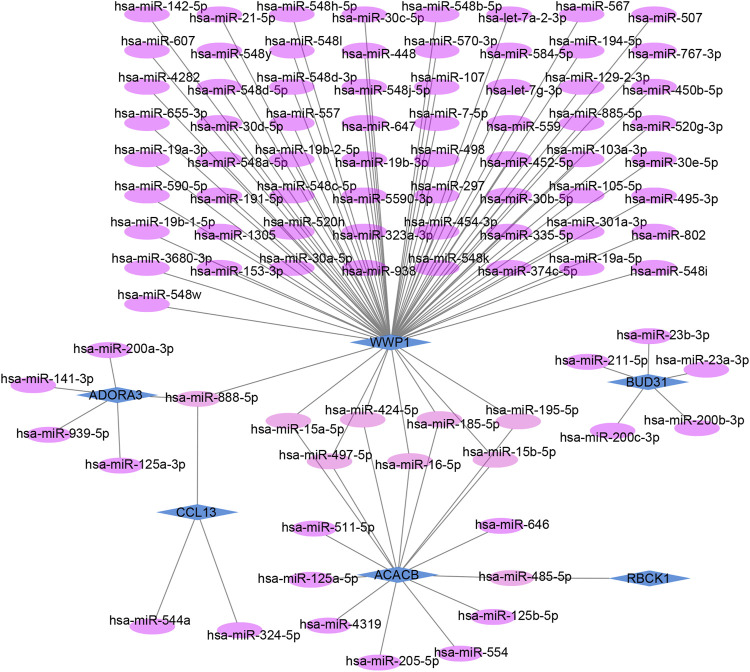
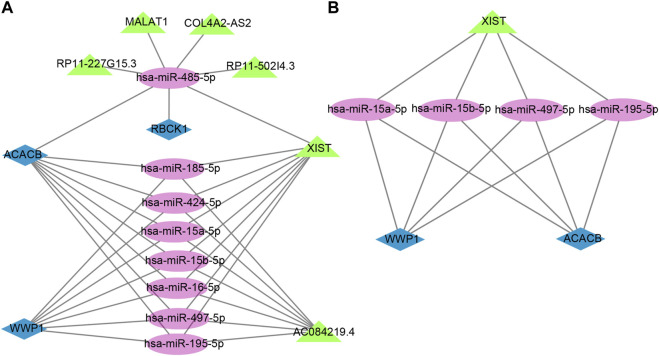
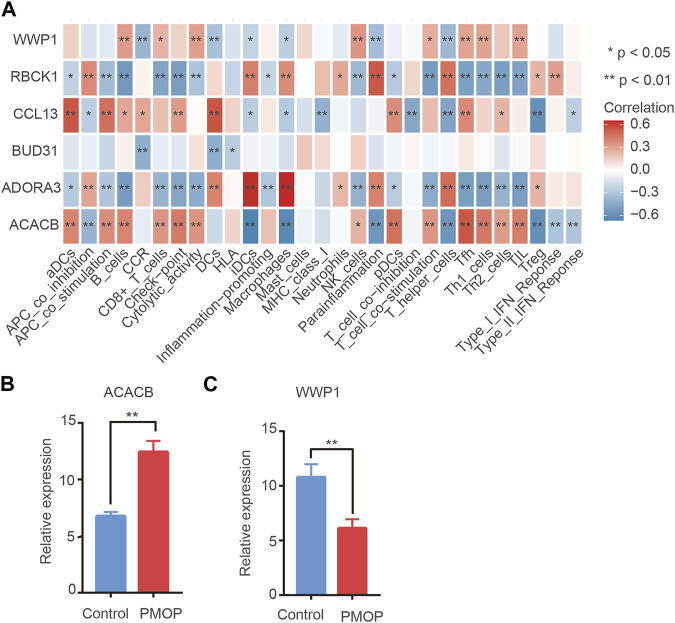
Background: Accumulating evidence suggests that postmenopausal osteoporosis (PMOP) is a common chronic systemic metabolic bone disease, but its specific molecular pathogenesis remains unclear. This study aimed to identify novel genetic diagnostic markers for PMOP. Methods: In this paper, we combined three GEO datasets to identify differentially expressed genes (DEGs) and performed functional enrichment analysis of PMOP-related differential genes. Key genes were analyzed using two machine learning algorithms, namely, LASSO and the Gaussian mixture model, and candidate biomarkers were found after taking the intersection. After further ceRNA network construction, methylation analysis, and immune infiltration analysis, ACACB and WWP1 were finally selected as diagnostic markers. Twenty-four clinical samples were collected, and the expression levels of biomarkers in PMOP were detected by qPCR. Results: We identified 34 differential genes in PMOP. DEG enrichment was mainly related to amino acid synthesis, inflammatory response, and apoptosis. The ceRNA network construction found that XIST-hsa-miR-15a-5p/hsa-miR-15b-5p/hsa-miR-497-5p and hsa-miR-195-5p-WWP1/ACACB may be RNA regulatory pathways regulating PMOP disease progression. ACACB and WWP1 were identified as diagnostic genes for PMOP, and validated in datasets and clinical sample experiments. In addition, these two genes were also significantly associated with immune cells, such as T, B, and NK cells. Conclusion: Overall, we identified two vital diagnostic genes responsible for PMOP. The results may help provide potential immunotherapeutic targets for PMOP.

Keywords: Gene Expression Omnibus; RNA regulatory pathways; diagnosis; machine learning; postmenopausal osteoporosis.


Conflict of interest statement

The authors declare that the research was conducted in the absence of any commercial or financial relationships that could be construed as a potential conflict of interest.

Figures

FIGURE 1
FIGURE 1
Flowchart of this study. The following datasets were used for identification of the potential diagnostic genes and mechanisms associated with the development of osteoporosis (PMOP): GSE56815, GSE56814, and GSE7429. Abbreviations: AUC, area under the receiver operating characteristic curve; GSVA, gene set variation analysis; PPI, protein–protein interaction; GSEA, gene set enrichment analysis; LASSO, least absolute shrinkage and selection operator.
FIGURE 2
FIGURE 2
Two-dimensional PCA cluster plot before and after sample correction. (A) Two-dimensional PCA cluster plot of the GSE56815 and GSE56814 datasets before sample correction. (B) Two-dimensional PCA cluster plot of the GSE56815 and GSE56814 datasets after sample correction; yellow represents the osteoporosis (PMOP) group, and sky blue represents the normal control group. Volcano map and Venn diagram of differentially expressed genes (DEGs). (C) Genes differentially expressed between PMOP and controls in the GSE56815 and GSE56814 datasets. (D) Genes differentially expressed between PMOP and controls in the GSE7429 dataset. (E) Intersection of differentially expressed genes (DEGs) in the GSE56815, GSE56814, and GSE7429 datasets. The count on the left refers to DEGs unique to GSE56815 and GSE56814; the count in the middle, DEGs common to both datasets; and the count on the right, DEGs unique to GSE7429. DEGs were selected by |log2FC| > 1 and p < 0.05. Red represents upregulated differential genes, purple represents no significant difference genes, and blue represents downregulated differential genes. FC, fold change.
FIGURE 3
FIGURE 3
Biological functions and KEGG pathways enriched in DEGs. GSVA identified the biological processes (A) and KEGG pathways (B) between the DEGs of patients with PMOP. (C) DEGs involved in upregulated or downregulated KEGG pathways of GSEA results in PMOP patients relative to controls. p < 0.05 was considered statistically significant.
FIGURE 4
FIGURE 4
Potential key genes for the diagnosis of PMOP. (A) Gene signature selection of optimal parameter (lambda) in the LASSO model. (B) LASSO coefficient profiles of the 18 differentially expressed genes selected by the optimal lambda. (C) Receiver operating characteristic (ROC) curves of the gene signature in the training and testing sets of GSE56815 and GSE56814, respectively.
FIGURE 5
FIGURE 5
Screening and verification of diagnostic markers. (A) Protein–protein interaction (PPI) network of 12 genes; (B) pattern of the logistic regression model correlated with the AUC scores and was identified by a Gaussian mixture. There are eight clusters of 8,191 combinations. (C) Venn diagram shows the intersection of diagnostic markers obtained by the two algorithms. (D) Differential expression of key genes between PMOP patients and controls in GSE56815 and GSE56814, respectively. *p < 0.05; **p < 0.01.
FIGURE 6
FIGURE 6
Co-expressed network of mRNAs and target miRNAs. The mRNA–miRNA co-expressed network was constructed by Cytoscape including 98 nodes and 102 edges. One node represents mRNA or miRNA, while one edge represents one interaction of mRNA and miRNA. Green diamonds represent the hub genes, and purple circles represent miRNAs.
FIGURE 7
FIGURE 7
Potential RNA regulatory pathway for a ceRNA network. (A) ceRNA network of WWP1, RBCK1, and ACACB. (B) ceRNA network of WWP1 and ACACB. Blue diamonds represent the hub genes, purple circles represent miRNAs, and the green triangles represent lncRNAs.
FIGURE 8
FIGURE 8
Immune cell situation in PMOP patients. (A) Correlation between key genes and immune infiltrating cells, based on Pearson correlation analysis. Red nodes represent positive correlations, and blue nodes, negative correlations. mRNA expression in PMOP patients. (B–C) QPCR results show that the expression levels of ACACB in PMOP patients were obviously higher than that of the healthy controls. However, the expression levels of WWP1 in PMOP patients were obviously lower than that of the healthy controls. Three independent experiments were performed. Similar results were obtained in each experiment, and the result of the representative experiment was presented. *p < 0.05; **p < 0.01. PMOP group versus the control group.

Similar articles

Cited by

References

    1. Arron J. R., Choi Y. (2000). Bone versus immune system. Nature 408 (6812), 535–536. 10.1038/35046196 - DOI - PubMed
    1. Bindea G., Mlecnik B., Tosolini M., Kirilovsky A., Waldner M., Obenauf A., et al. (2013). Spatiotemporal dynamics of intratumoral immune cells reveal the immune landscape in human cancer. Immunity 39 (4), 782–795. 10.1016/j.immuni.2013.10.003 - DOI - PubMed
    1. Black D. M., Rosen C. J. (2016). Clinical practice. Postmenopausal osteoporosis. N. Engl. J. Med. 374 (3), 254–262. 10.1056/NEJMcp1513724 - DOI - PubMed
    1. Breuil V., Ticchioni M., Testa J., Roux C. H., Ferrari P., Breittmayer J. P., et al. (2010). Immune changes in post-menopausal osteoporosis: The immunos study. Osteoporos. Int. 21 (5), 805–814. 10.1007/s00198-009-1018-7 - DOI - PubMed
    1. Browne R. P., McNicholas P. D., Sparling M. D. (2012). Model-based learning using a mixture of mixtures of Gaussian and uniform distributions. IEEE Trans. Pattern Anal. Mach. Intell. 34 (4), 814–817. 10.1109/tpami.2011.199 - DOI - PubMed

LinkOut - more resources