. 2023 Jul;28(7):075002.
doi: 10.1117/1.JBO.28.7.075002. Epub 2023 Jul 17.

Robustness of tissue oxygenation estimates by continuous wave space-resolved near infrared spectroscopy

Affiliations

Robustness of tissue oxygenation estimates by continuous wave space-resolved near infrared spectroscopy

Caterina Amendola et al. J Biomed Opt. 2023 Jul.

Abstract

Significance: Continuous wave near infrared spectroscopy (CW-NIRS) is widely exploited in clinics to estimate skeletal muscles and brain cortex oxygenation. Spatially resolved spectroscopy (SRS) is generally implemented in commercial devices. However, SRS suffers from two main limitations: the a priori assumption on the spectral dependence of the reduced scattering coefficient [μs'(λ)] and the modeling of tissue as homogeneous.

Aim: We studied the accuracy and robustness of SRS NIRS. We investigated the errors in retrieving hemodynamic parameters, in particular tissue oxygen saturation (StO2), when μs'(λ) was varied from expected values, and when layered tissue was considered.

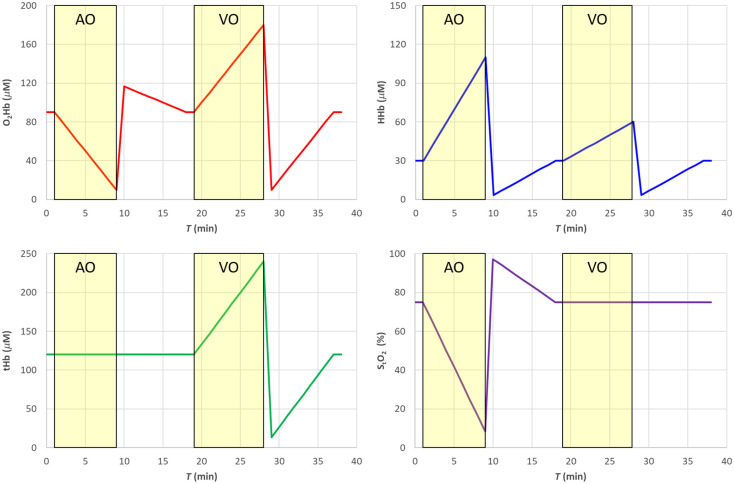
Approach: We simulated hemodynamic variations mimicking real-life scenarios for skeletal muscles. Simulations were performed by exploiting the analytical solutions of the photon diffusion equation in different geometries: (1) semi-infinite homogeneous medium and constant μs'(λ); (2) semi-infinite homogeneous medium and linear changes in μs'(λ); (3) two-layered media with a superficial thickness s1=5, 7.5, 10 mm and constant μs'(λ). All simulated data were obtained at source-detector distances ρ=35, 40, 45 mm, and analyzed with the SRS approach to derive hemodynamic parameters (concentration of oxygenated and deoxygenated hemoglobin, total hemoglobin concentration, and tissue oxygen saturation, StO2) and their relative error.

Results: Variations in μs'(λ) affect the estimated StO2 (up to ±10%), especially if changes are different at the two wavelengths. However, the main limitation of the SRS method is the presence of a superficial layer: errors strongly larger than 20% were retrieved for the estimated StO2 when the superficial thickness exceeds 5 mm.

Conclusions: These results highlight the need for more sophisticated strategies (e.g., the use of multiple short and long distances) to reduce the influence of superficial tissues in retrieving hemodynamic parameters and warn the SRS users to be aware of the intrinsic limitation of this approach, particularly when exploited in the clinical environment.

Keywords: differential pathlength factor; near infrared spectroscopy; reduced scattering coefficient; spatially resolved spectroscopy; tissue oxygen saturation.


Figures

Fig. 1
Fig. 1
The nominal values of used in the simulations of Secs. 4.1–4.3 and 4.5. The shaded yellow areas represent the AO and VO tests.
Fig. 2
Fig. 2
The nominal values of (a) μa(λ,T) and (b) μs(λ,T) used in the simulations of Secs. 4.1–4.3 and 4.5. Red 760 nm, purple 850 nm. The shaded yellow areas represent the AO and VO tests.
Fig. 3
Fig. 3
SRS results for semi-infinite homogeneous medium. Filled circle (•) exact μs(λ), empty diamond (⋄) 20% overestimation of parameter a, cross (X) 20% underestimation of parameter a. The solid line in each panel is the nominal value. The shaded yellow areas represent the AO and VO tests.
Fig. 4
Fig. 4
Relative error for the SRS results for semi-infinite homogeneous medium. Filled circle (•) exact μs(λ), empty diamond (⋄) 20% overestimation of parameter a, cross (X) 20% underestimation of parameter a. The shaded yellow areas represent the AO and VO tests.
Fig. 5
Fig. 5
SRS results for semi-infinite homogeneous medium. Filled circle (•) exact μs(λ), empty diamond (⋄) 20% overestimation of parameter b, cross (X) 20% underestimation of parameter b. The solid line in each panel is the nominal value. The shaded yellow areas represent the AO and VO tests.
Fig. 6
Fig. 6
Relative error for the SRS results for semi-infinite homogeneous medium. Filled circle (•) exact μs(λ), empty diamond (⋄) 20% overestimation of parameter b, cross (X) 20% underestimation of parameter b. The shaded yellow areas represent the AO and VO tests.
Fig. 7
Fig. 7
The solid lines show the nominal values of μa(λ,T) and μs(λ,T) used in the simulations of Sec. 4.4. Red 760 nm, purple 850 nm. The shaded yellow areas represent the different changes applied to the scattering parameters. In the right panel, the points show the values used in the SRS estimation.
Fig. 8
Fig. 8
SRS results for semi-infinite homogeneous medium with variable reduced scattering when using a constant reduced scattering for SRS estimation.
Fig. 9
Fig. 9
Relative error for the SRS results for semi-infinite homogeneous medium with variable reduced scattering when using a constant reduced scattering for SRS estimation.
Fig. 10
Fig. 10
SRS results for a bilayer with thickness of the upper layer (•) 5 mm, (⋄) 7.5 mm, (X) 10 mm. The solid line is the nominal value for the lower layer, the dashed line is the nominal value for the upper layer. The shaded yellow areas represent the AO and VO tests. Changes are applied to the lower layer only.
Fig. 11
Fig. 11
Relative error for the SRS results for a bilayer with thickness of the upper layer (•) 5 mm, (⋄) 7.5 mm, (X) 10 mm. The shaded yellow areas represent the AO and VO tests. Changes are applied to the lower layer only.
Fig. 12
Fig. 12
SRS results for a bilayer with thickness of the upper layer (•) 5 mm, (⋄) 7.5 mm, (X) 10 mm. In each panel, the solid line is the nominal value for the lower layer, the dashed line is the nominal value for the upper layer. Changes are applied to the upper layer only.
Fig. 13
Fig. 13
Relative error with respect to the lower layer for the SRS results for a bilayer with thickness of the upper layer (•) 5 mm, (⋄) 7.5 mm, (X) 10 mm. Changes are applied to the upper layer only.
Fig. 14
Fig. 14
DPF estimate from Eq. (9). (a) Errors in parameter a (⋄) 20%, (X) +20%; (b) errors in parameter b (⋄) 20%, (X) +20%; (c) two-layer medium [thickness of upper layer (•) 5 mm, (⋄) 7.5 mm, (X) 10 mm] with changes in the lower layer and upper layer with constant optical and hemodynamic properties; and (d) two-layer medium [thickness of upper layer (•) 5 mm, (⋄) 7.5 mm, (X) 10 mm] with changes in the upper layer and lower layer with constant optical and hemodynamic properties. Solid lines are exact values.

Similar articles

Cited by

References

    1. Ali J., et al. , “Near-Infrared Spectroscopy (NIRS) for cerebral and tissue oximetry: analysis of evolving applications,” J. Cardiothorac. Vasc. Anesth. 36(8 Pt A), 2758–2766 (2022).JCVAEK10.1053/j.jvca.2021.07.015 - DOI - PubMed
    1. Ferrari M., Muthalib M., Quaresima V., “The use of near-infrared spectroscopy in understanding skeletal muscle physiology: recent developments,” Phil. Trans. R. Soc. A 369, 4577–4590 (2011).PTRMAD10.1098/rsta.2011.0230 - DOI - PubMed
    1. Contini D., et al. , “Brain and muscle near infrared spectroscopy/imaging techniques,” J. Near Infrared Spectrosc. 20, 15–27 (2012).10.1255/jnirs.977 - DOI
    1. Suzuki S., et al. , “Tissue oxygenation monitor using NIR spatially resolved spectroscopy,” Proc. SPIE 3597, 582–592 (1999).10.1117/12.356862 - DOI
    1. Cowdrick K., “NIRS & DCS commercially available product landscape,” 2023, https://datastudio.google.com/reporting/5f333396-7078-4f31-9056-e0f926b9....

Publication types

MeSH terms