

The origins of the full-field flash electroretinogram b-wave
- PMID: 37465364
- PMCID: PMC10351385
- DOI: 10.3389/fnmol.2023.1153934
The origins of the full-field flash electroretinogram b-wave
Abstract
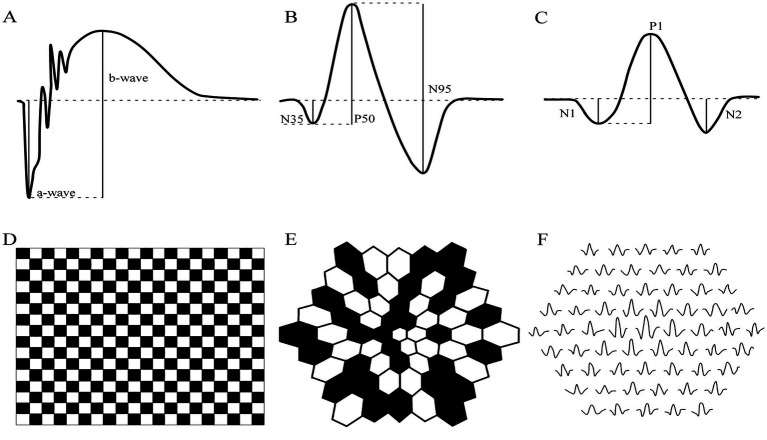
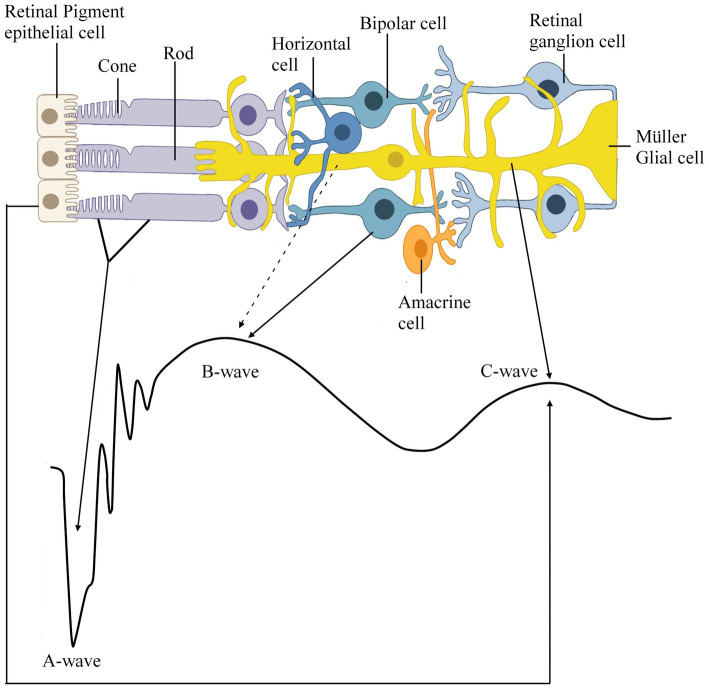
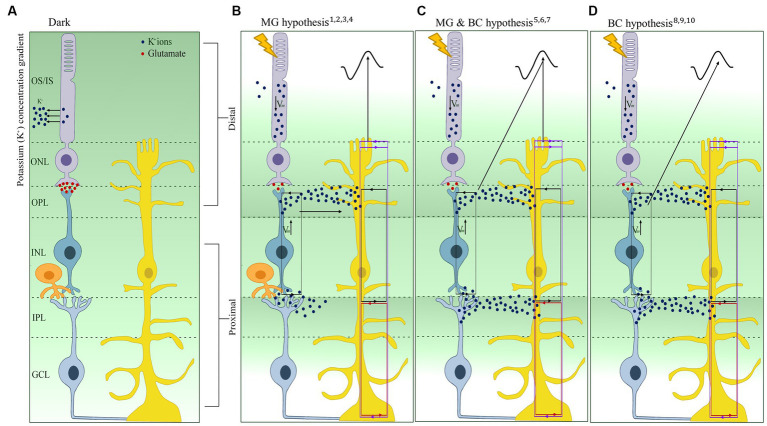
The electroretinogram (ERG) measures the electrical activity of retinal neurons and glial cells in response to a light stimulus. Amongst other techniques, clinicians utilize the ERG to diagnose various eye diseases, including inherited conditions such as cone-rod dystrophy, rod-cone dystrophy, retinitis pigmentosa and Usher syndrome, and to assess overall retinal health. An ERG measures the scotopic and photopic systems separately and mainly consists of an a-wave and a b-wave. The other major components of the dark-adapted ERG response include the oscillatory potentials, c-wave, and d-wave. The dark-adapted a-wave is the initial corneal negative wave that arises from the outer segments of the rod and cone photoreceptors hyperpolarizing in response to a light stimulus. This is followed by the slower, positive, and prolonged b-wave, whose origins remain elusive. Despite a large body of work, there remains controversy around the mechanisms involved in the generation of the b-wave. Several hypotheses attribute the origins of the b-wave to bipolar or Müller glial cells or a dual contribution from both cell types. This review will discuss the current hypothesis for the cellular origins of the dark-adapted ERG, with a focus on the b-wave.
Keywords: Müller glia cells; a-wave; b-wave; bipolar cells; electroretinogram; potassium ions.
Copyright © 2023 Bhatt, Hunt and Carvalho.
Conflict of interest statement
The authors declare that the research was conducted in the absence of any commercial or financial relationships that could be construed as a potential conflict of interest.
Figures
Similar articles
-
Push-pull model of the primate photopic electroretinogram: a role for hyperpolarizing neurons in shaping the b-wave.Vis Neurosci. 1994 May-Jun;11(3):519-32. doi: 10.1017/s0952523800002431. Vis Neurosci. 1994. PMID: 8038126
-
Full-field electroretinogram in autism spectrum disorder.Doc Ophthalmol. 2016 Apr;132(2):83-99. doi: 10.1007/s10633-016-9529-y. Epub 2016 Feb 11. Doc Ophthalmol. 2016. PMID: 26868825
-
Origin of negative potentials in the light-adapted ERG of cat retina.J Neurophysiol. 1990 Jun;63(6):1333-46. doi: 10.1152/jn.1990.63.6.1333. J Neurophysiol. 1990. PMID: 2358881
-
Human retinal dark adaptation tracked in vivo with the electroretinogram: insights into processes underlying recovery of cone- and rod-mediated vision.J Physiol. 2022 Nov;600(21):4603-4621. doi: 10.1113/JP283105. Epub 2022 Jun 7. J Physiol. 2022. PMID: 35612091 Free PMC article. Review.
-
Beta wave of the scotopic (rod) electroretinogram as a measure of the activity of human on-bipolar cells.J Opt Soc Am A Opt Image Sci Vis. 1996 Mar;13(3):623-33. doi: 10.1364/josaa.13.000623. J Opt Soc Am A Opt Image Sci Vis. 1996. PMID: 8627419 Review.
Cited by
-
Interaction between native and prosthetic visual responses in optogenetic visual restoration.JCI Insight. 2025 Apr 15;10(11):e190785. doi: 10.1172/jci.insight.190785. eCollection 2025 Jun 9. JCI Insight. 2025. PMID: 40232851 Free PMC article.
-
Subjective vision assessment in companion dogs using dogVLQ demonstrates age-associated visual dysfunction.Front Vet Sci. 2023 Aug 17;10:1244518. doi: 10.3389/fvets.2023.1244518. eCollection 2023. Front Vet Sci. 2023. PMID: 37662991 Free PMC article.
-
Remodeling the light-adapted electroretinogram using a bayesian statistical approach.BMC Res Notes. 2025 Jan 23;18(1):33. doi: 10.1186/s13104-025-07115-4. BMC Res Notes. 2025. PMID: 39849598 Free PMC article.
-
Neuroprotective Effect of Methylene Blue in a Rat Model of Traumatic Optic Neuropathy.Pharmaceuticals (Basel). 2025 Jun 19;18(6):920. doi: 10.3390/ph18060920. Pharmaceuticals (Basel). 2025. PMID: 40573315 Free PMC article.
-
C1q limits cystoid edema by maintaining basal beta-catenin-dependent signaling and blood-retina barrier function.bioRxiv [Preprint]. 2025 Jul 26:2025.07.22.666172. doi: 10.1101/2025.07.22.666172. bioRxiv. 2025. PMID: 40777295 Free PMC article. Preprint.
References
Publication types
LinkOut - more resources
Full Text Sources