

Hypoxia-associated genes predicting future risk of myocardial infarction: a GEO database-based study
- PMID: 37465452
- PMCID: PMC10351911
- DOI: 10.3389/fcvm.2023.1068782
Hypoxia-associated genes predicting future risk of myocardial infarction: a GEO database-based study
Abstract
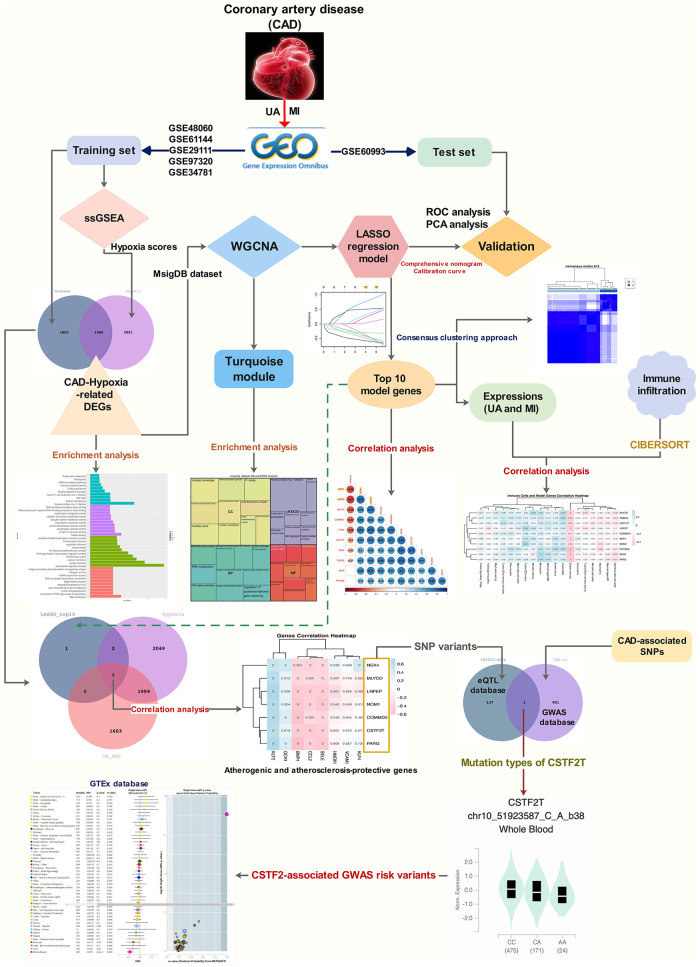
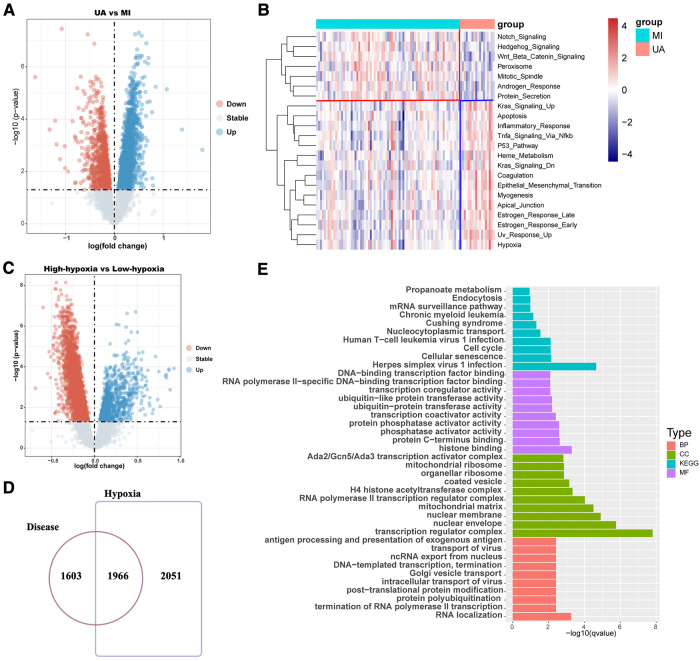
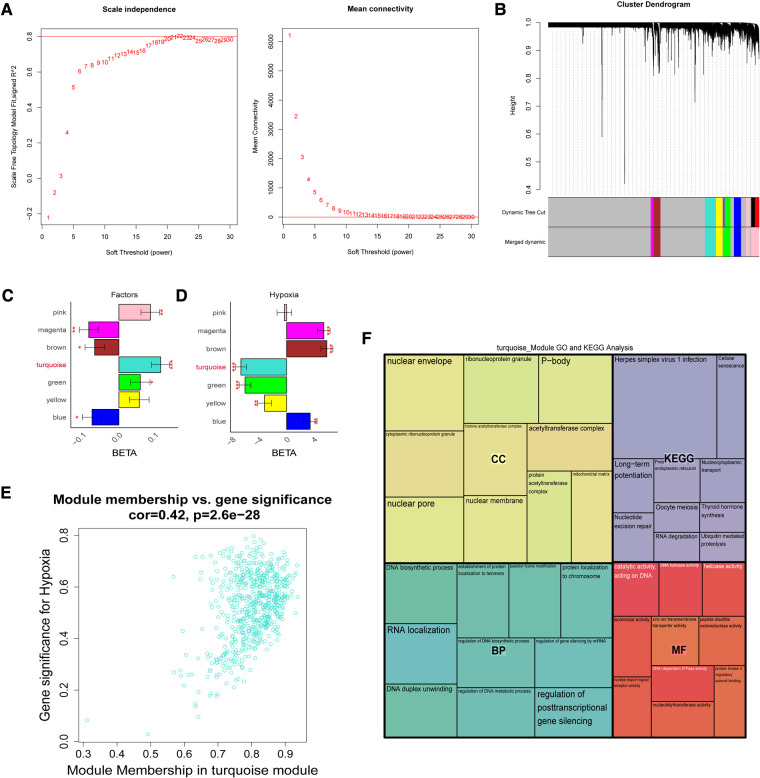
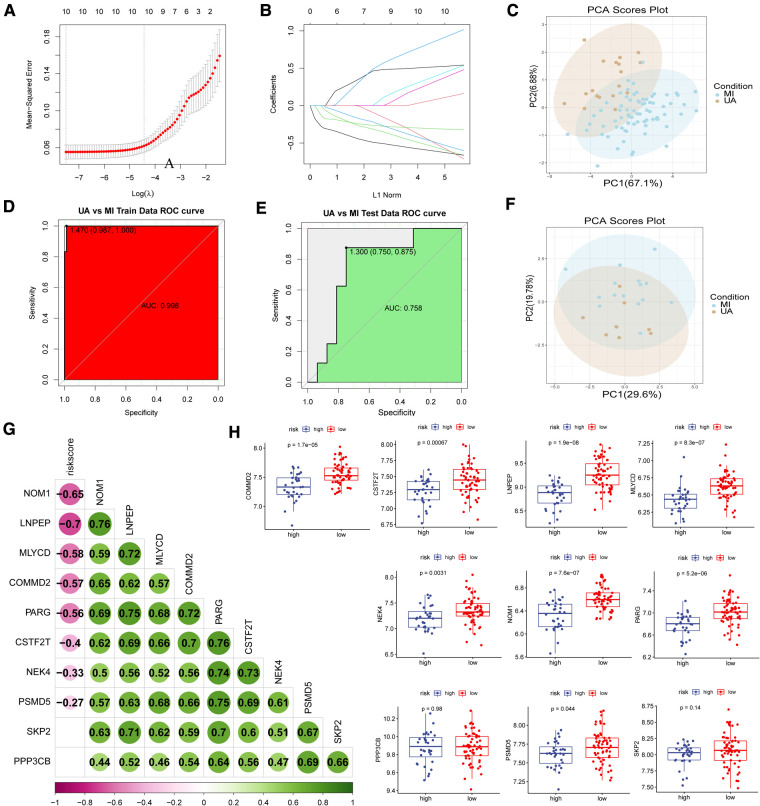
Background: Patients with unstable angina (UA) are prone to myocardial infarction (MI) after an attack, yet the altered molecular expression profile therein remains unclear. The current work aims to identify the characteristic hypoxia-related genes associated with UA/MI and to develop a predictive model of hypoxia-related genes for the progression of UA to MI.
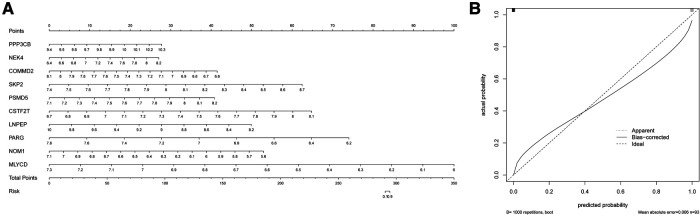
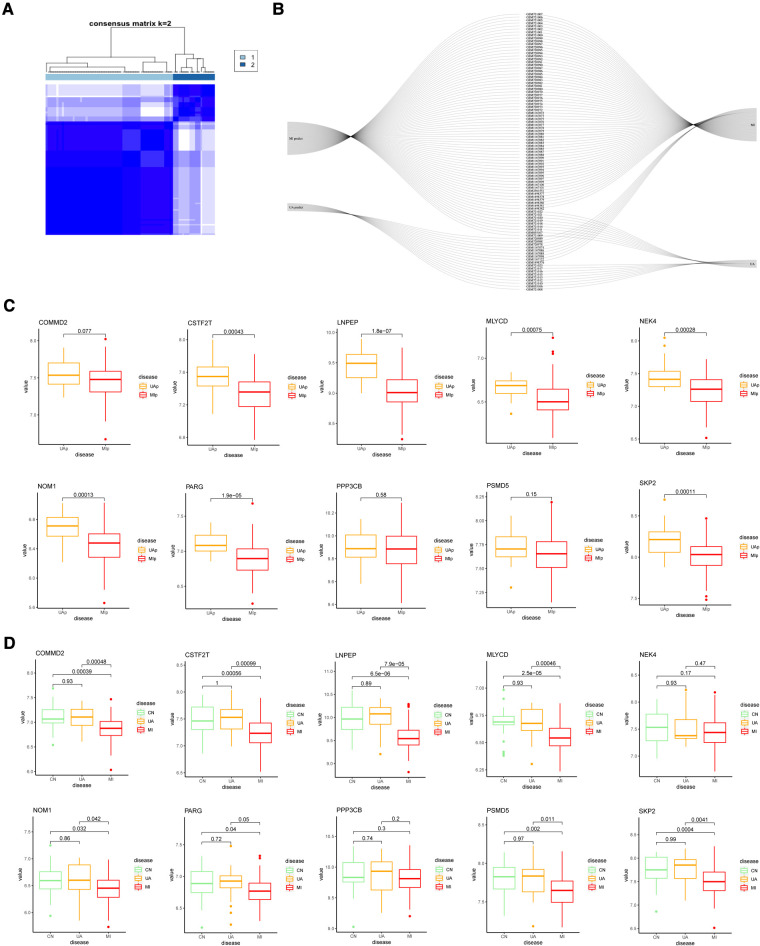
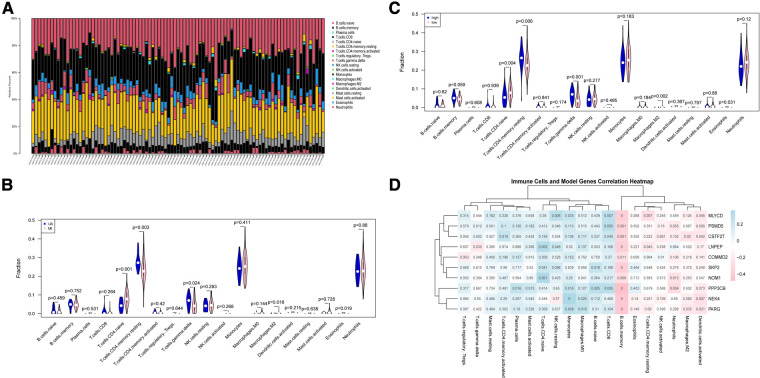
Methods and results: Gene expression profiles were obtained from the GEO database. Then, differential expression analysis and the WGCNA method were performed to select characteristic genes related to hypoxia. Subsequently, all 10 hypoxia-related genes were screened using the Lasso regression model and a classification model was established. The area under the ROC curve of 1 shows its excellent classification performance and is confirmed on the validation set. In parallel, we construct a nomogram based on these genes, showing the risk of MI in patients with UA. Patients with UA and MI had their immunological status determined using CIBERSORT. These 10 genes were primarily linked to B cells and some inflammatory cells, according to correlation analysis.
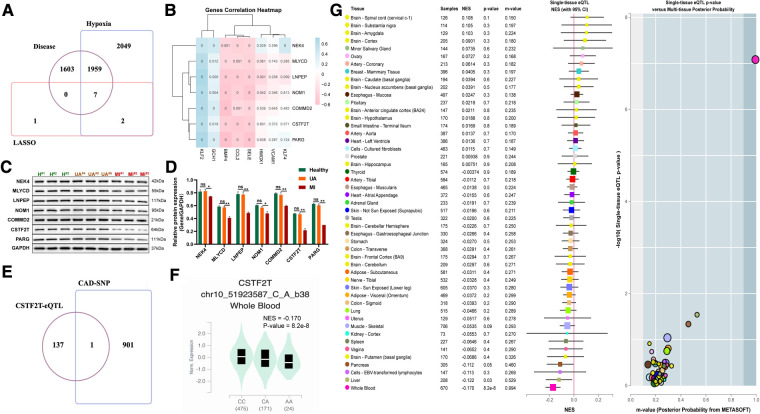
Conclusion: Overall, GWAS identified that the CSTF2F UA/MI risk gene promotes atherosclerosis, which provides the basis for the design of innovative cardiovascular drugs by targeting CSTF2F.
Keywords: CSTF2F; GEO; GWAS; WGCNA; coronary artery disease; myocardial infarction; unstable angina (UA).
© 2023 Li, Zhang, Ni and Cao.
Conflict of interest statement
The authors declare that the research was conducted in the absence of any commercial or financial relationships that could be construed as a potential conflict of interest.
Figures
Similar articles
-
Development and Validation of a Diagnostic Model Based on Hypoxia-Related Genes in Myocardial Infarction.Int J Gen Med. 2023 May 29;16:2111-2123. doi: 10.2147/IJGM.S407759. eCollection 2023. Int J Gen Med. 2023. PMID: 37275329 Free PMC article.
-
Serum tumour necrosis factor-alpha, interleukin-2 and interleukin-10 activation in stable angina and acute coronary syndromes.Coron Artery Dis. 2003 Sep;14(6):431-8. doi: 10.1097/00019501-200309000-00003. Coron Artery Dis. 2003. PMID: 12966263
-
Constructing differential co-expression network to predict key pathways for myocardial infarction.Exp Ther Med. 2019 Apr;17(4):3029-3034. doi: 10.3892/etm.2019.7321. Epub 2019 Feb 26. Exp Ther Med. 2019. PMID: 30936974 Free PMC article.
-
Cardiovascular Risk Profile, Presentation and Management Outcomes of Patients with Acute Coronary Syndromes after Coronary Artery Bypass Grafting.Curr Probl Cardiol. 2022 Nov;47(11):101078. doi: 10.1016/j.cpcardiol.2021.101078. Epub 2021 Dec 11. Curr Probl Cardiol. 2022. PMID: 34902394 Review.
-
Unstable Angina as a Component of Primary Composite Endpoints in Clinical Cardiovascular Trials: Pros and Cons.Cardiology. 2022;147(3):235-247. doi: 10.1159/000524948. Epub 2022 May 10. Cardiology. 2022. PMID: 35537418 Free PMC article. Review.
Cited by
-
Risk prediction models for depression in patients with coronary heart disease: a systematic review and meta-analysis.Front Cardiovasc Med. 2025 Jan 15;11:1522619. doi: 10.3389/fcvm.2024.1522619. eCollection 2024. Front Cardiovasc Med. 2025. PMID: 39882318 Free PMC article.
-
Inflammatory Biomarkers in Coronary Artery Disease: Insights From Mendelian Randomization and Transcriptomics.J Inflamm Res. 2025 Mar 4;18:3177-3200. doi: 10.2147/JIR.S507274. eCollection 2025. J Inflamm Res. 2025. PMID: 40059946 Free PMC article.
-
Molecular pathways in cardiovascular disease under hypoxia: Mechanisms, biomarkers, and therapeutic targets.J Biomed Res. 2025 Mar 20;39(3):254-269. doi: 10.7555/JBR.38.20240387. J Biomed Res. 2025. PMID: 40122680 Free PMC article.
-
Vitamin D Receptor Regulates Oxidative Stress and Apoptosis Via the HIF-1α/HO-1 Pathway in Cardiomyocytes.Cell Biochem Biophys. 2025 Feb 11. doi: 10.1007/s12013-025-01681-x. Online ahead of print. Cell Biochem Biophys. 2025. PMID: 39934512
References
-
- Xu Y, Mintz GS, Tam A, McPherson JA, Iniguez A, Fajadet J, et al. Prevalence, distribution, predictors, and outcomes of patients with calcified nodules in native coronary arteries: a 3-vessel intravascular ultrasound analysis from providing regional observations to study predictors of events in the coronary tree (PROSPECT). Circulation. (2012) 126(5):537–45. 10.1161/CIRCULATIONAHA.111.055004 - DOI - PubMed
LinkOut - more resources
Full Text Sources