

Identification of hub genes for glaucoma: a study based on bioinformatics analysis and experimental verification
- PMID: 37465497
- PMCID: PMC10333239
- DOI: 10.18240/ijo.2023.07.03
Identification of hub genes for glaucoma: a study based on bioinformatics analysis and experimental verification
Abstract
Aim: To explore hub genes for glaucoma based on bioinformatics analysis and an experimental model verification.
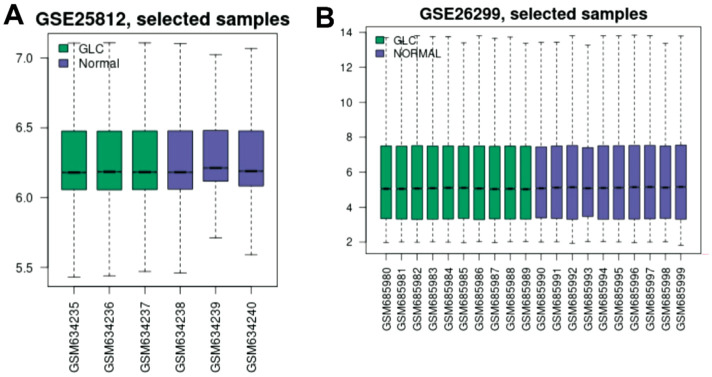
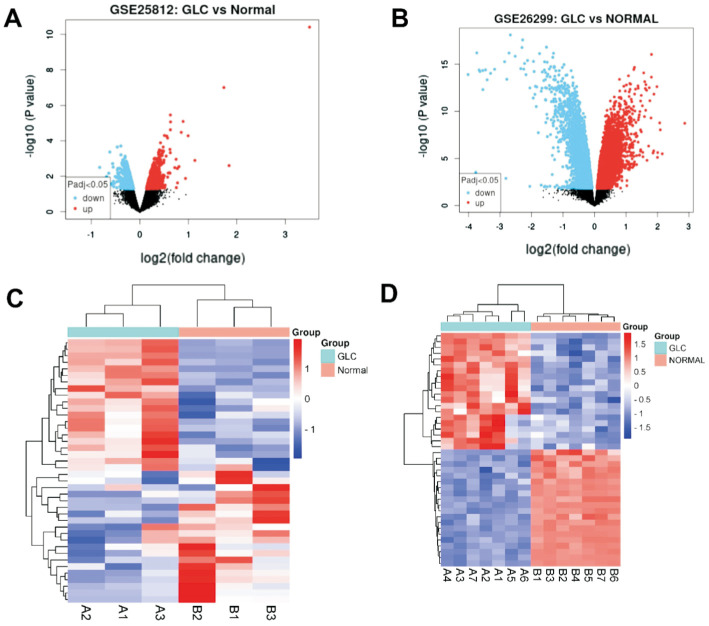
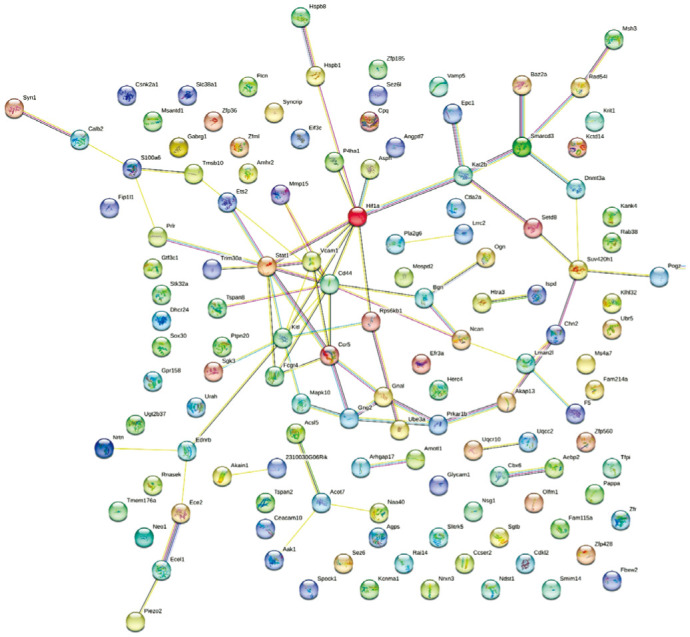
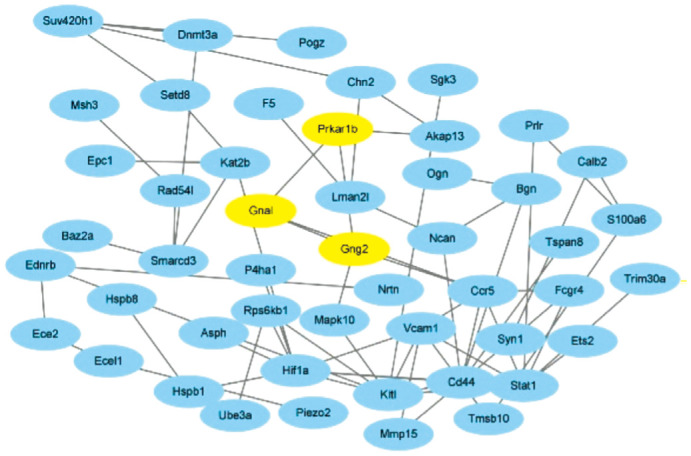
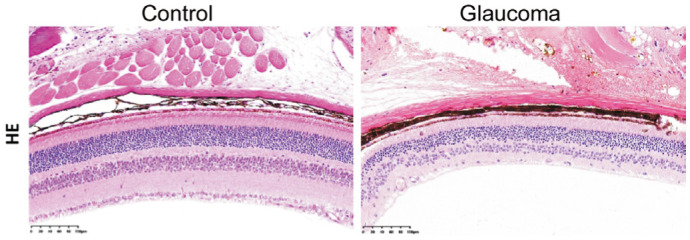
Methods: In the Gene Expression Omnibus (GEO) database, the GSE25812 and GSE26299 datasets were selected to analyze differentially expressed genes (DEGs) by the GEO2R tool. Through bioinformatics analysis, 9 hub genes were identified. Receiver operating characteristic (ROC) curves and principal component analysis (PCA) were performed to verify whether the hub gene can distinguish glaucoma from normal eyes. The mouse model of glaucoma was constructed, and the real-time reverse transcriptase-polymerase chain reaction (RT-qPCR) assay was performed to detect the expression levels of hub genes in glaucoma.
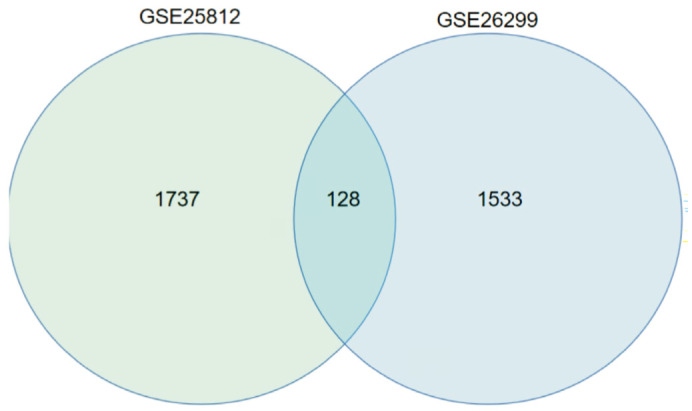
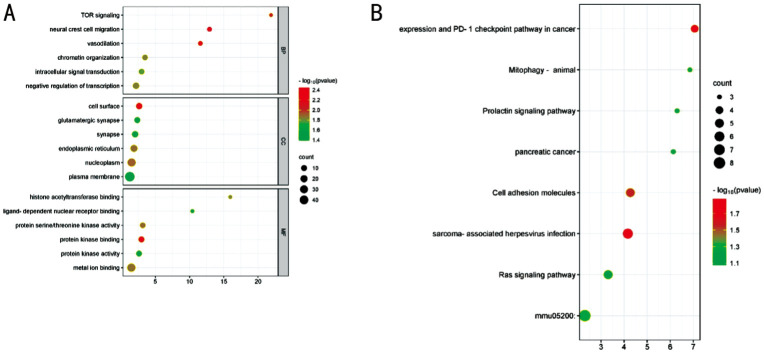
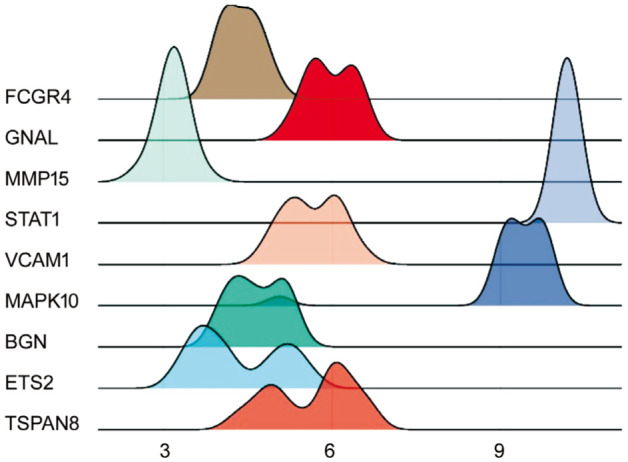
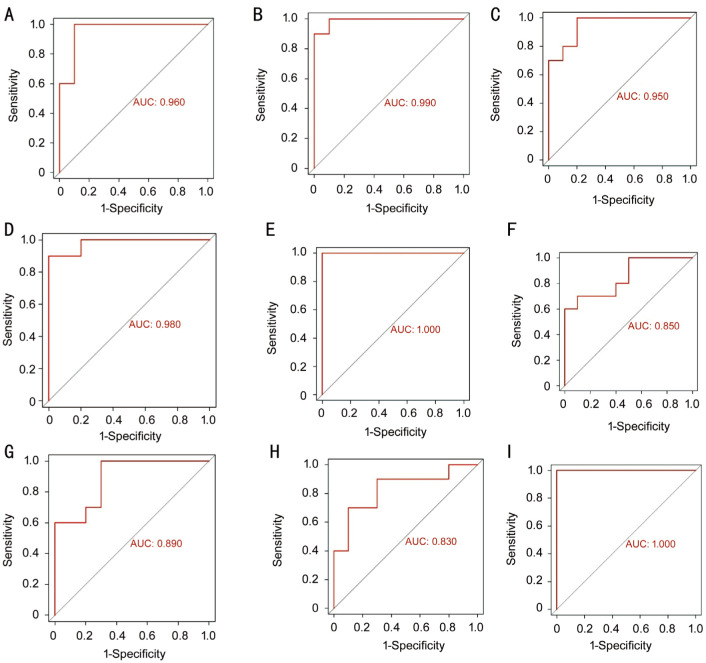
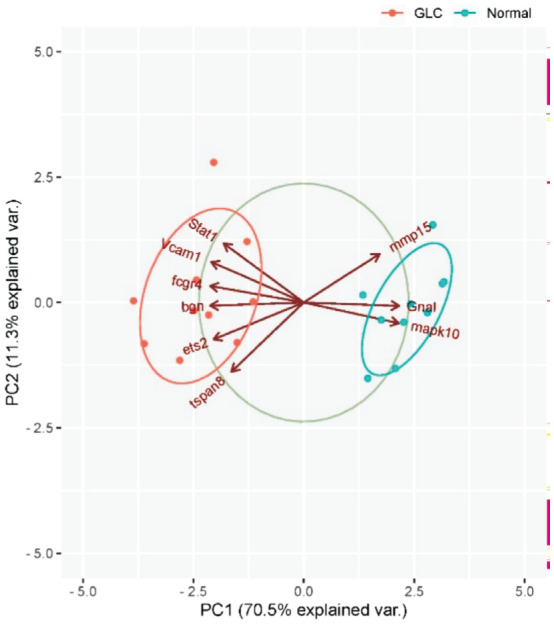
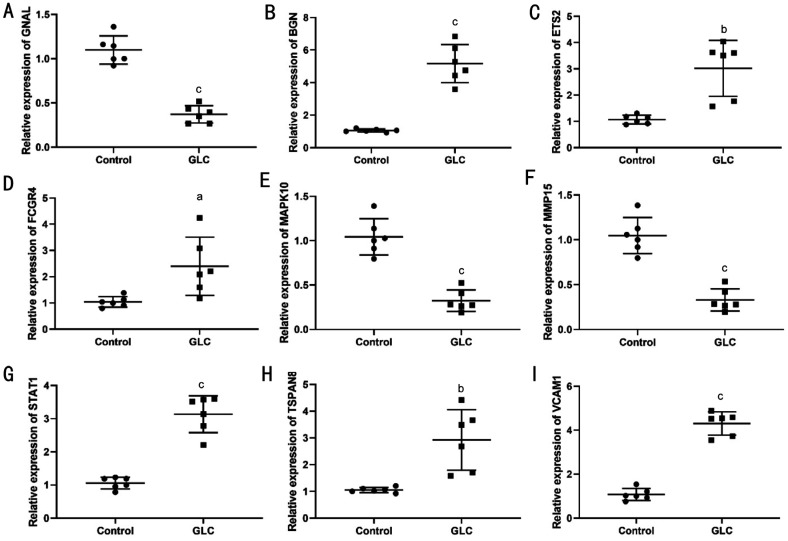
Results: There were 128 overlapping DEGs in the GSE25812 and GSE26299 datasets, mainly involved in intracellular signalling, cell adhesion molecules and the Ras signalling pathway. A total of 9 hub genes were screened out, including GNAL, BGN, ETS2, FCGP4, MAPK10, MMP15, STAT1, TSPAN8, and VCAM1. The area under the curve (AUC) values of 9 hub genes were greater than 0.8. The PC1 axle could provide a 70.5% interpretation rate to distinguish glaucoma from normal eyes. In the ocular tissues of glaucoma in the mice model, the expression of BGN, ETS2, FCGR4, STAT1, TSPAN8, and VCAM1 was increased, while the expression of GNAL, MAPK10, and MMP15 was decreased.
Conclusion: Nine hub genes in glaucoma are identified, which may provide new biomarkers and therapeutic targets for glaucoma.
Keywords: biomarkers; glaucoma; hub genes.
International Journal of Ophthalmology Press.
Figures
Similar articles
-
Integrated bioinformatics analysis of dendritic cells hub genes reveal potential early tuberculosis diagnostic markers.BMC Med Genomics. 2023 Sep 8;16(1):214. doi: 10.1186/s12920-023-01646-0. BMC Med Genomics. 2023. PMID: 37684607 Free PMC article.
-
Integrative analysis of potential biomarkers and immune cell infiltration in Parkinson's disease.Brain Res Bull. 2021 Dec;177:53-63. doi: 10.1016/j.brainresbull.2021.09.010. Epub 2021 Sep 16. Brain Res Bull. 2021. PMID: 34536521
-
Identification of Hub Genes as Potential Prognostic Biomarkers in Cervical Cancer Using Comprehensive Bioinformatics Analysis and Validation Studies.Cancer Manag Res. 2021 Jan 8;13:117-131. doi: 10.2147/CMAR.S282989. eCollection 2021. Cancer Manag Res. 2021. PMID: 33447084 Free PMC article.
-
Identification of Tissue-Specific Expressed Hub Genes and Potential Drugs in Rheumatoid Arthritis Using Bioinformatics Analysis.Front Genet. 2022 Mar 18;13:855557. doi: 10.3389/fgene.2022.855557. eCollection 2022. Front Genet. 2022. PMID: 35368701 Free PMC article.
-
Identification of key genes and biological pathways in Chinese lung cancer population using bioinformatics analysis.PeerJ. 2022 Jan 31;10:e12731. doi: 10.7717/peerj.12731. eCollection 2022. PeerJ. 2022. PMID: 35178291 Free PMC article.
Cited by
-
DAMPs Drive Fibroinflammatory Changes in the Glaucomatous ONH.Invest Ophthalmol Vis Sci. 2024 Oct 1;65(12):13. doi: 10.1167/iovs.65.12.13. Invest Ophthalmol Vis Sci. 2024. PMID: 39382882 Free PMC article.
-
NMI, POLR3G and APIP are the key molecules connecting glaucoma with high intraocular pressure: a clue for early diagnostic biomarker candidates.Int J Ophthalmol. 2024 Nov 18;17(11):1987-1994. doi: 10.18240/ijo.2024.11.03. eCollection 2024. Int J Ophthalmol. 2024. PMID: 39559319 Free PMC article.
-
Molecular Regulation and Oncogenic Functions of TSPAN8.Cells. 2024 Jan 19;13(2):193. doi: 10.3390/cells13020193. Cells. 2024. PMID: 38275818 Free PMC article. Review.
-
Identification and validation of oxidative stress-related genes in primary open-angle glaucoma by weighted gene co-expression network analysis and machine learning.Medicine (Baltimore). 2024 Nov 15;103(46):e40389. doi: 10.1097/MD.0000000000040389. Medicine (Baltimore). 2024. PMID: 39560561 Free PMC article.
References
-
- Kang JM, Tanna AP. Glaucoma. Med Clin North Am. 2021;105(3):493–510. - PubMed
-
- Saha BC, Kumari R, Sinha BP, Ambasta A, Kumar S. Lasers in glaucoma: an overview. Int Ophthalmol. 2021;41(3):1111–1128. - PubMed
-
- Lim R. The surgical management of glaucoma: a review. Clin Exp Ophthalmol. 2022;50(2):213–231. - PubMed
LinkOut - more resources
Full Text Sources
Research Materials
Miscellaneous