

Association of Serum Bile Acid and Unsaturated Fatty Acid Profiles with the Risk of Diabetic Retinopathy in Type 2 Diabetic Patients
- PMID: 37465650
- PMCID: PMC10351529
- DOI: 10.2147/DMSO.S411522
Association of Serum Bile Acid and Unsaturated Fatty Acid Profiles with the Risk of Diabetic Retinopathy in Type 2 Diabetic Patients
Abstract
Aim: We aimed to identify the ability of serum bile acids (BAs) and unsaturated fatty acids (UFAs) profiles to predict the development of diabetic retinopathy (DR) in type 2 diabetes mellitus (T2DM) patients.
Methods: We first used univariate and multivariate analysis to compare 15 serum BA and 11 UFA levels in healthy control (HC) group (n = 82), T2DM patients with DR (n = 58) and T2DM patients without DR (n = 60). Forty T2DM patients were considered for validation. Then, the receiver operating characteristic curve (ROC) and decision curve analysis were used to assess the diagnostic value and clinical benefit of serum biomarkers alone, clinical variables alone or in combination, and the area under the curve (AUC), integrated discrimination improvement (IDI), and net reclassification improvement (NRI) were used to further assess whether the addition of biomarkers significantly improved the predictive ability of the model.
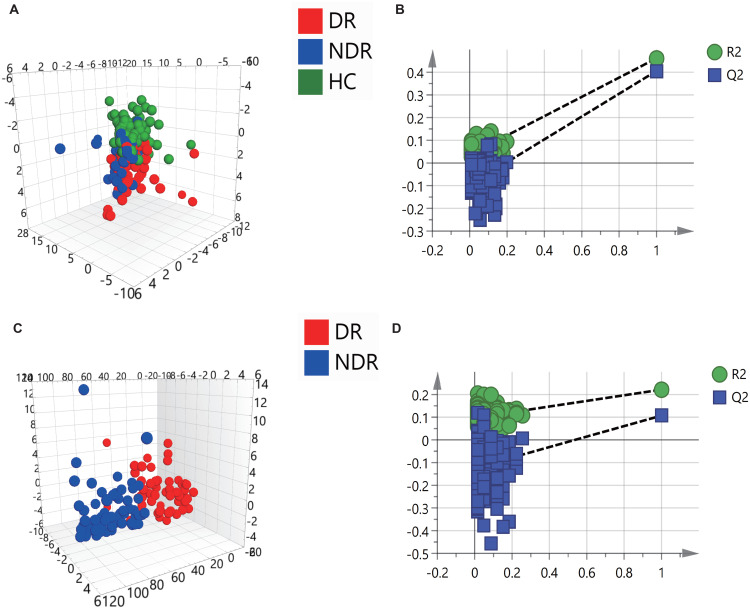
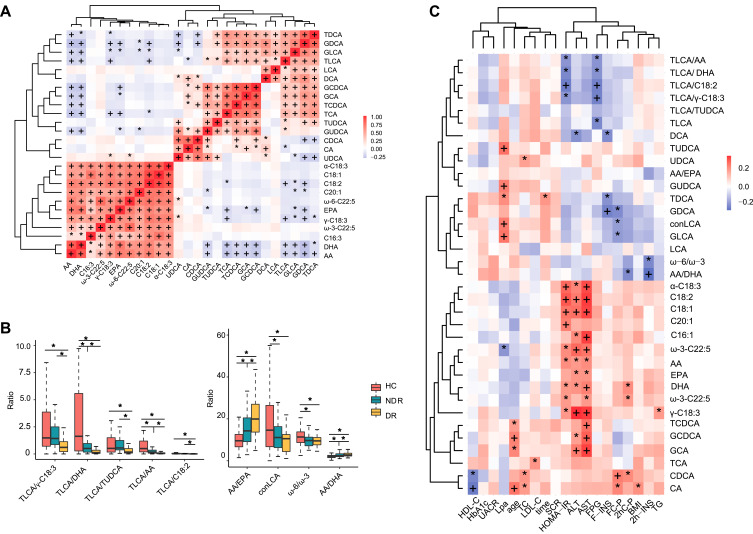
Results: Orthogonal partial least squares-discriminant analysis (OPLS-DA) of serum BAs and UFAs separated the three cohorts including HC, T2DM patients with or without DR. The difference in serum BA and UFA profiles of T2DM patients with or without DR was mainly manifested in the three metabolites of taurolithocholic acid (TLCA), tauroursodeoxycholic acid (TUDCA) and arachidonic acid (AA). Together, they had an AUC of 0.785 (0.918 for validation cohort) for predicting DR in T2DM patients. After adjusting for numerous confounding factors, TLCA, TUDCA, and AA were independent predictors that differentiated T2DM with or without DR. The results of AUC, IDI, and NRI demonstrated that adding these three biomarkers to a model with clinical variables statistically increased their predictive value and were replicated in our independent validation cohort.
Conclusion: These findings highlight the association of three metabolites, TLCA, TUDCA and AA, with DR and may indicate their potential value in the pathogenesis of DR.
Keywords: diabetic retinopathy; serum bile acid; type 2 diabetes mellitus; unsaturated fatty acid.
© 2023 Feng et al.
Conflict of interest statement
The authors declare that they have no known competing financial interests or personal relationships that could have appeared to influence the work reported in this paper.
Figures

Similar articles
-
Serum Bile Acid Profiles Improve Clinical Prediction of Nonalcoholic Fatty Liver in T2DM patients.J Proteome Res. 2021 Aug 6;20(8):3814-3825. doi: 10.1021/acs.jproteome.1c00104. Epub 2021 May 27. J Proteome Res. 2021. PMID: 34043368
-
Serum bile acid and unsaturated fatty acid profiles of non-alcoholic fatty liver disease in type 2 diabetic patients.World J Diabetes. 2024 May 15;15(5):898-913. doi: 10.4239/wjd.v15.i5.898. World J Diabetes. 2024. PMID: 38766436 Free PMC article.
-
The Diagnostic Value of Bile Acids and Amino Acids in Differentiating Acute Coronary Syndromes.Int J Gen Med. 2025 Jan 15;18:179-189. doi: 10.2147/IJGM.S499046. eCollection 2025. Int J Gen Med. 2025. PMID: 39834909 Free PMC article.
-
Serum Untargeted Metabolomics Reveal Potential Biomarkers of Progression of Diabetic Retinopathy in Asians.Front Mol Biosci. 2022 Jun 9;9:871291. doi: 10.3389/fmolb.2022.871291. eCollection 2022. Front Mol Biosci. 2022. PMID: 35755823 Free PMC article.
-
Increased serum periostin concentrations are associated with the presence of diabetic retinopathy in patients with type 2 diabetes mellitus.J Endocrinol Invest. 2018 Aug;41(8):937-945. doi: 10.1007/s40618-017-0820-x. Epub 2018 Jan 18. J Endocrinol Invest. 2018. PMID: 29349642
Cited by
-
Unveiling the gut-eye axis: how microbial metabolites influence ocular health and disease.Front Med (Lausanne). 2024 May 10;11:1377186. doi: 10.3389/fmed.2024.1377186. eCollection 2024. Front Med (Lausanne). 2024. PMID: 38799150 Free PMC article. Review.
