. 2023 Jul 3:14:1196829.
doi: 10.3389/fimmu.2023.1196829. eCollection 2023.

Cyto-IL-15 synergizes with the STING agonist ADU-S100 to eliminate prostate tumors and confer durable immunity in mouse models

Affiliations

Cyto-IL-15 synergizes with the STING agonist ADU-S100 to eliminate prostate tumors and confer durable immunity in mouse models

Efthymia Papaevangelou et al. Front Immunol. .

Abstract

Introduction: Prostate cancer is one of the most commonly diagnosed malignancies in men with high mortality rates. Despite the recent therapeutic advances, such as immunotherapies, survival of patients with advance disease remains significantly low. Blockade of immune checkpoints has led to low response rates in these patients probably due to the immunosuppressive microenvironment and low mutation burden of prostate tumors. Combination of multiple immunotherapeutic regimes has also been unsatisfactory due to augmented adverse effects. To activate multiple immune-stimulatory pathways in the hostile prostate cancer microenvironment, we used a combination of cytotopically modified interleukin-15 (cyto-IL-15) with the stimulator of interferon genes (STING) agonist, ADU-S100.

Methods: To determine whether this combination regime could lead to both local and systemic anti-tumor effects, intratumoral administration of these agents was used in murine models of prostate cancer. Tumor growth and mouse survival were monitored, and ex vivo analyses, and RNA sequencing were performed on the tumors.

Results: Intratumorally injected ADU-S100 and cyto-IL-15 synergized to eliminate tumors in 58-67% of mice with unilateral tumors and promoted abscopal immunity in 50% of mice with bilateral tumors treated only at one side. Moreover, this combination regime offered immunoprotection against tumor rechallenge in 83% of cured mice. The efficacy of the combination treatment was associated with a strong innate and adaptive immune activation and induction of apoptotic and necrotic cell death. Cytokines, including type I and II interferons, and cytokine signalling pathways were activated, NK and T cell mediated cytotoxicity was increased, and B cells were activated both locally and systemically. While ADU-S100 led to an ulcerative pathology at the injection site, no other adverse effects were observed.

Discussion: Localised administration of a STING agonist together with cyto-IL-15 can confer significant systemic benefits and long-lasting immunity against prostate tumors while reducing immune related toxicities.

Keywords: IL-15; STING agonist; abscopal immunity; immunotherapy; prostate cancer.


Conflict of interest statement

Authors CG, EP and PD are inventors in a patent application number WO2021058973A1 on lL-15 fusion peptides used to treat cancer. Authors CG, EP and PD are also inventors in a filed patent application number 2304385.4 on combination of cytotopically tailed IL-15 with a STING agonist. The remaining author declares that the research was conducted in the absence of any commercial or financial relationships that could be construed as a potential conflict of interest.

Figures

Figure 1
Figure 1
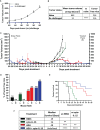
Combination of ADU-S100 with cyto-IL-15 leads to complete regression of subcutaneous prostate tumors in mice. (A-D) Mice with TRAMP-C1 tumors (right flank) treated intratumorally with HBSS, cyto-IL-15, ADU or combination of ADU with cyto-IL-15. (A) Tumor volumes up to day 28 after treatment (when most mice were still alive), and (B) tumor growth curves. Data are means + 1 SEM for n = 6 tumors per group and comparisons are relative to vehicle. (C) Survival curves of mice post-treatment and (D) table showing the median survival and the tumor-free mice of each group. (E-H) Mice with TRAMP-C2 tumors (right flank) treated intratumorally with HBSS, cyto-IL-15, ADU, combination of ADU with IL-15 or combination of ADU with cyto-IL-15. (E) Tumor volumes up to day 20 after treatment and (F) tumor growth curves. Data are means + 1 SEM for n = 6-12 tumors per group and comparisons are relative to vehicle. (G) Survival curves of mice post-treatment and (H) table showing the median survival and the tumor-free mice of each group. (I-L) Humanized mice with PC3 tumors treated intratumorally with HBSS or combination of ADU with cyto-IL-15. (I) Tumor volumes up to day 22 after treatment and (J) tumor growth curves. Data are means + 1 SEM for n =5 tumors per group and comparisons are relative to vehicle. (K) Survival curves of mice post-treatment, and (L) table showing the median survival and the tumor-free mice of each group. One-way ANOVA with Dunnett’s multiple comparisons post-test was used to compare tumor volumes and Log-rank (Mantel-Cox) test was used for comparisons of equality of two survival curves (*p < 0.05, **p <0.01, ***p <0.001, ****p <0.0001). Undefined survival means that more than 50% of the mice were still alive at the end of the study (60 days post-treatment if tumors did not regrow).
Figure 2
Figure 2
ADU-S100 combined with cyto-IL-15 generates systemic antitumor immunity in TRAMP-C2 subcutaneous prostate tumors in mice. (A, B) Mice with TRAMP-C2 tumors (right flank) that were cured after treatment with ADU and cyto-IL-15 combination were rechallenged in the distal flank (left) with TRAMP-C2 cells 26-40 days after the original treated tumor complete regressed. Naïve mice of the same age were challenged on the left flank with TRAMP-C2 cells to be used as controls. (A) Growth curves of distal tumors and (B) table showing the median tumor volume at Day 60 post-left tumor challenge and tumor-free mice per group. Data are means +1 SEM for n = 6 mice per group and tumor volumes were compared using unpaired t test (****p <0.0001). (C-F) Mice were challenged with TRAMP-C2 cells in the right flank and two weeks later they were challenged again with TRAMP-C2 cells in the distal (left) flank. When the initial right tumors were ~50 mm3 mice were treated intratumorally in the right flank only with HBSS, cyto-IL-15, ADU or combination of ADU with cyto-IL-15. (C) Tumor growth curves up to day 60 post-treatment, (D) percentage of tumor-free mice for both right and lefts tumors (numbers on top of the bars indicate actual mouse numbers), (E) survival curves of mice post-treatment, and (F) table showing the median survival of each treatment cohort. Data are means + 1 SEM for n = 8 mice per group and comparisons of equality of two survival curves were performed using Log-rank (Mantel-Cox) test (**p <0.01, ***p <0.001, ****p <0.0001).
Figure 3
Figure 3
Histological assessment of treated TRAMP-C2 subcutaneous prostate tumors. (A) Composite images of H&E-stained sections indicating necrotic areas. (B) RGB images from tumor sections stained with the apoptotic marker cleaved caspase‐3 (CC3) detected using an Alexa‐546‐conjugated secondary antibody (red) and the nucleic marker DAPI (blue). (C, D) Quantification of (C) necrotic area and (D) cleaved caspase‐3 positive area. Results are means +1 SEM of 10 images per tumor for n = 6 per group. Comparisons are relative to vehicle unless otherwise indicated (*p <0.05, ****p <0.0001 one-way ANOVA with Tukey’s multiple comparisons post-test).
Figure 4
Figure 4
Cytokine activation in treated mice with TRAMP-C2 prostate tumors. (A, B) Concentration of cytokines in (A) blood plasma and (B) tumor lysates from mice treated with HBSS, cyto-IL-15, ADU or combination of ADU and cyto-IL-15 measured using a cytokine bead array. (C) Concentration of IL-15Rα in tumor lysates from the same mice measured with ELISA. Values for tumor lysates were normalized to tumor protein concentration. Results are means +1 SEM of duplicate measurements made for n = 6 mice per cohort. Comparisons are relative to vehicle unless otherwise indicated (*p <0.05, **p <0.01, ***p <0.001, ****p <0.0001 one-way ANOVA with Dunnett’s multiple comparisons post-test).
Figure 5
Figure 5
Analysis of immune cell composition of splenocytes in treated mice with TRAMP-C2 prostate tumors. Mice with TRAMP-C2 tumors (~200mm3) were treated intratumorally with HBSS, cyto-IL-15, ADU or combination of ADU and cyto-IL-15 and splenocytes were harvested after 6 days of treatment initiation to be analyzed using flow cytometry. (A-H) Frequencies of cell subsets within the CD45+ immune cell population: (A) B cells, (B) dendritic cells, (C) macrophages, (D) CD4+ T cells, (E) CD8+ T cells, (F) NK cells, and (G) NKT cells. (H-K) Frequencies of (H) Ki67+, (I) IFN-γ+ and (J) perforin+ CD8+ T cells, and (K) IFN-γ+ NK cells of splenocytes with or without PMA and ionomycin stimulation for 4 h. Results are means +1 SEM of measurements made for n = 6 mice per cohort. Comparisons are relative to control (* for HBSS and # for HBSS with stimulus) unless otherwise indicated (*p <0.05, **p <0.01, ***p <0.001, ****p <0.0001, ### p <0.001, #### p <0.0001 one-way ANOVA with Dunnett’s multiple comparisons post-test or Šidák’s for comparisons of stimulated versus non-stimulated samples).
Figure 6
Figure 6
Treatment with ADU-S100 induces significant changes in gene expression in TRAMP-C2 prostate tumors. Differential gene expression analysis followed by gene ontology analysis between tumors treated with HBSS (control) versus ADU (left panel), and HBSS versus combination of ADU with cyto-IL-15 (right panel) (n = 3/cohort). (A) Volcano plots mapping the fold changes against adjusted p-values (padj) highlighting significantly differentially expressed genes. Upregulated significant genes are indicated by red dots (padj < 0.05 and log2 fold change >1), downregulated significant genes are green (padj < 0.05 and log2 fold change <-1), and non-significant genes are grey. (B) Bi-clustering heatmaps of the log2-transformed expression values in each sample showing the expression profiles of the top 30 differentially expressed genes. Blue colors indicate lower, while yellow colors indicate higher relative expression. (C) Gene ontology (GO) of the top 20 enriched functions ranked based on their log2-transformed p-value (< 0.05) for each of the comparisons. The size of a bubble represents the percentage of functional genes covered, while numbers next to the bars indicate the number of significantly DEG involved in each biological process.

Similar articles

Cited by

References

    1. Mattiuzzi C, Lippi G. Current cancer epidemiology. J Epidemiol Glob Health (2019) 9(4):217–22. doi: 10.2991/jegh.k.191008.001 - DOI - PMC - PubMed
    1. Jemal A, Fedewa SA, Ma J, Siegel R, Lin CC, Brawley O, et al. . Prostate cancer incidence and PSA testing patterns in relation to USPSTF screening recommendations. JAMA (2015) 314(19):2054–61. doi: 10.1001/jama.2015.14905 - DOI - PubMed
    1. Siegel RL, Miller KD, Jemal A. Cancer statistics, 2018. CA Cancer J Clin (2018) 68(1):7–30. doi: 10.3322/caac.21442 - DOI - PubMed
    1. Kantoff PW, Higano CS, Shore ND, Berger ER, Small EJ, Penson DF, et al. . Sipuleucel-T immunotherapy for castration-resistant prostate cancer. N Engl J Med (2010) 363(5):411–22. doi: 10.1056/NEJMoa1001294 - DOI - PubMed
    1. van Dorp J, van Montfoort ML, van Dijk N, Hofland I, de Feijter JM, Bergman AM, et al. . A serendipitous preoperative trial of combined ipilimumab plus nivolumab for localized prostate cancer. Clin Genitourin Cancer. (2022) 20(2):e173–e9. doi: 10.1016/j.clgc.2021.12.004 - DOI - PubMed

Publication types