. 2023 Jul 3:14:1142228.
doi: 10.3389/fimmu.2023.1142228. eCollection 2023.

Cell type- and time-dependent biological responses in ex vivo perfused lung grafts

Affiliations

Cell type- and time-dependent biological responses in ex vivo perfused lung grafts

Carla Gouin et al. Front Immunol. .

Abstract

In response to the increasing demand for lung transplantation, ex vivo lung perfusion (EVLP) has extended the number of suitable donor lungs by rehabilitating marginal organs. However despite an expanding use in clinical practice, the responses of the different lung cell types to EVLP are not known. In order to advance our mechanistic understanding and establish a refine tool for improvement of EVLP, we conducted a pioneer study involving single cell RNA-seq on human lungs declined for transplantation. Functional enrichment analyses were performed upon integration of data sets generated at 4 h (clinical duration) and 10 h (prolonged duration) from two human lungs processed to EVLP. Pathways related to inflammation were predicted activated in epithelial and blood endothelial cells, in monocyte-derived macrophages and temporally at 4 h in alveolar macrophages. Pathways related to cytoskeleton signaling/organization were predicted reduced in most cell types mainly at 10 h. We identified a division of labor between cell types for the selected expression of cytokine and chemokine genes that varied according to time. Immune cells including CD4+ and CD8+ T cells, NK cells, mast cells and conventional dendritic cells displayed gene expression patterns indicating blunted activation, already at 4 h in several instances and further more at 10 h. Therefore despite inducing inflammatory responses, EVLP appears to dampen the activation of major lung immune cell types, what may be beneficial to the outcome of transplantation. Our results also support that therapeutics approaches aiming at reducing inflammation upon EVLP should target both the alveolar and vascular compartments.

Keywords: inflammation; lung; monocyte/macrophages; single cell RNA-seq; transplantation.


Conflict of interest statement

The authors declare that the research was conducted in the absence of any commercial or financial relationships that could be construed as a potential conflict of interest.

Figures

Figure 1
Figure 1
Single cell RNA-seq analysis of lung samples at 3 EVLP timing (0, 4, 10 h) and definition of cell identities. (A) The scRNA-seq data of the 6 samples (2 donors, 3 timings) were processed for high quality transcriptomes, integrated, clustered and submitted to cell annotation analysis with the Azimuth package (see Additional file 2 and Methods). Cells with low annotation scores (< 0.6) and minor identities (<10% of a cluster) were excluded and the remaining cells were projected onto the “integrated UMAP-filtered” shown in A, with 17 clusters (C0 to C16, shown on the UMAP). Cell identities (23 in total) were determined by i) the belonging to a cluster of the “integrated UMAP-filtered” (Cx number), ii) the Azimuth-based annotation and iii) a grouping of “close cell subtypes” into a generic cell type annotation (see Additional files 2 , 6 ). The 23 cell identities are each associated to a distinct color related to a dominant tint corresponding to major cell type family (green for myeloid, pink for lymphoid, blue for epithelial and stromal, gold for vascular cells); these colors will be kept in the subsequent figures. The scRNA-seq data are available on an interactive viewer (https://applisweb.vim.inrae.fr/Human_EVLP). The number of cells originating from donor 1 and donor 2 in each cell identity is reported between brackets. Ambiguous identities were excluded (C6-AMs, C6-AT2s, C16-AMs, C16-Mast cells)) leading to 19 cell identities used for subsequent analyses. (B) Hallmark genes supporting the identification of the different cell identities were selected from the top expressed genes common to both donors ( Additional file 7 ). (C) Violin plots showing the original level of expression of selected hallmark genes in the 19 cell identities of donor 2 (similar in donor 1).
Figure 2
Figure 2
Computational inference of the changes induced by EVLP in lung epithelial cells. (A) The differentially expressed genes (DEGs, adjusted p-values p < 0.05, Log2FC > 0.4) in alveolar type 2 (AT2s) and alveolar type 1 (AT1s) between 4 h vs 0 h and 10 h vs 0 h were submitted to Ingenuity Pathways Analysis. The pathways and functions that showed z-scores < -1.9 or > 1.9 consistently in both donors (D1, D2) at 4 h or 10 h are presented as a heatmap, with stop colors indicated on the scale. The z-score values are reported for each condition (donor, timing), with values < -2 or > 2 being considered by IPA as significantly predictive of inhibition or activation respectively. Functions/pathways in bold fonts are mentioned in the main text. The modulated expressions of the contributing genes to the functions/pathways marked with a star (*) are provided in Additional file 11 . (B) Bubblemap showing the Gene Set Enrichment Analysis performed on comparisons between 4 h vs 0 h and 10 h vs 0 h for AT2s and AT1s using the Hallmark (H) gene sets of the MSigDB. The leading edge genes that contribute the most to the enrichments are provided in Additional file 12 . The genesets enriched at 4 h or 10 h vs 0 h are represented as red bubbles when positively enriched and as blue bubbles when negatively enriched. The circle area is proportional to the Normalized Enrichment Score (NES) and the color intensity corresponds to the False Discovery Rate (FDR, significance < 0.25).
Figure 3
Figure 3
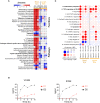
Computational inference of the changes induced by EVLP in endothelial cells (ECs). (A) The differentially expressed genes (DEGs, adjusted p-values p < 0.05, Log2FC > 0.4) in the blood and lymph endothelial cells (ECs) between 4 h and 10 h vs 0 h were submitted to Ingenuity Pathways Analysis. The predicted pathways and functions are illustrated as in Figure 2A . Functions/pathways in bold fonts are mentioned in the main text. The modulated expressions of the contributing genes to the functions/pathways marked with a star (*) are provided in Additional file 13 . (B) Dosage of soluble ICAM and VCAM in the perfusion liquids of donor 1 and 2 by ELISA. (C) Bubblemap showing the Gene Set Enrichment Analysis performed on comparisons between 4 h vs 0 h and 10 h vs 0 h for the endothelial cells, like done in Figure 2B . The leading edge genes that contribute the most to the enrichments are provided in Additional file 12 .
Figure 4
Figure 4
Computational inference of the changes induced by EVLP in lymphoid cells. (A) The differentially expressed genes (DEGs, adjusted p-values p < 0.05, Log2FC > 0.4) in the C7-CD4+ T cells, CD8+ T cells and NK cells between 4 h and 10 h vs 0 h were submitted to Ingenuity Pathways Analysis. The predicted pathways and functions are illustrated as in Figure 2A . Functions/pathways in bold fonts are mentioned in the main text. The modulated expressions of the contributing genes to the functions/pathways marked with a star (*) are provided in Additional file 14 . (B) Bubblemap showing the Gene Set Enrichment Analysis performed on comparisons between 4 h vs 0 h and 10 h vs 0 h for the lymphoid cells, like done in Figure 2B . The leading edge genes that contribute the most to the enrichments are provided in Additional file 12 .
Figure 5
Figure 5
Computational inference of the changes induced by EVLP in myeloid cells. (A) The differentially expressed genes (DEGs, adjusted p-values p < 0.05, Log2FC > 0.4) in alveolar macrophages (AMs), monocyte-derived-macrophages (MoMacs), classical monocytes (cMos), non-classical monocytes (ncMos), mast cells and conventional type 2 dendritic cells (cDC2s) between 4 h and 10 h vs 0 h were submitted to Ingenuity Pathways Analysis. The predicted modulated pathways and functions are illustrated as in Figure 2A . Functions/pathways in bold fonts are mentioned in the main text. The modulated expressions of the contributing genes to the functions/pathways marked with a star (*) are provided in Additional file 15 . (B) Bubblemap showing the Gene Set Enrichment Analysis performed on comparisons between 4 h vs 0 h and 10 h vs 0 h of myeloid cell types, like done in Figure 2B . The leading edge genes that contribute the most to the enrichments are provided in Additional file 12 .
Figure 6
Figure 6
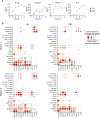
Changes induced by EVLP in cytokine and chemokine protein or mRNA expression. (A) Cytokine detection in perfusion fluid. Perfusion fluid was collected every 2 h of the 10 h EVLP procedure. IL-1β, CXCL8, TNFα were detected with a Multiplex Luminex assay and IL-6 with ELISA. The values of donor 1 (D1) and donor 2 (D2) are in red black, respectively. (B) The normalized average gene expression of each cytokine/chemokine in the different clusters of the two donors is illustrated by the red color intensity in a dot plot. The proportion of cells expressing the reported genes in the cluster is proportional to the circle area. The cytokine/chemokine expression at 4 h that is specific to a cell type family (myeloid, epithelial, stromal/endothelial) is highlighted by a blue rectangle with dash lines. The cytokine/chemokine expression that switches to dominance in MoMacs versus AMs at 10 h is highlighted by a green rectangle. Note that in the samples of donor 1 at 10 h, pDCs were absent (pDC none).

Similar articles

Cited by

References

    1. Possoz J, Neyrinck A, Van Raemdonck D. Ex vivo lung perfusion prior to transplantation: an overview of current clinical practice worldwide. J Thorac Dis (2019) 11(4):1635–50. doi: 10.21037/jtd.2019.04.33 - DOI - PMC - PubMed
    1. Watanabe T, Cypel M, Keshavjee S. Ex vivo lung perfusion. J Thorac Dis (2021) 13(11):6602–17. doi: 10.21037/jtd-2021-23 - DOI - PMC - PubMed
    1. Niikawa H, Okamoto T, Ayyat KS, Itoda Y, Farver CF, McCurry KR. The protective effect of prone lung position on ischemia-reperfusion injury and lung function in an ex vivo porcine lung model. J Thorac Cardiovasc Surg (2019) 157(1):425–33. doi: 10.1016/j.jtcvs.2018.08.101 - DOI - PubMed
    1. Yeung JC, Krueger T, Yasufuku K, de Perrot M, Pierre AF, Waddell TK, et al. . Outcomes after transplantation of lungs preserved for more than 12 h: a retrospective study. Lancet Respir Med (2017) 5(2):119–24. doi: 10.1016/S2213-2600(16)30323-X - DOI - PubMed
    1. Machuca TN, Cypel M, Yeung JC, Bonato R, Zamel R, Chen M, et al. . Protein expression profiling predicts graft performance in clinical ex vivo lung perfusion. Ann Surg (2015) 261(3):591–7. doi: 10.1097/SLA.0000000000000974 - DOI - PubMed

Publication types