

Comprehensive bioinformatics analysis reveals the crosstalk genes and immune relationship between the systemic lupus erythematosus and venous thromboembolism
- PMID: 37465678
- PMCID: PMC10350530
- DOI: 10.3389/fimmu.2023.1196064
Comprehensive bioinformatics analysis reveals the crosstalk genes and immune relationship between the systemic lupus erythematosus and venous thromboembolism
Abstract
Background: It is well known that patients with systemic lupus erythematosus (SLE) had a high risk of venous thromboembolism (VTE). This study aimed to identify the crosstalk genes between SLE and VTE and explored their clinical value and molecular mechanism initially.
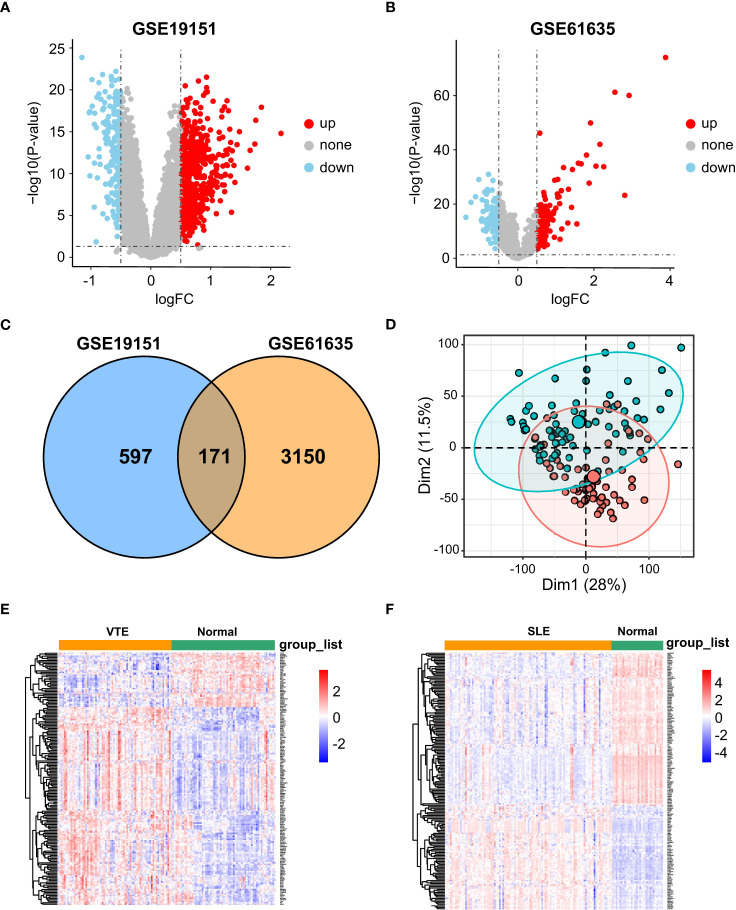
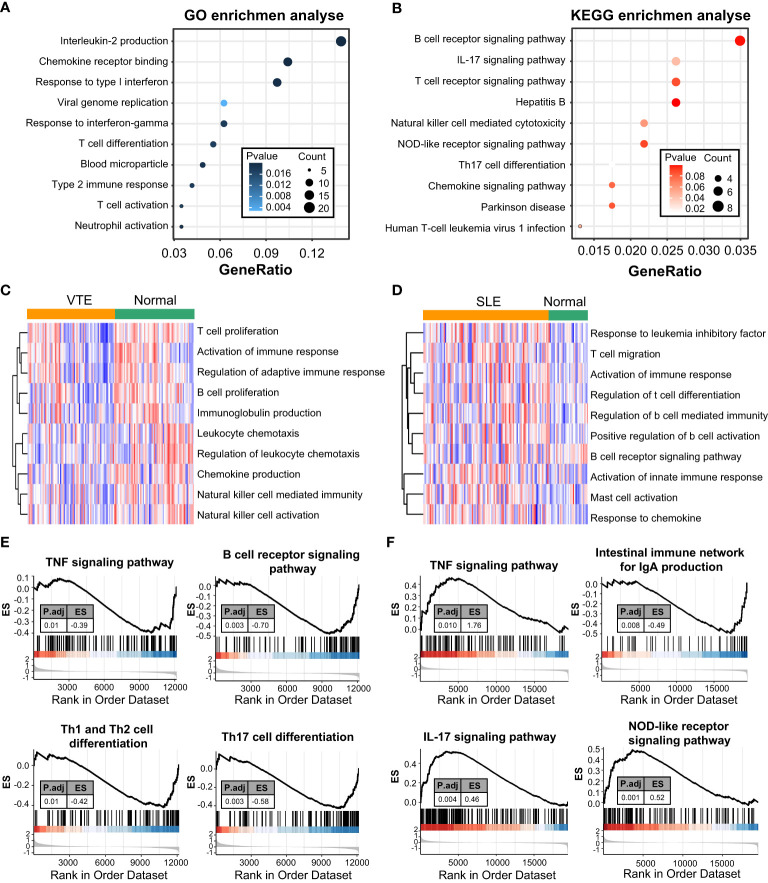
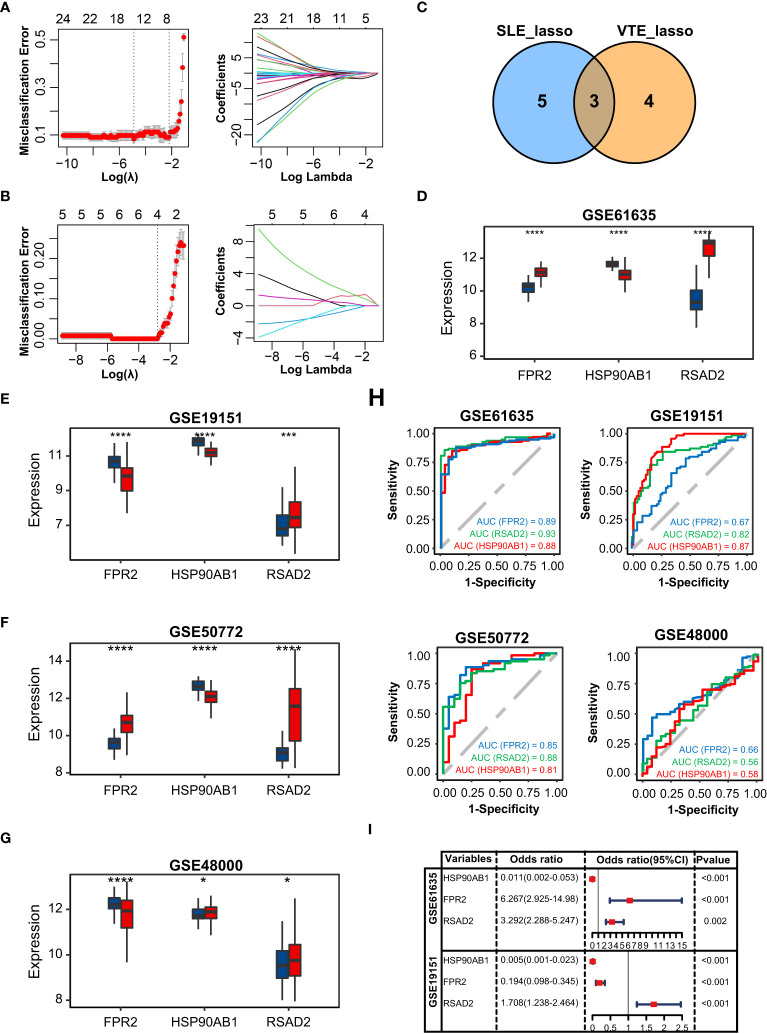
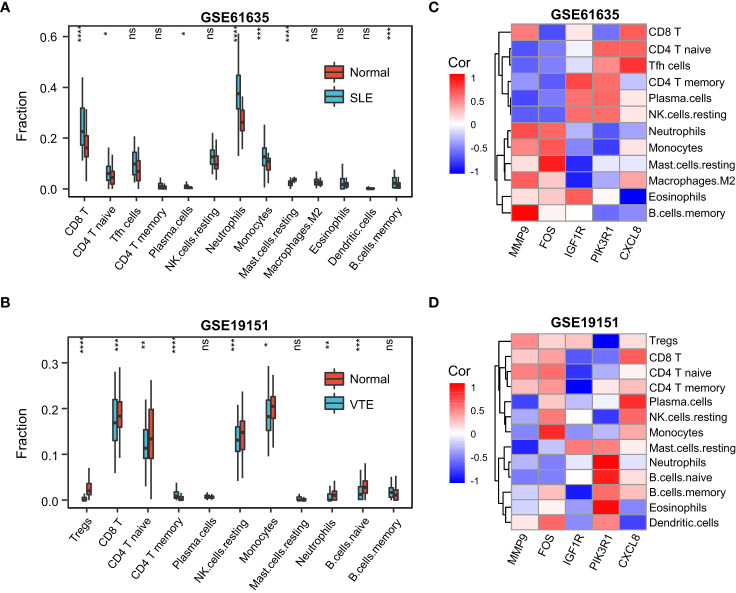
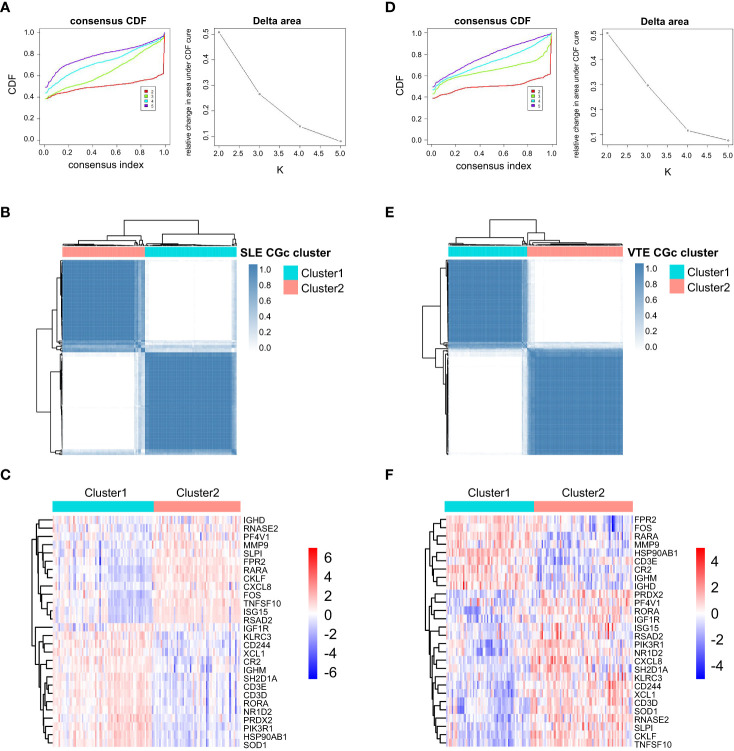
Methods: We downloaded microarray datasets of SLE and VTE from the Gene Expression Omnibus (GEO) dataset. Differential expression analysis was applied to identify the crosstalk genes (CGs). Gene Ontology (GO) and Kyoto Encyclopedia of Genes and Genomes (KEGG) pathway enrichment analyses were performed on the shared genes. The shared diagnostic biomarkers of the two diseases were further screened from CGs using least absolute shrinkage and selection operator (Lasso) regression. Two risk scores for SLE and VTE were constructed separately to predict the likelihood of illness according to the diagnostic biomarkers using a logical regression algorithm. The immune infiltration levels of SEL and VTE were estimated via the CIBERSORT algorithm and the relationship of CGs with immune cell infiltration was investigated. Finally, we explored potential phenotype subgroups in SLE and VTE based on the expression level of CGs through the consensus clustering method and studied immune cell infiltration in different subtypes.
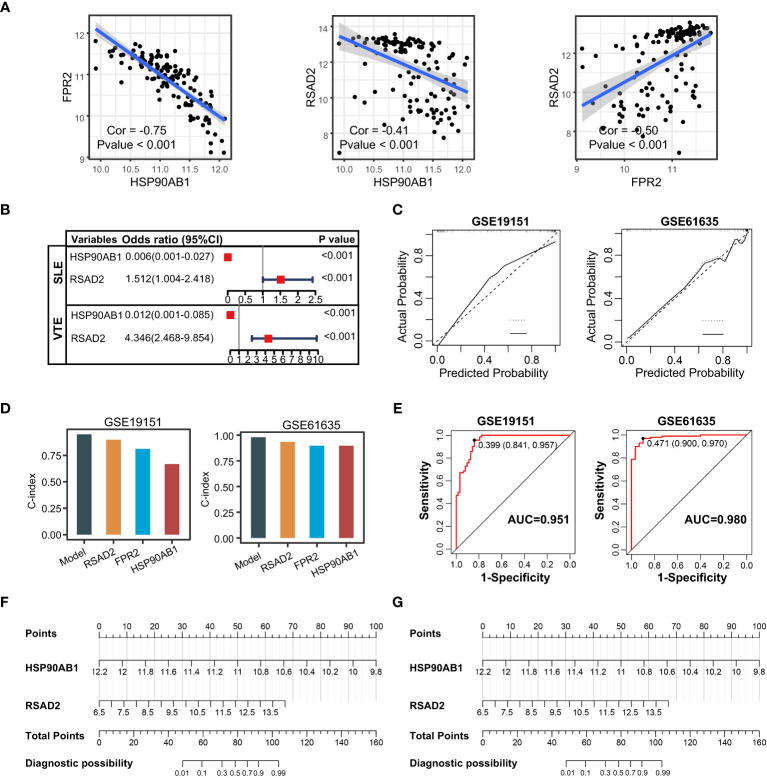
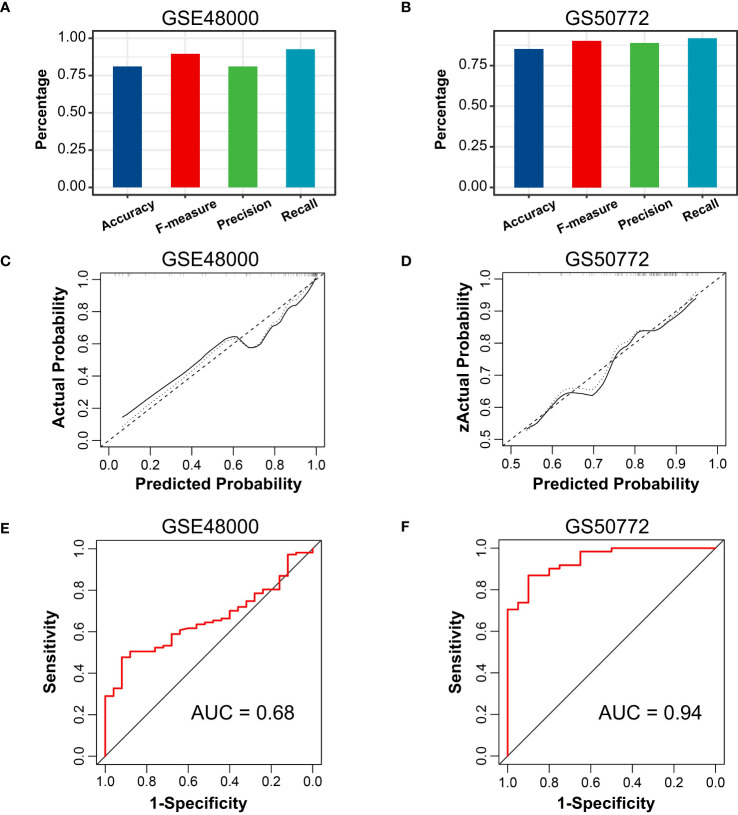
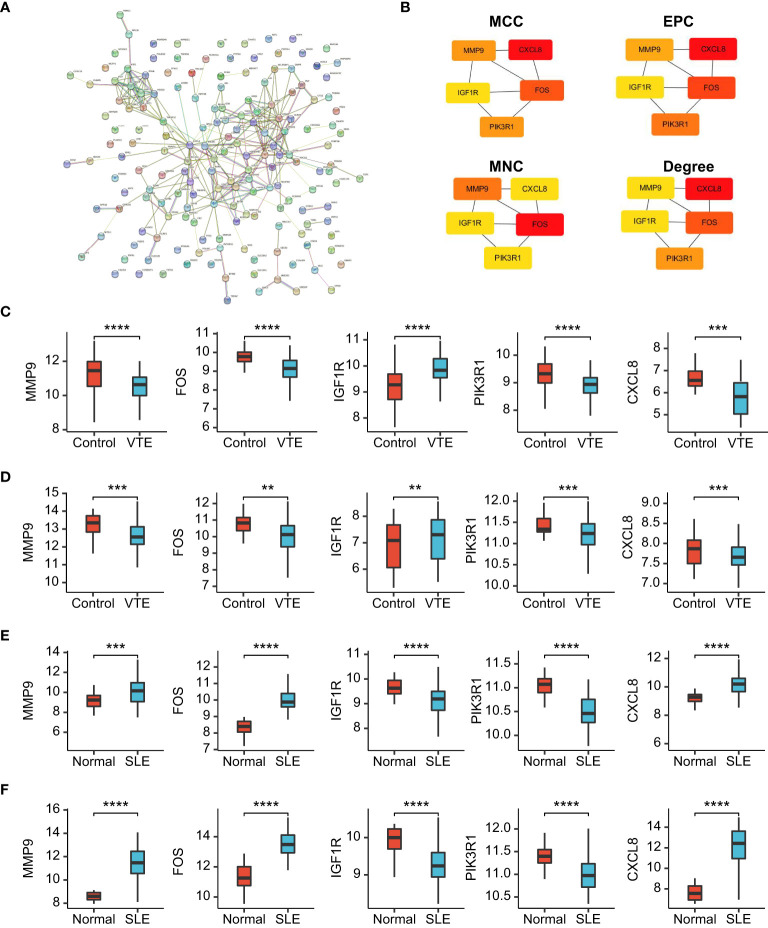
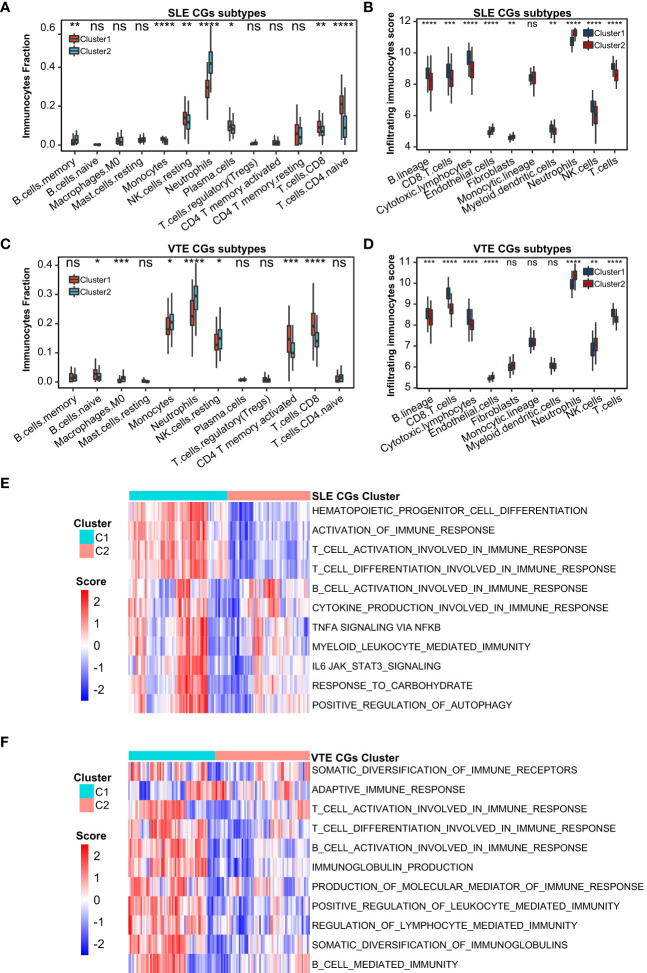
Result: A total of 171 CGs were obtained by the intersection of differentially expressed genes (DEGs) between SLE and VTE cohorts. The functional enrichment shown these CGs were mainly related to immune pathways. After screening by lasso regression, we found that three hub CGs (RSAD2, HSP90AB1, and FPR2) were the optimal shared diagnostic biomarkers for SLE and VTE. Based on the expression level of RSAD2 and HSP90AB1, two risk prediction models for SLE and VTE were built by multifactor logistic regression and systemically validated in internal and external validation datasets. The immune infiltration results revealed that CGs were highly correlated with multiple infiltrated immunocytes. Consensus clustering was used to respectively regroup SLE and VTE patients into C1 and C2 clusters based on the CGs expression profile. The levels of immune cell infiltration and immune activation were higher in C1 than in C2 subtypes.
Conclusion: In our study, we further screen out diagnostic biomarkers from crosstalk genes SLE and VTE and built two risk scores. Our findings reveal a close relationship between CGs and the immune microenvironment of diseases. This provides clues for further exploring the common mechanism and interaction between the two diseases.
Keywords: bioinformatics analysis; immune cells infiltration; systemic lupus erythematosus; transcriptomics; unsupervised clustering; venous thromboembolism.
Copyright © 2023 Yu, Yang, He, Zhang and Xu.
Conflict of interest statement
The authors declare that the research was conducted in the absence of any commercial or financial relationships that could be construed as a potential conflict of interest.
Figures
Similar articles
-
Exploring the transcriptomic landscape of moyamoya disease and systemic lupus erythematosus: insights into crosstalk genes and immune relationships.Front Immunol. 2024 Sep 3;15:1456392. doi: 10.3389/fimmu.2024.1456392. eCollection 2024. Front Immunol. 2024. PMID: 39290707 Free PMC article.
-
The shared circulating diagnostic biomarkers and molecular mechanisms of systemic lupus erythematosus and inflammatory bowel disease.Front Immunol. 2024 May 7;15:1354348. doi: 10.3389/fimmu.2024.1354348. eCollection 2024. Front Immunol. 2024. PMID: 38774864 Free PMC article.
-
Identification of crosstalk genes and immune characteristics between Alzheimer's disease and atherosclerosis.Front Immunol. 2024 Aug 12;15:1443464. doi: 10.3389/fimmu.2024.1443464. eCollection 2024. Front Immunol. 2024. PMID: 39188714 Free PMC article.
-
Identification of key biomarkers and immune infiltration in systemic lupus erythematosus by integrated bioinformatics analysis.J Transl Med. 2021 Jan 19;19(1):35. doi: 10.1186/s12967-020-02698-x. J Transl Med. 2021. PMID: 33468161 Free PMC article.
-
Systematic Literature Review and Meta-analysis of Venous Thromboembolism Events in Systemic Lupus Erythematosus.Rheumatol Ther. 2023 Feb;10(1):7-34. doi: 10.1007/s40744-022-00513-1. Epub 2022 Dec 6. Rheumatol Ther. 2023. PMID: 36471199 Free PMC article. Review.
Cited by
-
Machine learning and weighted gene co-expression network analysis identify a three-gene signature to diagnose rheumatoid arthritis.Front Immunol. 2024 Apr 22;15:1387311. doi: 10.3389/fimmu.2024.1387311. eCollection 2024. Front Immunol. 2024. PMID: 38711508 Free PMC article.
-
Unveiling shared biomarkers and therapeutic targets between systemic lupus erythematosus and heart failure through bioinformatics analysis.Front Med (Lausanne). 2024 Jun 7;11:1402010. doi: 10.3389/fmed.2024.1402010. eCollection 2024. Front Med (Lausanne). 2024. PMID: 38912340 Free PMC article.
-
Causal relationship between systemic lupus erythematosus and primary liver cirrhosis based on two-sample bidirectional Mendelian randomization and transcriptome overlap analysis.Arthritis Res Ther. 2024 Jan 2;26(1):10. doi: 10.1186/s13075-023-03235-z. Arthritis Res Ther. 2024. PMID: 38167341 Free PMC article.
References
-
- Brouwer JL, Bijl M, Veeger NJ, Kluin-Nelemans HC, van der Meer J. The contribution of inherited and acquired thrombophilic defects, alone or combined with antiphospholipid antibodies, to venous and arterial thromboembolism in patients with systemic lupus erythematosus. Blood (2004) 104(1):143–8. doi: 10.1182/blood-2003-11-4085 - DOI - PubMed
-
- Chang ER, Pineau CA, Bernatsky S, Neville C, Clarke AE, Fortin PR. Risk for incident arterial or venous vascular events varies over the course of systemic lupus erythematosus. J Rheumatol (2006) 33(9):1780–4. - PubMed
MeSH terms
Substances
LinkOut - more resources
Full Text Sources
Medical
Miscellaneous