

Mapping the two distinct proliferative bursts early in T-cell development
- PMID: 37465975
- PMCID: PMC10952215
- DOI: 10.1111/imcb.12670
Mapping the two distinct proliferative bursts early in T-cell development
Abstract
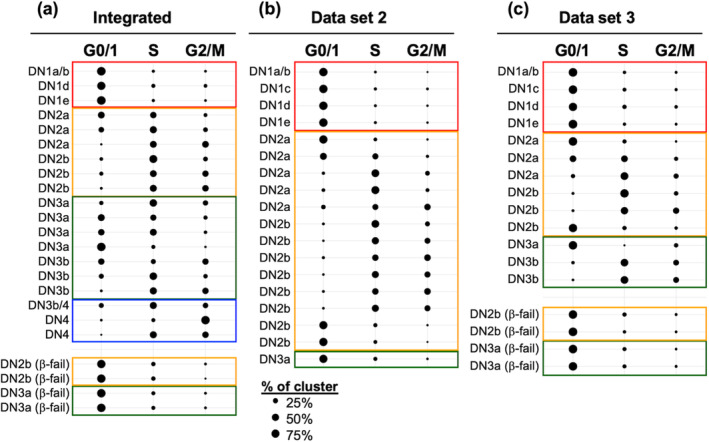
T-cell development occurs in the thymus and is tightly regulated to produce a diverse enough repertoire of mature T cells that can recognize any potential pathogen. The development of T cells is dependent on small numbers of uncommitted precursors that continually seed the thymus from the bone marrow. As they progress along the developmental pathway, there is a massive expansion in cell number to generate the necessary diversity in T-cell receptor chain usage. It is recognized that there are two proliferative bursts that occur early in T-cell development, one prior to β-selection and one after, and these are responsible for the expansion. While the proliferation following β-selection is well-characterized, the earlier proliferative burst has yet to be precisely defined. In this study, we employ single-cell RNA sequencing coupled to trajectory inference methods to pinpoint when in T-cell development thymocytes are induced into cell cycle. We show that the first proliferative burst is initiated in the double-negative (DN) 2a stage before T lineage commitment occurs, with cell cycling downregulated by the DN3a stage. A second burst is then initiated at the DN3b stage, immediately after β-selection. We subsequently employ fluorescence-activated cell sorting-based analysis for DNA content to confirm these two proliferative bursts.
Keywords: Cell cycle; T-cell development; proliferation; single-cell RNA sequencing.
© 2023 The Authors. Immunology & Cell Biology published by John Wiley & Sons Australia, Ltd on behalf of the Australian and New Zealand Society for Immunology, Inc.
Conflict of interest statement
The authors declare no conflicts of interest.
Figures


Similar articles
-
Fc gamma RII/III and CD2 expression mark distinct subpopulations of immature CD4-CD8- murine thymocytes: in vivo developmental kinetics and T cell receptor beta chain rearrangement status.J Exp Med. 1993 Apr 1;177(4):1079-92. doi: 10.1084/jem.177.4.1079. J Exp Med. 1993. PMID: 8096236 Free PMC article.
-
Clonal deletion of self-reactive T cells at the early stage of T cell development in thymus of radiation bone marrow chimeras.J Immunol. 1990 Jul 1;145(1):46-51. J Immunol. 1990. PMID: 2141619
-
Lunatic fringe enhances competition for delta-like Notch ligands but does not overcome defective pre-TCR signaling during thymocyte beta-selection in vivo.J Immunol. 2010 Oct 15;185(8):4609-17. doi: 10.4049/jimmunol.1002008. Epub 2010 Sep 15. J Immunol. 2010. PMID: 20844195 Free PMC article.
-
New insights into TCR β-selection.Trends Immunol. 2021 Aug;42(8):735-750. doi: 10.1016/j.it.2021.06.005. Epub 2021 Jul 12. Trends Immunol. 2021. PMID: 34261578 Review.
-
The development of functionally responsive T cells.Adv Immunol. 1992;51:85-214. doi: 10.1016/s0065-2776(08)60487-3. Adv Immunol. 1992. PMID: 1386962 Review.
Cited by
-
GUIDING CLUSTERING AND ANNOTATION IN SINGLE-CELL RNA SEQUENCING USING THE AVERAGE OVERLAP METRIC.bioRxiv [Preprint]. 2025 May 10:2025.05.06.652497. doi: 10.1101/2025.05.06.652497. bioRxiv. 2025. PMID: 40654835 Free PMC article. Preprint.
References
-
- Godfrey DI, Kennedy J, Suda T, Zlotnik A. A developmental pathway involving four phenotypically and functionally distinct subsets of CD3‐CD4‐CD8‐ triple‐negative adult mouse thymocytes defined by CD44 and CD25 expression. J Immunol 1993; 150: 4244–4252. - PubMed
-
- Ciofani M, Knowles GC, Wiest DL, von Boehmer H, Zúñiga‐Pflücker JC. Stage‐specific and differential notch dependency at the ⍺β and γδ T lineage bifurcation. Immunity 2006; 25: 105–116. - PubMed
Publication types
MeSH terms
Substances
LinkOut - more resources
Full Text Sources
Molecular Biology Databases
Research Materials
