. 2023 Aug 17;11(4):e0142123.
doi: 10.1128/spectrum.01421-23. Epub 2023 Jul 19.

Several Alphaherpesviruses Interact Similarly with the NF-κB Pathway and Suppress NF-κB-Dependent Gene Expression

Affiliations

Several Alphaherpesviruses Interact Similarly with the NF-κB Pathway and Suppress NF-κB-Dependent Gene Expression

Nicolás Romero et al. Microbiol Spectr. .

Abstract

Alphaherpesvirus infection is associated with attenuation of different aspects of the host innate immune response that is elicited to confine primary infections at the mucosal epithelia. Here, we report that infection of epithelial cells with several alphaherpesviruses of different species, including herpes simplex virus 1 and 2 (HSV-1 and HSV-2), feline alphaherpesvirus 1 (FHV-1), and bovine alphaherpesvirus 1 (BoHV-1) results in the inactivation of the responses driven by the nuclear factor kappa B (NF-κB) pathway, considered a pillar of the innate immune response. The mode to interact with and circumvent NF-κB-driven responses in infected epithelial cells is seemingly conserved in human, feline, and porcine alphaherpesviruses, consisting of a persistent activation of the NF-κB cascade but a potent repression of NF-κB-dependent transcription activity, which relies on replication of viral genomes. However, BoHV-1 apparently deviates from the other investigated members of the taxon in this respect, as BoHV-1-infected epithelial cells do not display the persistent NF-κB activation observed for the other alphaherpesviruses. In conclusion, this study suggests that inhibition of NF-κB transcription activity is a strategy used by several alphaherpesviruses to prevent NF-κB-driven responses in infected epithelial cells. IMPORTANCE The current study provides a side-by-side comparison of the interaction of different alphaherpesviruses with NF-κB, a key and central player in the (proinflammatory) innate host response, in infected nontransformed epithelial cell lines. We report that all studied viruses prevent expression of the hallmark NF-κB-dependent gene IκB, often but not always via similar strategies, pointing to suppression of NF-κB-dependent host gene expression in infected epithelial cells as a common and therefore likely important aspect of alphaherpesviruses.

Keywords: NF-κB; alphaherpesvirus; bovine alphaherpesvirus 1; epithelial cells; feline alphaherpesvirus 1; herpes simplex virus; pseudorabies virus.


Conflict of interest statement

The authors declare no conflict of interest.

Figures
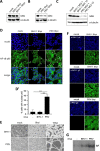
FIG 1
FIG 1
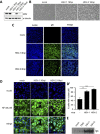
Interaction of BoHV-1 with the NF-κB pathway in bovine kidney epithelial cells. (A to C) Western blot analysis of the IκBα protein in BoHV-1-infected (A) and PRV-infected (B) MDBK cells at 8 and 16 hpi (MOI of 10 PFU/cell) or in BoHV-1- or PRV-infected MDBK cells at 8 hpi using an MOI of either 1 PFU/cell or 10 PFU/cell (C). (D and D′) Immunofluorescence detection of the NF-κB p65 subunit in BoHV-1- and PRV-infected MDBK cells at 8 hpi (MOI of 10 PFU/cell). NF-κB p65 is represented in green, and cell nuclei are shown in blue. Arrowheads indicate cells with nuclear p65. The graph in panel D′ shows the mean and standard deviation of three independent replicates. Asterisks indicate statistically significant differences (***, P < 0.001). (E) Light microscopy images showing the cytopathic effect caused by BoHV-1 and PRV infection in MDBK cell monolayers at 8 and 16 hpi (MOI of 10 PFU/cell). (F) Immunofluorescence of viral glycoproteins in MDBK cells infected with BoHV-1 (gC and gD) and PRV (gD) at 8 hpi (MOI of 10 PFU/cell). Viral glycoproteins are shown in green, and the cell nuclei is shown in blue. All assays were independently repeated three times. (G) NF-κB EMSA assessing the in vitro interaction of NF-κB transcription factors with κB sequences using mock-infected MDBK cells, BoHV-1-infected MDBK cells at 16 hpi (MOI of 10 PFU/cell), or PRV-infected MDBK cells at 16 hpi (MOI of 10 PFU/cell). BoHV-1 is indicated as BHV-1 in the figure to save space.
FIG 2
FIG 2
Interaction of FHV-1 with the NF-κB pathway in feline kidney epithelial cells. (A) Western blot analysis of IκBα protein degradation in FHV-1-infected CRFK cells at 8 and 16 hpi (MOI of 10 PFU/cell). (B) Light microscopy images indicating the cytopathic effect caused by FHV-1 in CRFK cell monolayers at 8 and 16 hpi (MOI of 10 PFU/cell). (C) Immunofluorescence images of mock-infected and FHV-1-infected CRFK cells at 8 hpi (MOI of 10 PFU/cell). Viral gB protein is shown in green, and cell nuclei are shown in blue. (D and D′) Immunofluorescence detection of the NF-κB p65 subunit in FHV-1-infected CRFK cells at 8 hpi (MOI of 10 PFU/cell). NF-κB p65 is shown in green, and cell nuclei are shown in blue. Arrowheads indicate cells with nuclear p65. The graphs in panel D′ shows the mean and standard deviation of three independent replicates. Asterisks indicate statistically significant differences (**, P < 0.01). (E) NF-κB EMSA assessing the in vitro interaction of NF-κB transcription factors with κB sequences using mock-infected CRFK cells, FHV-1-infected CRFK cells at 16 hpi (MOI of 10 PFU/cell), or PMA-treated CRFK cells (1 h, 20 ng/mL). (F) RT-qPCR-based IκBα mRNA levels in FHV-1-infected CRFK cells at 16 hpi (MOI of 10 PFU/cell) or treated with PMA for 1 h or 2 h (20 ng/mL). The graph indicates the mean and standard deviation of the relative fold change in IκBα mRNA abundance in comparison with mock-infected CRFK cells based on three independent repeats of the experiment (transcript levels were normalized to 18S rRNA levels). (G) qPCR-based intracellular viral DNA loads in FHV-1-infected CRFK cells at 2 and 16 hpi (MOI of 10 PFU/cell) in the absence or presence of 400 μg/mL PAA. The graph illustrates the mean and standard deviation (in log10 units) of the fold difference in FHV-1 genome levels compared to PAA-treated FHV-1-infected CRFK cells at 2 hpi based on three independent repeats of the assay (data were normalized to cellular genome copies based on the feline β-2-microglobulin [B2M] gene). Values were relative to PAA-treated PRV-infected cells at 2 hpi. (H) RT-qPCR-based assessment of IκBα transcripts in CRFK cells treated or not with PAA (400 μg/mL), either infected or not with FHV-1, and harvested at 16 hpi (MOI of 10 PFU/cell). Treatment of CRFK cells with PMA for 1 h (20 ng/mL) was used as a positive control to trigger IκBα transcription. The graph indicates the mean and standard deviation of the fold change in IκBα mRNA loads with respect to mock-infected CRFK cells based on three independent repeats of the experiment (transcript levels were normalized to 18S rRNA levels). (I) Western blot analysis of the IκBα in mock- and FHV-1-infected CRFK cells in the presence or absence of PAA (400 μg/mL) at 16 hpi (MOI of 10 PFU/cell). PAA was added to CRFK cells 30 min before virus inoculation and kept throughout infection. All assays were independently repeated three times.
FIG 3
FIG 3
HSV-1 and HSV-2 trigger NF-κB activation in Vero epithelial cells. (A) Western blot analysis of IκBα protein degradation in Vero cells infected with HSV-1 and HSV-2 at 8 and 16 hpi (MOI of 10 PFU/cell). (B) Light microscopy images of HSV-1- and HSV-2-infected Vero cells at 16 hpi (MOI of 10 PFU/cell). (C) Immunofluorescence images of mock-infected and HSV-1- or HSV-2-infected Vero cells at 8 hpi (MOI of 10 PFU/cell). Viral gB protein is shown in green, and cell nuclei are shown in blue. (D and D′) Immunofluorescence analyses of NF-κB p65 localization in Vero cells infected with HSV-1 and HSV-2 at 16 hpi (MOI of 10 PFU/cell). Arrowheads indicate cells with nuclear p65. The graph in D′ shows the mean and standard deviation of three independent replicates. Asterisks indicate statistically significant differences (**, P < 0.01; ***, P < 0.001). (E) NF-κB EMSA assessing the in vitro interaction of NF-κB transcription factors with κB sequences using mock-infected Vero cells, HSV-1- or HSV-2-infected Vero cells at 16 hpi (MOI of 10 PFU/cell), or PMA-treated Vero cells (1 h, 20 ng/mL).
FIG 4
FIG 4
HSV-1- and HSV-2-induced NF-κB activation in Vero epithelial cells does not lead to NF-κB-dependent host gene expression. (A) RT-qPCR-based evaluation of IκBα mRNA levels in Vero cells at 16 hpi with HSV-1 or HSV-2 (MOI of 10 PFU/cell) or exposed to PMA for 1 or 2 h (20 ng/mL). The graph represents the mean and standard deviation of the relative fold change compared to the mock condition out of three independent repeats (transcript levels were normalized to 18S rRNA). (B) qPCR-based analysis of HSV-1 and HSV-2 genome replication in the presence or absence of the viral DNA polymerase inhibitor PAA (400 μg/mL) at 2 hpi and 16 hpi (MOI of 10 PFU/cell). Vero cells were pretreated with PAA for 30 min before virus inoculation, and the inhibitor was kept throughout the infection. The graph shows the mean and standard deviation (in log10 units, based on three independent repeats) of the relative fold change in viral DNA copies compared to the genome copies found in PAA-treated HSV-1- and HSV-2-infected Vero cells at 2 hpi (data were normalized to the host genome using the β-2-microglobulin (B2M) gene). Values were relative to PAA-treated PRV-infected cells at 2 hpi. (C) RT-qPCR-based quantitation of mRNA loads of the hallmark NF-κB-dependent IκBα, A20, TNF-α, and IL-6 genes in HSV-1- and HSV-2-infected Vero cells at 16 hpi (MOI of 10 PFU/cell), either or not treated with PAA (400 μg/mL, starting 30 min prior to inoculation and kept during infection). PMA treatment (1 h, 20 ng/mL) served as a positive control. The graphs show the means and standard deviations (three independent repeats) of the relative fold differences in mRNA levels versus the mock condition (transcript levels were normalized to 18S rRNA). Different colors differentiate the values obtained in each of the repeats of the experiment. Asterisks indicate statistically significant differences (*, P < 0.05) (D) Western blot analysis of the IκBα protein in HSV-1- and HSV-2-infected Vero cells at 16 hpi (MOI of 10 PFU/cell), treated or not with PAA (400 μg/mL). Vero cell monolayers were pretreated with PAA 30 min prior to infection, and PAA was maintained in the culture medium throughout the infection. All assays were independently repeated three times.

Similar articles

Cited by

References

    1. Davison AJ. 2002. Evolution of the herpesviruses. Vet Microbiol 86:69–88. doi: 10.1016/s0378-1135(01)00492-8. - DOI - PubMed
    1. McGeoch DJ, Cook S, Dolan A, Jamieson FE, Telford EA. 1995. Molecular phylogeny and evolutionary timescale for the family of mammalian herpesviruses. J Mol Biol 247:443–458. doi: 10.1006/jmbi.1995.0152. - DOI - PubMed
    1. McGeoch DJ, Cook S. 1994. Molecular phylogeny of the alphaherpesvirinae subfamily and a proposed evolutionary timescale. J Mol Biol 238:9–22. doi: 10.1006/jmbi.1994.1264. - DOI - PubMed
    1. Paludan SR, Bowie AG, Horan KA, Fitzgerald KA. 2011. Recognition of herpesviruses by the innate immune system. Nat Rev Immunol 11:143–154. doi: 10.1038/nri2937. - DOI - PMC - PubMed
    1. Lum KK, Cristea IM. 2021. Host innate immune response and viral immune evasion during alphaherpesvirus infection. Curr Issues Mol Biol 42:635–686. doi: 10.21775/cimb.042.635. - DOI - PMC - PubMed

LinkOut - more resources