Review
. 2023 Jul 19;14(1):128.
doi: 10.1186/s13244-023-01462-1.

Understanding a mass in the paraspinal region: an anatomical approach

Affiliations
Review

Understanding a mass in the paraspinal region: an anatomical approach

Maud Creze et al. Insights Imaging. .

Abstract

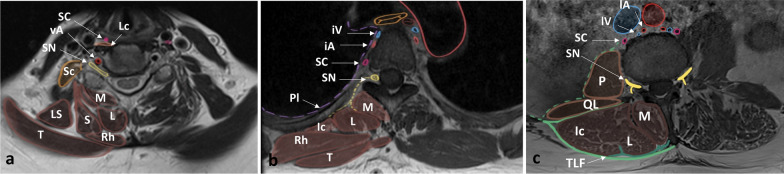
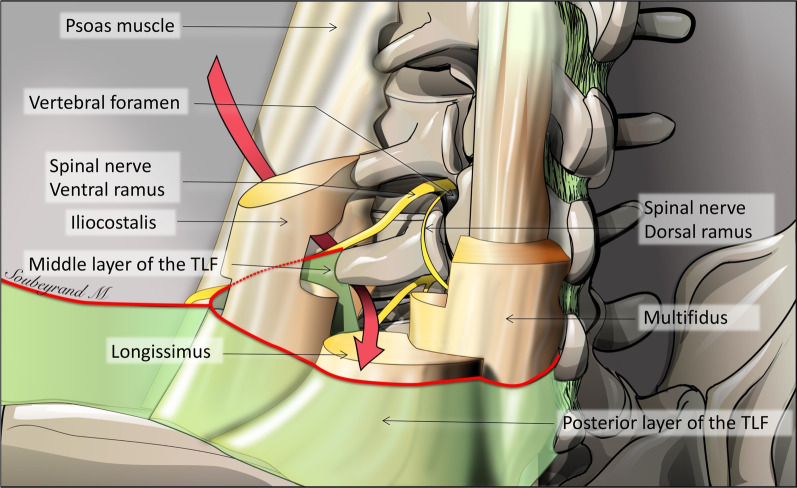
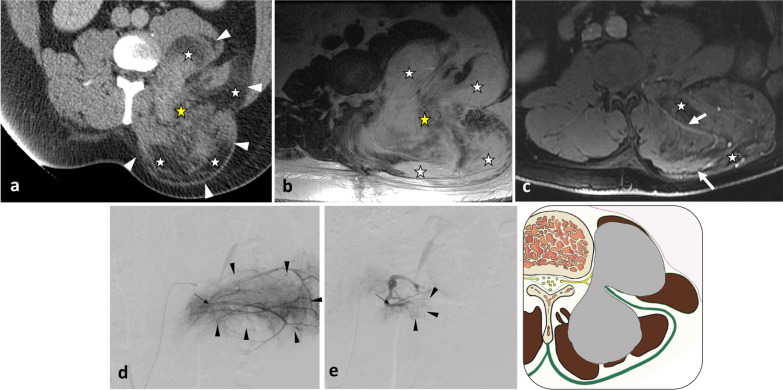
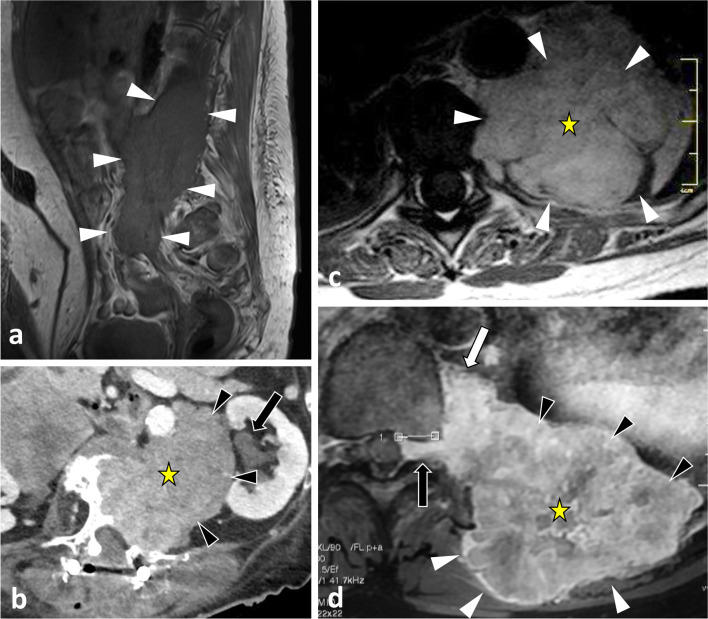
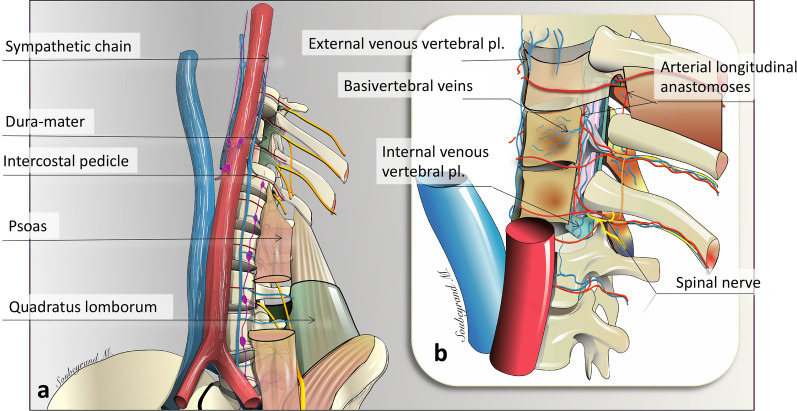
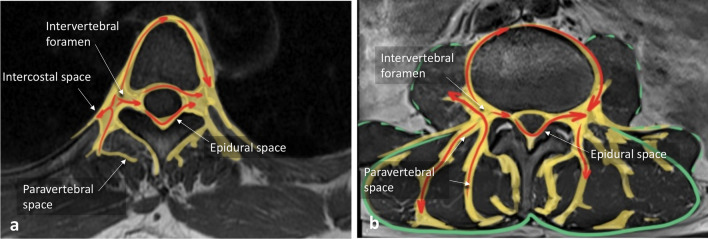
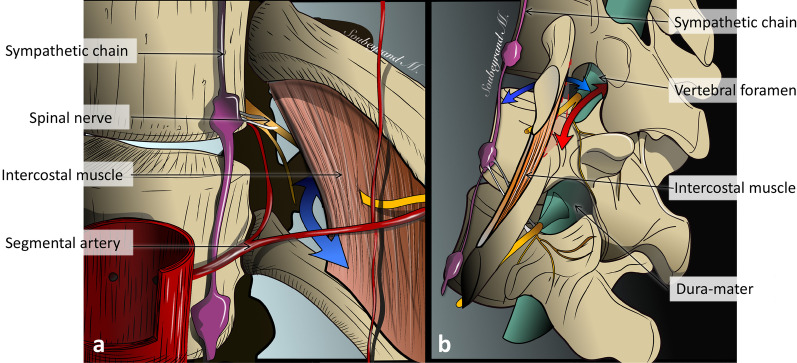
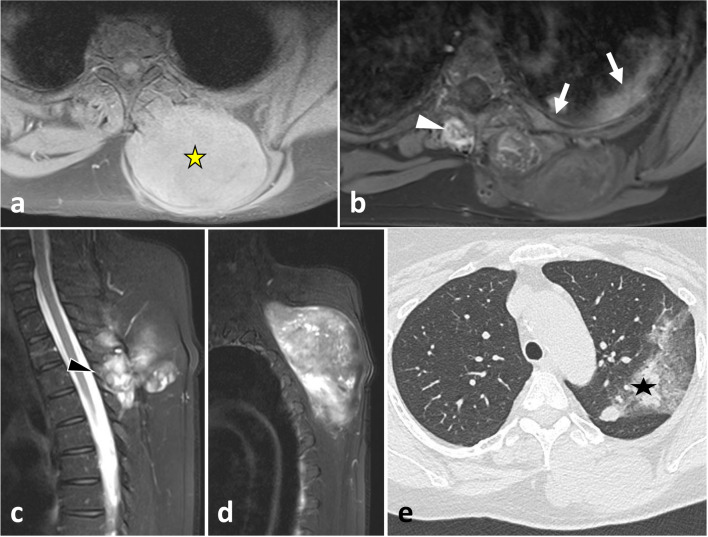
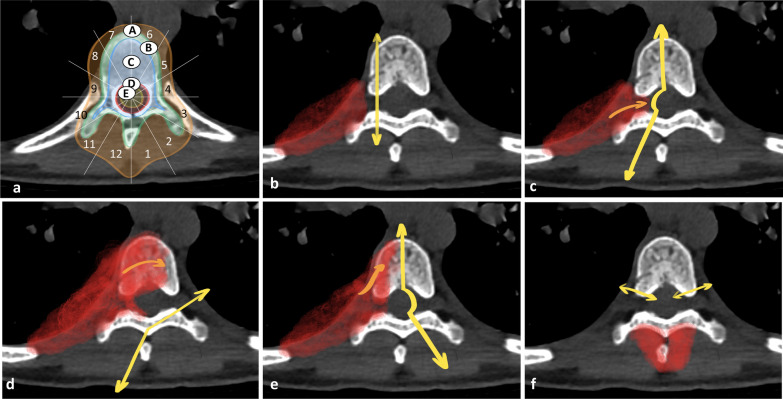
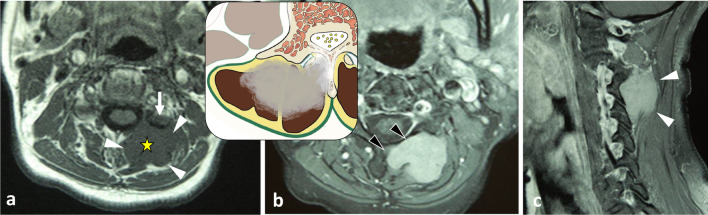
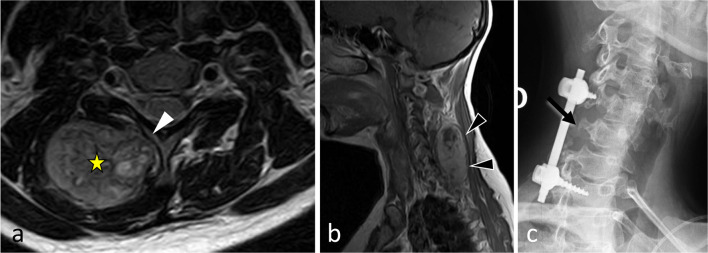
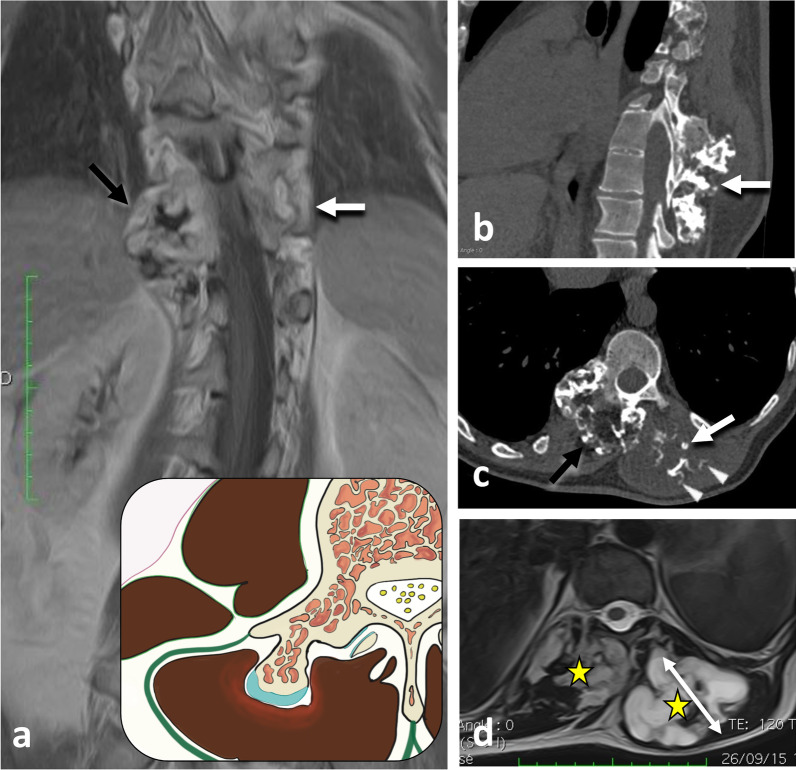
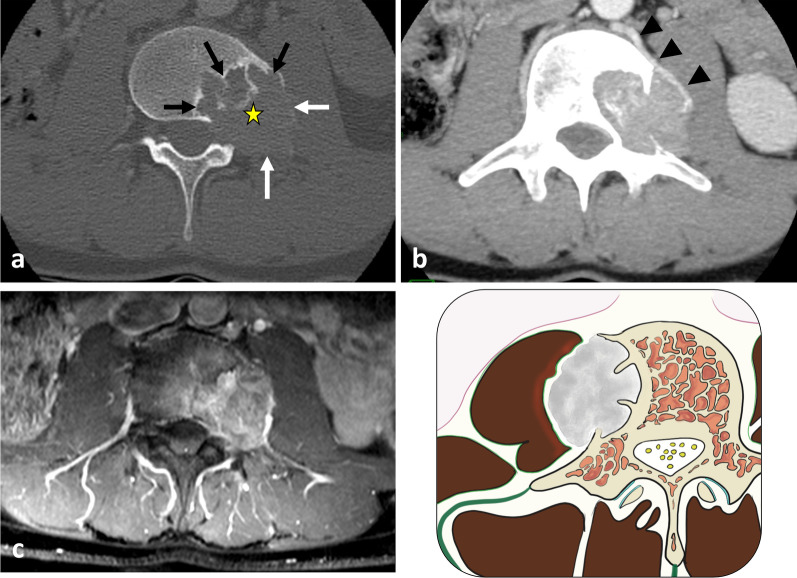
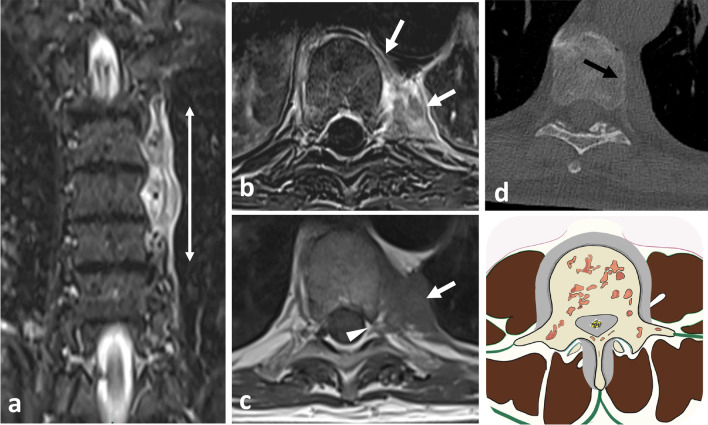
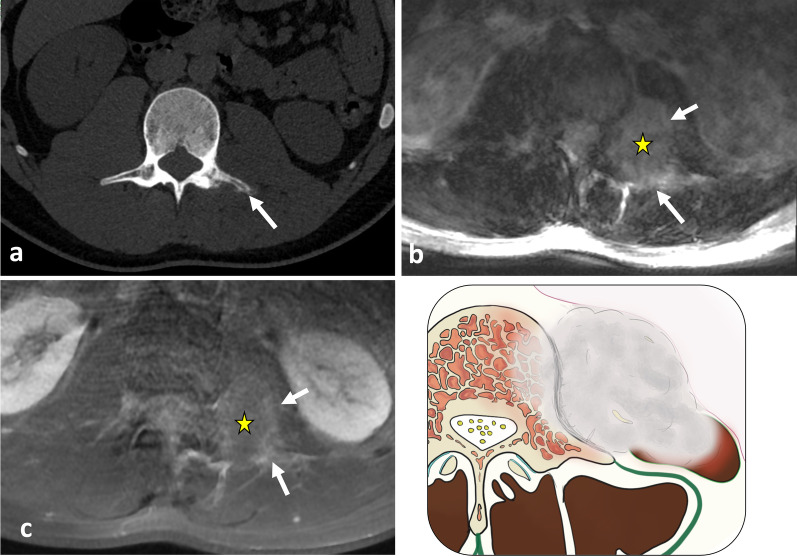
The paraspinal region encompasses all tissues around the spine. The regional anatomy is complex and includes the paraspinal muscles, spinal nerves, sympathetic chains, Batson's venous plexus and a rich arterial network. A wide variety of pathologies can occur in the paraspinal region, originating either from paraspinal soft tissues or the vertebral column. The most common paraspinal benign neoplasms include lipomas, fibroblastic tumours and benign peripheral nerve sheath tumours. Tumour-like masses such as haematomas, extramedullary haematopoiesis or abscesses should be considered in patients with suggestive medical histories. Malignant neoplasms are less frequent than benign processes and include liposarcomas and undifferentiated sarcomas. Secondary and primary spinal tumours may present as midline expansile soft tissue masses invading the adjacent paraspinal region. Knowledge of the anatomy of the paraspinal region is of major importance since it allows understanding of the complex locoregional tumour spread that can occur via many adipose corridors, haematogenous pathways and direct contact. Paraspinal tumours can extend into other anatomical regions, such as the retroperitoneum, pleura, posterior mediastinum, intercostal space or extradural neural axis compartment. Imaging plays a crucial role in formulating a hypothesis regarding the aetiology of the mass and tumour staging, which informs preoperative planning. Understanding the complex relationship between the different elements and the imaging features of common paraspinal masses is fundamental to achieving a correct diagnosis and adequate patient management. This review gives an overview of the anatomy of the paraspinal region and describes imaging features of the main tumours and tumour-like lesions that occur in the region.

Keywords: Anatomy; Imaging; Paraspinal muscle; Soft tissue neoplasm; Spinal neoplasm.


Conflict of interest statement

The authors declare that they have no competing interest.

Figures

Fig. 1
Fig. 1
Anatomy of the paraspinal region at C6 level (a), at T4 level (b) and at L3 level (c) on axial T1WI. T, trapezius; S, splenius; Rh, rhomboid; iA, intercostal artery; Iv, intercostal vein; M, multifidus; L, longissimus; Ic, iliocostalis; Sc, sympathetic chain; LS, levator scapulae; Sc, scalenus; vA, vertebral artery; Pl, pleura; SN, spinal nerve; P, psoas; QL, quadratus lumborum; TLF, thoracolumbar fascia; and Lc, longus colli
Fig. 2
Fig. 2
Posterior view of the lumbar paraspinal region. TLF: thoracolumbar fascia. The red arrow shows the communication between epaxial and hypaxial regions
Fig. 3
Fig. 3
Liposarcoma of the left lumbar paraspinal muscles in a 57-year-old male with a bump in the back and mild left iliac fossa pain. Contrast-enhanced axial CT scan reconstruction (a) and axial T1WI (b) show intramuscular lipomatous tumour invading both the hypaxial and epaxial muscles. Fat content (white stars) presents low attenuation on CT, high signal on T1WI and saturates on fat-saturated T1WI (c). The mass demonstrates a bilobed shape with an epicentre located between the epaxial and hypaxial regions (yellow stars). Axial contrast-enhanced fat-saturated T1WI (c) shows muscle and fascia enhancement (arrows), a key driving feature for liposarcoma. Digital subtraction angiogram (d) of the left 2nd lumbar artery (arrow) shows hypervascularisation of the tumour (arrowheads). After embolisation (e), hypervascularisation decreased (arrowheads)
Fig. 4
Fig. 4
Longitudinal and transversal extension of three distinct paraspinal tumours. Spinal and paraspinal metastasis of urothelial carcinoma of the left upper tract in an 83-year-old female (a, b). Sagittal T1WI a shows the longitudinal extension of the tumour within the left psoas muscle from L2 to S1 level. Contrast-enhanced axial CT scan reconstruction (b) demonstrates the transversal extension of the mass within the retroperitoneum (arrowheads), causing ureteral stenosis (black arrow). Undifferentiated sarcoma of soft tissue in a 37-year-old female (c). Contrast-enhanced axial T1WI (c) shows pleural extension (arrowhead). Costal Ewing’s sarcoma in a 23-year-old male (d). Contrast-enhanced axial T1WI (d) shows an extension in epaxial muscles (white arrowheads), a pleural and intercostal extension (black arrowheads), a posterior mediastinum extension (white arrow) and an epidural extension via the intervertebral foramen (black arrow). Yellow stars show the epicentre of masses
Fig. 5
Fig. 5
Major nerves, veins and arteries of the paraspinal region. a Anterior view of the thoracolumbar paraspinal region. b Enlarged view showing the Batson’s venous plexus and the origin and anastomosis of paraspinal arteries. Pl: plexus
Fig. 6
Fig. 6
Angiography of intercostal and lumbar arteries performed before surgical excision of a neurofibroma at left T8-T9 level (a, b). The great radicular artery (Adamkiewicz) was originated from the distal part of the right 2nd lumbar arteries (a). Selective left intercostal angiogram shows a radiculomedullary artery originating from the left 5th intercostal artery (b)
Fig. 7
Fig. 7
Leiomyosarcoma of left paraspinal muscles in a 65-year-old male with back pain and genitourinary issues. Contrast-enhanced axial CT scan reconstruction (a) demonstrates aggressive features with moth-eaten lysis of the vertebra and iliac bone (white arrows). The mass extends transversally in both epaxial and in hypaxial muscles (be, white arrowheads), and longitudinally along L2 to S1 (c). The mass has heterogeneous high signal intensity on axial (b) and sagittal (c) T2WI, low intensity signal on axial T1WI, and heterogeneous enhancement on contrast-enhanced fat saturation T1WI (white arrowheads) (e). Digital subtraction angiogram (f) of the left 3nd lumbar artery (arrow) shows hypervascularisation of the tumour (white arrowheads). The yellow star shows the epicentre of the mass
Fig. 8
Fig. 8
Anatomy of the paraspinal space on axial T1WI. Red arrows show the possible pathways involved in paraspinal tumours spreading
Fig. 9
Fig. 9
Anatomy of the paraspinal space. Anterior view of thoracic paraspinal region (a) Lateral view of the paraspinal region (b). The paraspinal region communicates with the intercostal space (blue arrow) and the epidural space (red arrow)
Fig. 10
Fig. 10
Origin and extent of the paraspinal tumours. Myoepithelial soft tissue tumour of paraspinal muscles in a 52-year-old male (with acute thoracic back pain) that secondary invades the 3rd thoracic vertebra and the 2nd, the 3rd and the 4th ribs (a, b, c). Sagittal T2WI (a) and axial T1WI with contrast agent (b) show a paraspinal tumour with an epicentre in epaxial muscles (star). Arrows show tumour’s spread towards the opposite side (A), into the bone (D), into the epidural space (C) via the intervertebral foramen (B), in the pleura (F) via the intercostal space (F). Postoperative anteroposterior radiograph shows a lysis of the 3rd and 4th vertebras (white arrowheads). The ribs were removed. Chondrosarcoma of the pedicle-transverse part of L3, that secondary invades the hypaxial and epaxial muscles, in a 62-year-old male (d, e). Axial CT reconstruction (d) and axial T2WI (e) show a mass with a cartilage matrix including calcifications (white arrows, (d)) and high T2WI intensity (e). The mass presents aggressive bone lysis (arrowheads) surrounded by inflammation (red dashed line). Posteroanterior radiograph of the surgical sample of vertebrectomy and pelvic resection (f) shows a shadow and calcification (arrows) and lysis of the vertebral body and transverse process of L3 (arrowhead)
Fig. 11
Fig. 11
Cold abscesses in a 37-year-old male with mild thoracic pain, weight loss and fatigue for 1 month. Axial (a) and sagittal (d) T1WI with contrast agent show large left paraspinal abscesses, which extend in both hypaxial and epaxial (superficial and deep) regions. Abscesses extend along the vertebral body to the contralateral side (white arrowheads) and into the left vertebral foramen (black arrowhead). Axial CT scan reconstruction (c) and anteroposterior radiograph (e) show septic arthritis of the costovertebral joint and spondylitis (white arrows). Anteroposterior radiograph shows the left hypaxial mass along the left side of the side (black arrows). As the lesion was superficial, US was used for percutaneous guided biopsy (b). US shows a hypoechoic mass with posterior acoustic enhancement
Fig. 12
Fig. 12
Spinal osteoblastoma of the C6 in a 36-year-old male with intense cervical pain, worse at night, and decreased range of motion. Anteroposterior radiograph of the cervical spine (a) shows a mixed lesion of the right transverse process of C6 (white arrows). Axial CT reconstruction (b) scan shows a lytic lesion with an internal calcification (black arrow) and a rim of sclerosis (black arrowhead). Gadolinium-enhanced fat-suppressed axial T1WI (c) shows heterogeneous enhancement of the mass with associated enhancement of the surrounding paraspinal soft tissues termed ‘the flare phenomenon’ (white arrowheads). The mass invades the epidural space (black arrowhead)
Fig. 13
Fig. 13
Spinal osteosarcoma in a 23-year-old male with back pain and progressive weakness of both lower limbs. Contrast-enhanced axial CT scan reconstruction (a) shows corporeal-pedicle bone formation of L1. The presence of a fat plane between the tumour and the epaxial muscles (arrowhead) suggests that the mass turn away the epaxial muscles rather that invades them. The mass has non-specific imaging features on MRI: mild hyperintense on axial T2WI (b), hyposignal on sagittal T1WI (c), mild and heterogeneous enhancement on contrast-enhanced, fat-suppressed T1WI (d). The mass also invades epidural space (arrows). Anteroposterior radiography (e) performed after pedicle screw fixation showing bone formation in the left paraspinal region. Yellow star shows the epicentre of the mass
Fig. 14
Fig. 14
Intramuscular lipoma in the left erector spinae muscle in a 60-year-old male with soft, painless and non-inflammatory paraspinal tumefaction. MRI demonstrates the typical features of intramuscular lipoma: high intensity on T1WI (a), saturation on fat-saturated T1WI (b), high intensity onT2WI (c) and absence of enhancement on contrast-enhanced fat saturation T1WI (d). Streaky structures correspond to entrapped muscle fibres (arrows). US-guided biopsy (e, black arrowheads) shows a hyperechoic mass with thin transversal lines (white arrowheads). Pathological report demonstrates negative detection for MDM2 supporting classification as lipoma instead of atypical lipomatous tumour. The yellow star shows the epicentre of the mass
Fig. 15
Fig. 15
Haemangioma in a 37-year-old female presenting with mild paraspinal pain and soft and slow-growing tumefaction. Contrast-enhanced axial CT scan reconstruction (a), axial T2WI (b) and axial T1WI (d) show a bilobed mass in the erector spinae muscles, the psoas muscle and the quadratus lumborum muscle with phlebolite (white arrow) and fat content (black arrow). Contrast-enhanced axial T1WI with fat saturation (e) demonstrates heterogeneous enhancement (a). On US, the mass appears as an ill-defined hypoechoic mass with multiple spaces within (white arrows) (f). The yellow star shows the epicentre of the mass
Fig. 16
Fig. 16
Desmoid tumour that extends along the left erector spinae aponeurosis in a 39-year-old male with recent trauma and pain. T2WI demonstrates a circumscribed mass with high intensity (a). MRI performed 3 months later shows a fast-growing tumour (b, c, d). The desmoid tumour is hyperintense to muscle in T2WI (b) and T1WI (c) and enhances on contrast-enhanced T1WI (d). US performed in transversal (e) and longitudinal plane (f) shows a well-defined hypoechoic mass onto the erector spinae aponeurosis (arrowheads). The yellow star shows the epicentre of the mass
Fig. 17
Fig. 17
Neurofibroma of the 7th left spinal nerve in a 36-year-old female with thoracic radicular pain. Sagittal (a) and axial CT reconstruction (b) shows the widening of neural foramen (double arrows). Axial CT (b), axial T1WI with contrast (c) and axial T2WI (d) demonstrate the typical dumbbell configuration of nervous tumour with intraspinal (back arrowheads) and paraspinal components (black arrows) that communicate via the intravertebral foramen. The mass presents high signal intensity on T2WI (d), low signal intensity on T1WI (e) and homogeneous enhancement (d). The nervous mass extends into the multifidus muscle (white arrow) and the intercostal space (white arrowheads). The yellow star shows the epicentre of the mass
Fig. 18
Fig. 18
Schwannoma of a ventral branch of the right 2nd lumbar spinal nerve in a 32-year-old female with neuropathic pain of the right anterior medial thigh. Axial CT reconstruction (a) shows a hypodense mass within the psoas muscle (white arrowhead) with high signal on T2WI (b), low signal on T1WI (c) and heterogeneous contrast-enhanced fat saturation T1WI (d). The mass extends into the vertebral body forming a lytic lesion with sclerotic margin (black arrow). The yellow star shows the epicentre of the mass
Fig. 19
Fig. 19
Flowchart for paraspinal masses. Stars represent soft tissues tumours with bone involvement. BPMNST, benign peripheral nerve sheath tumours; MPNST, malignant peripheral nerve sheath tumours; ABC, aneurysmal bone cyst; CS, chondrosarcoma; GCT, giant cell tumours; PCT, plasma cells tumours; US, undifferentiated sarcoma; and SS, synovial sarcoma
Fig. 20
Fig. 20
Overview of the paraspinal masses. Stars represent most frequents lesions. Words in bold represent benign lesions. BPMNST, benign peripheral nerve sheath tumours; MPNST, malignant peripheral nerve sheath tumours; ABC, aneurysmal bone cyst; CS, chondrosarcoma; GCT, giant cell tumours; and PCT, plasma cells tumours
Fig. 21
Fig. 21
Undifferentiated sarcoma of left thoracic paraspinal soft tissues in a 42-year-old female with severe non-mechanical thoracic pain and palpable hard mass. Axial fat-suppressed T1WI (a) and gadolinium-enhanced T1WI (b) show a necrotic mass in bilateral hypaxial muscles. Sagittal STIR WI (c, d) shows paraspinal extension along five segmental levels. Sagittal T2WI shows bone inflammation of the spinous process (black arrowhead). Axial fat-suppressed T1WI and axial CT scan (e) demonstrate tumour’s spread towards the opposite side (white arrowhead), pleural extension (white arrows) and pulmonary extension (star). The yellow star shows the epicentre of the mass
Fig. 22
Fig. 22
Weinstein–Boriani–Biagini classification (a). A: paraspinal soft tissues; B: intraosseous (superficial); C: intraosseous (Deep); D: extraosseous (Extradural); E: extraosseous (Intradural). Fadel and Missenard classification of vertebral osteotomy (b, c, d, e). b: transversectomy; c: one-third vertebrectomy; d: two-third vertebrectomy; e: total vertebrectomy. En bloc resection of the posterior arch (f)
Fig. 23
Fig. 23
Leiomyoma in a 60-year-old male with non-mechanical cervical pain. MRI scan shows a lobulated mass in left epaxial muscles (white arrowheads) with low signal intensity on T1WI (a) and enhancement on axial (b) and sagittal (c) contrast-enhanced fat-saturated T1WI. Several features are suggestive of vertebral bone invasion: disappearance of the fat plane separating the mass and the neural arch associated with a low signal of medullary bone of the articular process on T1WI (white arrow), disappearance of cortical bone and enhancement of medullary bone (black arrowheads) on contrast-enhanced T1WI. The yellow star shows the epicentre of the mass
Fig. 24
Fig. 24
Mesenchymal chondrosarcoma of right hypaxial muscles in a 37-year-old female with chronic cervical pain and bump in the neck. MRI shows a lobulated mass with high signal on axial T2WI (a) and heterogeneous enhancement pattern after contrast injection (black arrowheads, b). White arrowhead demonstrates the disappearance of the fat plane separating the mass and the neural arch. The yellow star shows the epicentre of the mass. Cervical radiograph (oblique view) shows posterior cervical fixation following laminectomy (c)
Fig. 25
Fig. 25
Synovial sarcoma of deep epaxial muscles at C4 level in a 53-year-old male with a bump and acute non-mechanical cervical pain. The mass presents aggressive radiological features such as cortical and trabecular lysis of the neural arch of C4 (a) with moth-eaten margin. The mass has low intensity on T1WI (b), with enhancement on contrast-enhanced fat-suppressed T1WI (c) and high signal on T2WI (d). MRI features suggestive of bone invasion were: the disappearance of the fat plane separating the mass and the lamina (black arrow, c) the enhancement of medullary bone of the spinous process (white arrowhead, d) and the enhancement of periosteum of right lamina (black arrowhead, d). Lateral radiograph of the surgical sample (two-third vertebrectomy) (e) shows bone lysis of the tip of the vertebral processes (C4, C5 and C6) (white arrows). The yellow star shows the epicentre of the mass.
Fig. 26
Fig. 26
Muscle and bone metastasis from a lung cancer in a 70-year-old male with acute back pain. Contrast-enhanced axial CT scan reconstruction (a) and axial contrast-enhanced T1WI (b) show a spinal metastasis extending into the psoas muscle and the epaxial region (arrow) and an intramuscular metastasis (arrowhead). The yellow star shows the epicentre of the mass
Fig. 27
Fig. 27
Summary of clinical features and imaging patterns for expansive spinal tumours with focus on paraspinal muscle involvement. C, cervical spine; L, lumbar spine; T, thoracic spine; VB, vertebral body; and PLE, posterolateral elements
Fig. 28
Fig. 28
Aneurysmal bone cyst in a 27-year-old female with cervical pain and weakness of the right upper limb. Axial CT scan reconstruction (a) shows an expansile, lytic lesion within the right neural arch and the vertebral body of C6 (white arrows). The mass invades epaxial and hypaxial region (arrowheads). Axial T2WI (b) demonstrates fluid–fluid levels (black arrows). Sagittal T1WI (c) and contrast-enhanced T1WI (d) show cystic areas. The lesion involves two adjacent vertebral levels. The yellow star shows the epicentre of the mass
Fig. 29
Fig. 29
Exostosis and chondrosarcoma, respectively, on the right and on the left transverse processes of T10 in a 57-year-old male with hereditary multiple exostosis. The patient had been experiencing back pain for 2 months, a possible indicator of malignant degeneration of a chondroma into a chondrosarcoma. The patient presents with a right osseous outgrowth (black arrows), which has cortical and medullary continuity with the underlying bone as shown in coronal T1WI (a) and axial CT scan reconstruction (c). The cartilage cap of both exostosis and chondrosarcoma appears with intermediate signal on T1WI (a) and high signal on T2WI (d) and has ring and arc calcifications (arrowheads). The patient presents a left osseous outgrowth (white arrows), with rough cortex and cortical disruption (b, c) and with thick cartilage cap (3 cm, double arrow) on axial T2WI (d). Yellow stars show the epicentre of masses
Fig. 30
Fig. 30
Giant cell tumour with left corporeal-pedicle development in a 42-year-old female with low back pain of 4 months of duration (a, b, c). Axial CT scan reconstruction (a) shows a lytic lesion with a sclerotic rim (black arrow) at the border of the tumour opposite to the eccentric side. As shown on axial CT with contrast agent (b), the tumour typically splays rather than engulfs the psoas muscles (white arrows) and the lumbar artery (arrowheads). Axial gadolinium-enhanced T1WI (c) demonstrates homogeneous and moderate enhancement. Yellow star shows the epicentre of the mass
Fig. 31
Fig. 31
Non-Hodgkin lymphoma in a 72-year-old male with fatigue and mild thoracic pain at rest. Coronal STIR (a) shows left paraspinal infiltrative mass along three vertebral segments (double head arrow). Axial T1WI (b) and subtraction T1WI (c) shows an epaxial mass (white arrows), which extents on the ventral surface of the vertebral body and penetrates into the vertebral foramen (arrowhead). Both MRI and CT (d) demonstrate that the mass do not invades the vertebra (black arrow)
Fig. 32
Fig. 32
Ewing sarcoma of L4 in an 18-year-old male with extreme low back pain and acute cauda equina syndrome. Axial CT reconstruction (a) demonstrates a moth-eaten lytic lesion of the transverse process with large paraspinal soft tissue component, best seen on axial T2WI (b) and axial contrast-enhanced, fat-suppressed T1WI (c). Yellow star shows the epicentre of the mass. Lying position in MRI tube caused intense spinal pain, which explains motion of the patient and motion artefacts
Fig. 33
Fig. 33
Trauma conditions examples in in the paraspinal region. Right psoas haematoma in a 76-year-old female following a fall. Coronal CT scan reconstruction without (a) and with contrast agent (b) shows enlarged right psoas (arrowheads) with active extravasation of contrast (arrow). Muscle contusion of the right erector spinae muscle in a 27-year-old male after bicycle accident (c). Contrast-enhanced axial CT scan reconstruction (c) demonstrates enlarged erector spinae muscle (arrowheads) and subcutaneous emphysema (arrow). Yellow stars show epicentre of masses
Fig. 34
Fig. 34
Adiponecrosis in a 43-year-old male with low back pain 2 months after a fall. US (a) demonstrating a hyperechoic, superficial mass and power Doppler signal showing hypervascularity. Axial T2WI (b) and sagittal T1WI (c) showing a superficial mass (arrows) with heterogeneous iso- to hyperintense signal. Sagittal contrast-enhanced fat-suppressed T1WI (d) showing a heterogeneous enhancement
Fig. 35
Fig. 35
Extramedullary haematopoiesis in a 25-year-old male with sickle cell disease. Contrast-enhanced axial CT scan reconstruction in the bone window (a), axial T2WI (b) and axial contrast-enhanced T1WI (c) show well-defined, bilateral hypaxial masses (arrows). Sagittal T1WI demonstrates multiple hypaxial masses (arrows) (d). Axial CT scan reconstruction (a) shows widened ribs and osteosclerosis of the vertebra

References

    1. Macintosh JE, Valencia F, Bogduk N, Munro RR. The morphology of the human lumbar multifidus. Clin Biomech (Bristol, Avon) 1986;1:196–204. doi: 10.1016/0268-0033(86)90146-4. - DOI - PubMed
    1. Macintosh JE, Bogduk N. The attachments of the lumbar erector spinae. Spine (Phila Pa 1976) 1991;16:783–792. doi: 10.1097/00007632-199107000-00017. - DOI - PubMed
    1. Goubert D, De Pauw R, Meeus M, et al. Lumbar muscle structure and function in chronic versus recurrent low back pain: a cross-sectional study. Spine J. 2017;17:1285–1296. doi: 10.1016/j.spinee.2017.04.025. - DOI - PubMed
    1. Lonnemann ME, Paris SV, Gorniak GC. A morphological comparison of the human lumbar multifidus by chemical dissection. J Man Manip Ther. 2008;16:E84–92. doi: 10.1179/jmt.2008.16.4.84E. - DOI - PMC - PubMed
    1. Jorgensen K. Human trunk extensor muscles physiology and ergonomics. Acta Physiol Scand Suppl. 1997;637:1–58. - PubMed

LinkOut - more resources