

Associations between collagen X biomarker and linear growth velocity in a pediatric chronic kidney disease cohort
- PMID: 37466864
- PMCID: PMC10642619
- DOI: 10.1007/s00467-023-06047-0
Associations between collagen X biomarker and linear growth velocity in a pediatric chronic kidney disease cohort
Abstract
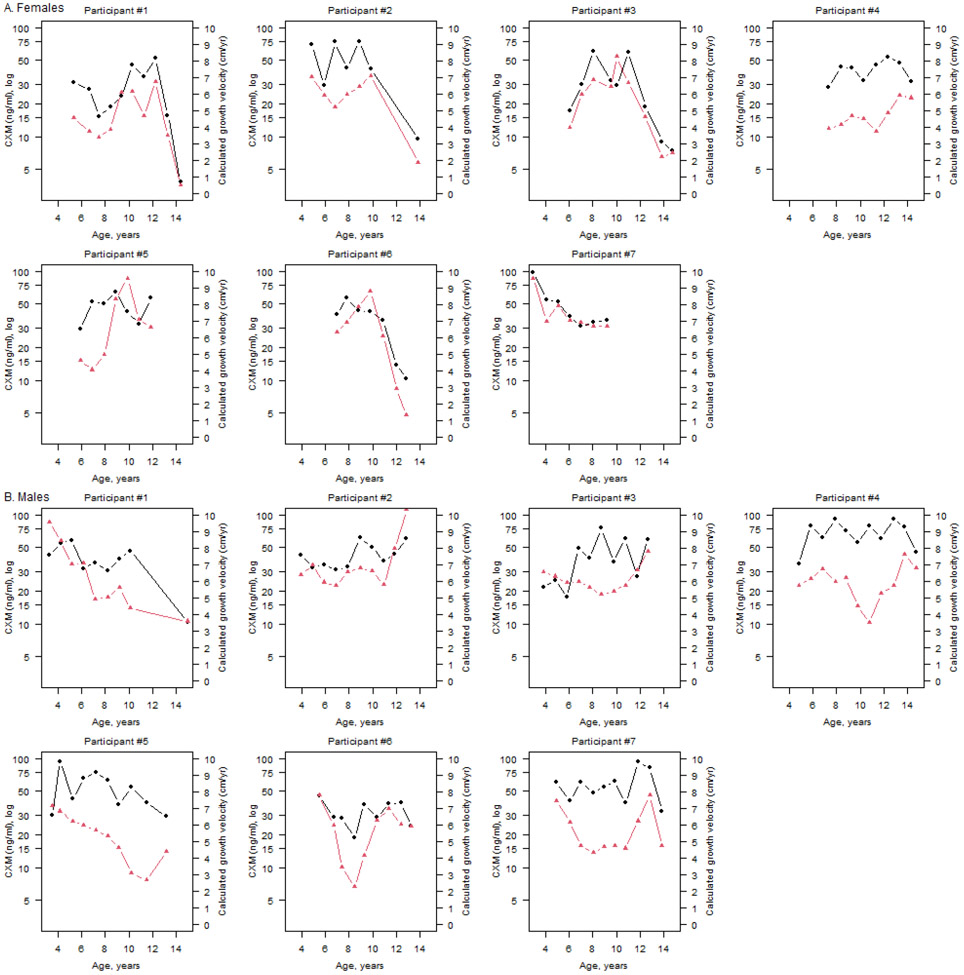
Background: Collagen X biomarker (CXM) is a novel biomarker of linear growth velocity. We investigated whether CXM correlated with measured growth velocity in children with impaired kidney function.
Methods: We used data from children aged 2 through 16 years old enrolled in the Chronic Kidney Disease in Children (CKiD) study. We assessed the association between CXM level and growth velocity based on height measurements obtained at study visits using linear regression models constructed separately by sex, with and without adjustment for CKD covariates. Linear mixed-effects models were used to capture the between-individual and within-individual CXM changes over time associated with concomitant changes in growth velocity from baseline through follow-up.
Results: A total of 967 serum samples from 209 participants were assayed for CXM. CXM correlated more strongly in females compared to male participants. After adjustment for growth velocity and CKD covariates, only proteinuria in male participants affected CXM levels. Finally, we quantified the between- and within-participant associations between CXM level and growth velocity. A between-participant increase of 24% and 15% in CXM level in females and males, respectively, correlated with a 1 cm/year higher growth velocity. Within an individual participant, on average, 28% and 13% increases in CXM values in females and males, respectively, correlated with a 1 cm/year change in measured growth.
Conclusions: CXM measurement is potentially a valuable aid for monitoring growth in pediatric CKD. However, future research, including studies of CXM metabolism, is needed to clarify whether CXM can be a surrogate of growth in children with CKD. A higher resolution version of the Graphical abstract is available as Supplementary information.
Keywords: Biomarker; CKD; CXM; Growth; Pediatrics.
© 2023. The Author(s), under exclusive licence to International Pediatric Nephrology Association.
Figures


Comment in
-
Is collagen X marker (CXM) a useful index of growth velocity in children with chronic kidney disease?Pediatr Nephrol. 2023 Dec;38(12):3871-3873. doi: 10.1007/s00467-023-06105-7. Epub 2023 Jul 26. Pediatr Nephrol. 2023. PMID: 37495740 No abstract available.
References
-
- Tanner JM, Davies PS. Clinical longitudinal standards for height and height velocity for North American children. The Journal of pediatrics. Sep 1985;107(3):317–29. - PubMed
Publication types
MeSH terms
Substances
Grants and funding
LinkOut - more resources
Full Text Sources
Medical
