. 2023 Aug 29;42(8):112821.
doi: 10.1016/j.celrep.2023.112821. Epub 2023 Jul 18.

High FOXA1 levels induce ER transcriptional reprogramming, a pro-metastatic secretome, and metastasis in endocrine-resistant breast cancer

Affiliations

High FOXA1 levels induce ER transcriptional reprogramming, a pro-metastatic secretome, and metastasis in endocrine-resistant breast cancer

Xiaoyong Fu et al. Cell Rep. .

Abstract

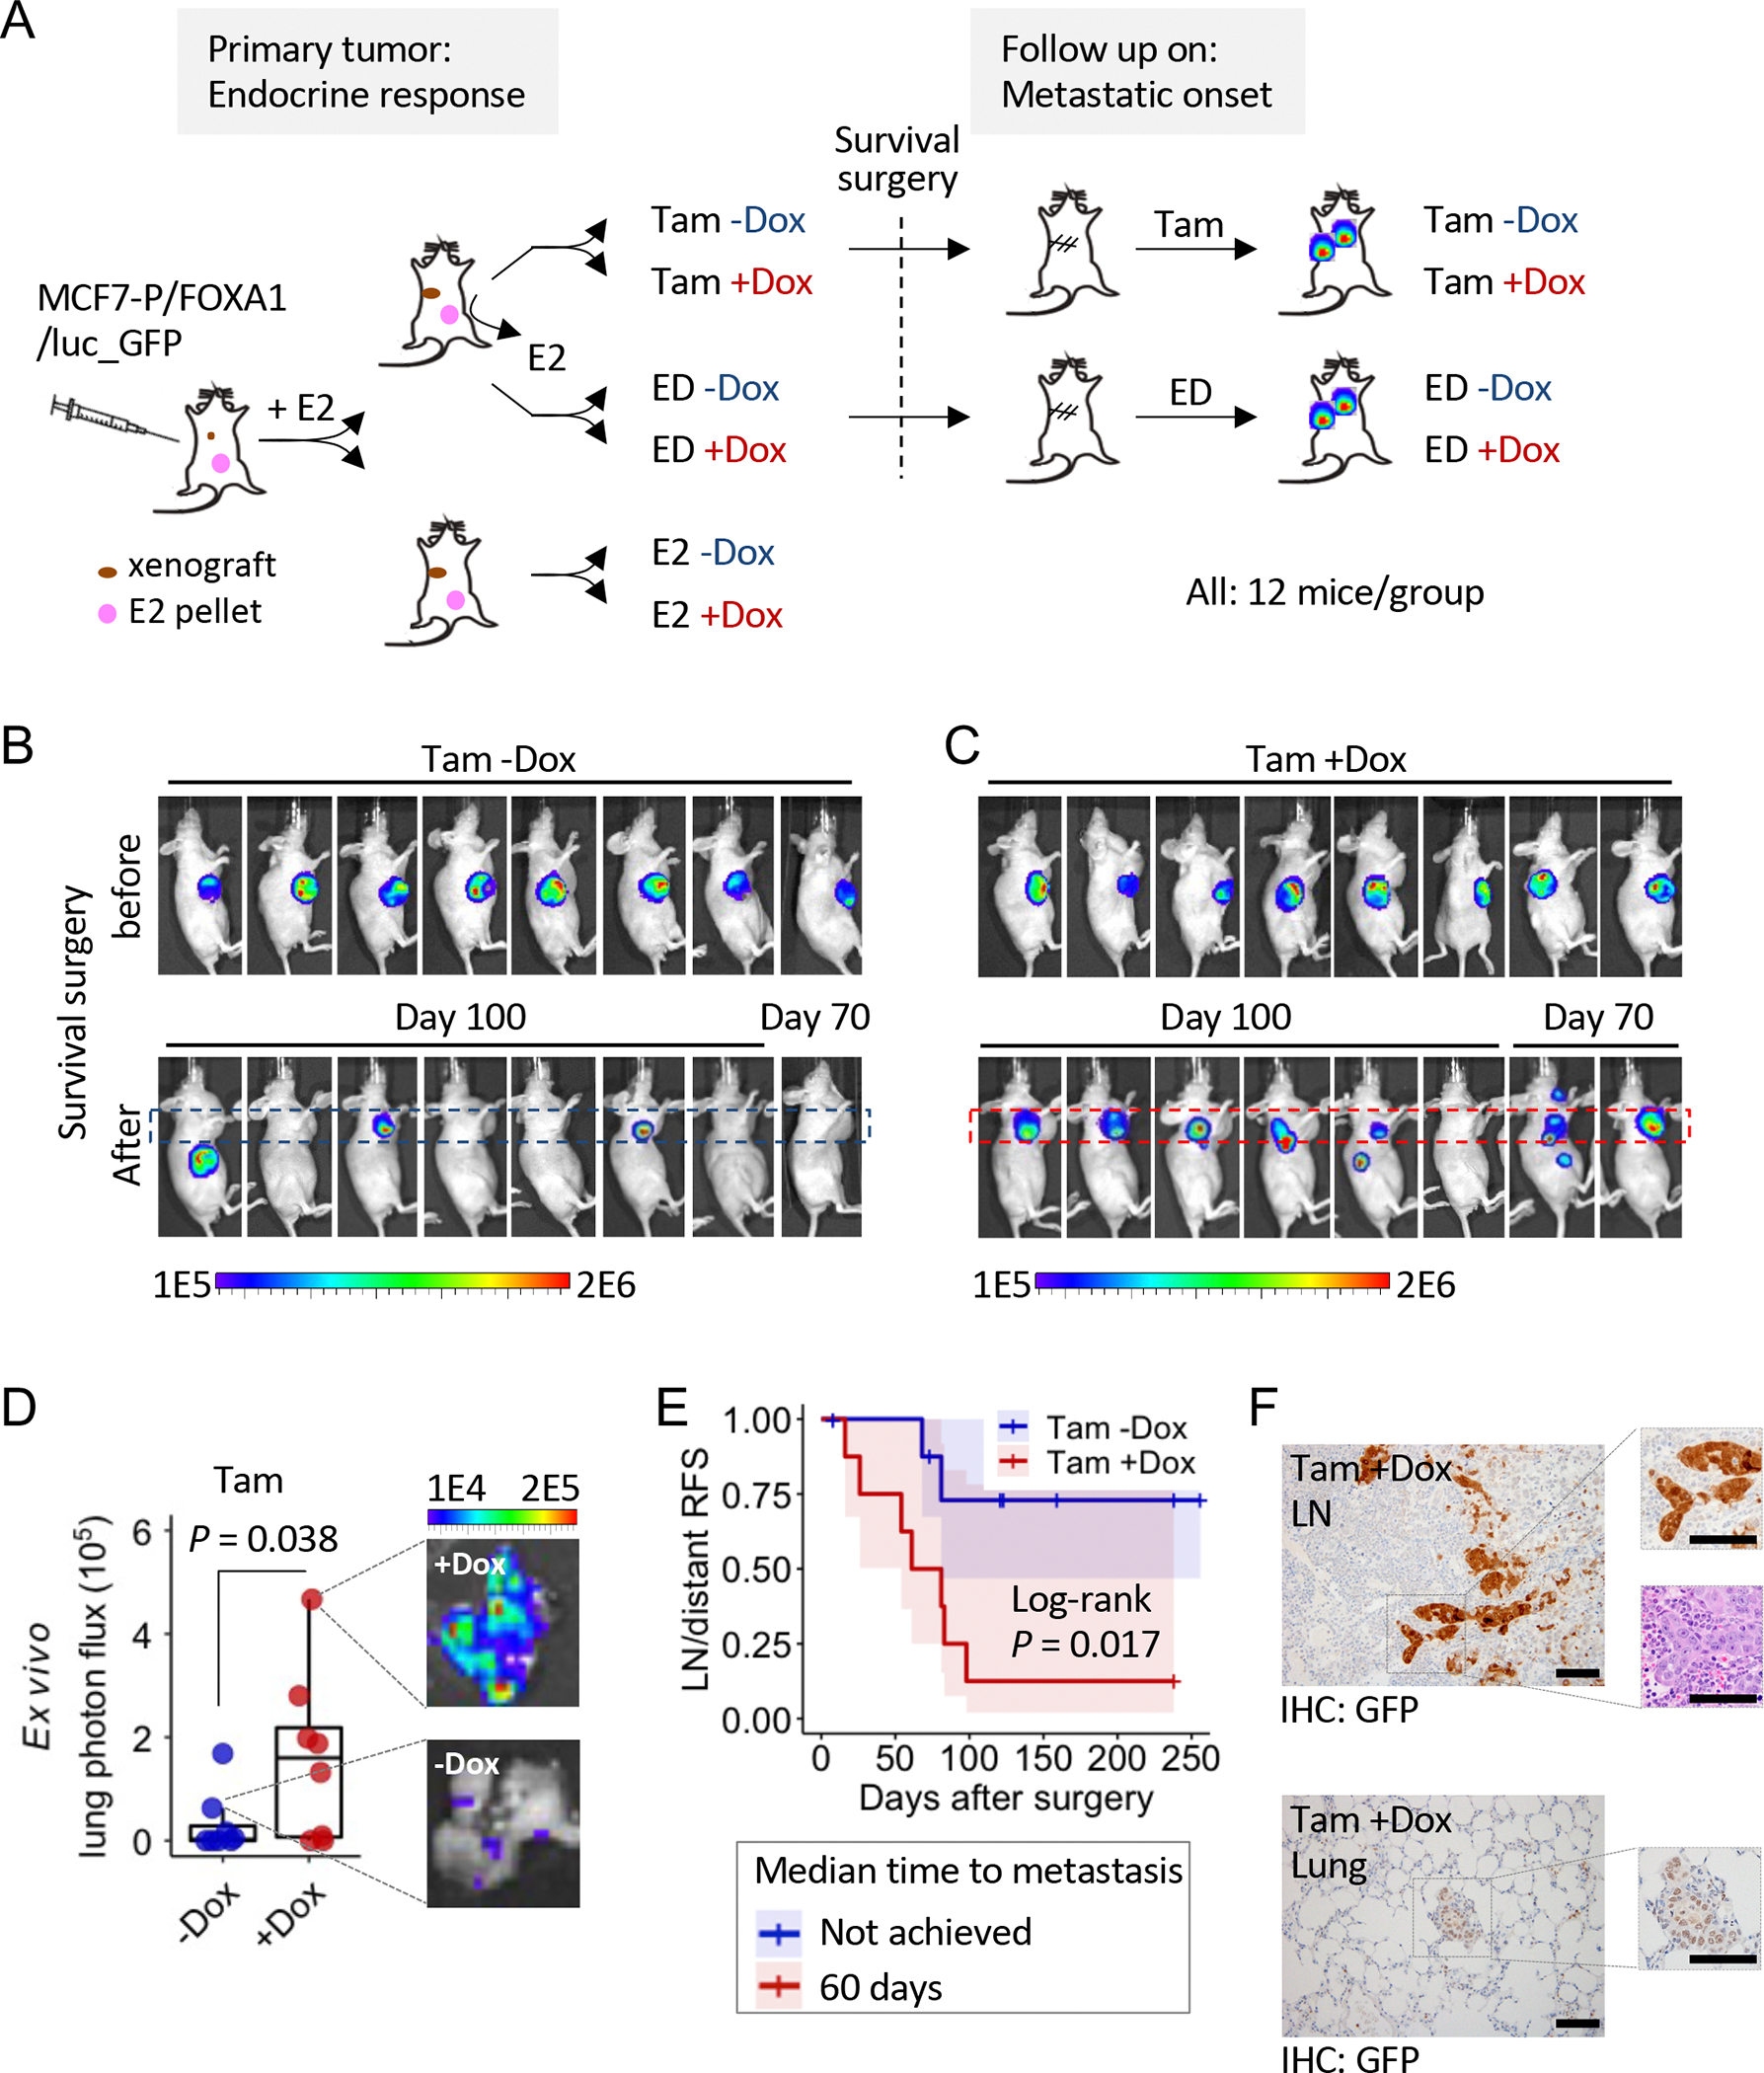
Aberrant activation of the forkhead protein FOXA1 is observed in advanced hormone-related cancers. However, the key mediators of high FOXA1 signaling remain elusive. We demonstrate that ectopic high FOXA1 (H-FOXA1) expression promotes estrogen receptor-positive (ER+) breast cancer (BC) metastasis in a xenograft mouse model. Mechanistically, H-FOXA1 reprograms ER-chromatin binding to elicit a core gene signature (CGS) enriched in ER+ endocrine-resistant (EndoR) cells. We identify Secretome14, a CGS subset encoding ER-dependent cancer secretory proteins, as a strong predictor for poor outcomes of ER+ BC. It is elevated in ER+ metastases vs. primary tumors, irrespective of ESR1 mutations. Genomic ER binding near Secretome14 genes is also increased in mutant ER-expressing or mitogen-treated ER+ BC cells and in ER+ metastatic vs. primary tumors, suggesting a convergent pathway including high growth factor receptor signaling in activating pro-metastatic secretome genes. Our findings uncover H-FOXA1-induced ER reprogramming that drives EndoR and metastasis partly via an H-FOXA1/ER-dependent secretome.

Keywords: CP: Cancer; breast cancer; cistrome; endocrine resistance; enhancer; epigenetic; estrogen receptor; forkhead box protein A1; metastasis; secretome; transcription factor.


Conflict of interest statement

Declaration of interests C.K.O. is a consultant/advisory board member for AstraZeneca, GlaxoSmithKline, Pfizer, Puma Biotechnologies, and Tolmar and on the Data Monitoring Committee for Eli Lilly. R.S. has received research support (to institute) from Puma Biotechnology, Gilead Sciences, and AstraZeneca; is a consultant/advisor of MacroGenics; holds patents, royalties, and other intellectual property from Wolters Kluwer/UpToDate; and has a patent pending (via institution; NRF Ref. BAYM.P0312US.P1-1001123973 “A multiparameter classifier to predict response to HER2-targeted therapy without chemotherapy in HER2-positive breast cancer”) with no revenue received. N.W. is a consultant/advisor for Eli Lilly and AstraZeneca, a member of the scientific advisory board and stockholder for Relay Therapeutics, and a member of the scientific advisory board and stockholder for Flare Therapeutics. He has previously received research support from Novartis and Puma Biotechnology, consulted with Novartis, and consulted with Foundation Medicine. R.J. has received research funding from Pfizer. M.F.R. has received research support from Pfizer and consults with Genentech, Novartis, Daiichi, AstraZeneca, Seagen, and MacroGenics. M.G. is a consultant/advisor for Eli Lilly, MSD, Novartis, Pfizer, Roche, and Seagen.

Figures

Figure 1.
Figure 1.. Ectopic FOXA1 Overexpression (OE) Promotes Tam-treated Xenograft Tumor Metastasis
(A) Schematic of the in vivo experiments to assess the impact of ectopic FOXA1 OE on primary tumor endocrine response (left panel) and metastatic onset after survival surgery (right panel). (B and C) Live bioluminescence images (BLI) showing primary tumor and axillary lymph node (LN)-metastases (mets) post survival surgery in Tam −/+Dox groups. Dashed rectangles mark the armpit regions with LN mets. (D) Quantification of BLI signal in lungs harvested from euthanized mice in the Tam −/+Dox groups. P value was determined by the Wilcoxon rank-sum test. (E) Kaplan-Meier plots depicting LN/distant relapse-free survival (RFS) measured by counting event of the first observed metastatic onset after survival surgery. P value was determined using the log-rank survival test. Bottom panel shows the calculated median time to metastasis of the Tam −/+Dox groups. (F) Representative GFP immunohistochemistry (IHC) staining on LN and lung harvested from the Tam +Dox group. Scale bar, 100 μm. See also Figure S1 and S2.
Figure 2.
Figure 2.. Ectopic FOXA1 OE Reprograms Genome-wide ER and FOXA1 Binding
(A) Heat maps showing intensity of the ER-bound peaks in MCF7-P/FOXA1 +Dox vs. −Dox cells. Also shown is the intensity of overlaid regions bound by ER in E2- or Tam-treated P cells and in TamR cells. Right panel shows the average intensity of the overlaid ER binding. (B) Venn diagram showing the overlaps of ER binding sites between the H-FOXA1-induced ER loss regions and the ER gain regions in P cells upon E2 stimulation. P value was determined using the Pearson’s chi-squared test with Yates’ continuity correction. (C) Bar charts depicting the proportion of the clustered ER binding sites in P/FOXA1 +Dox vs. −Dox cells that overlap with the unique ER binding sites in Tam-treated P and TamR cells. (D) Top enriched binding motifs at the ER-gain and -loss regions in P/FOXA1 +Dox vs. −Dox cells. (E) Heat maps showing the intensity of the FOXA1-bound peaks in MCF7-P/FOXA1 +Dox vs. −Dox cells. Also shown is the intensity of overlaid regions bound by FOXA1 in Tam-treated P and TamR cells. Right panel shows the average intensity of the overlaid FOXA1 binding. (F) Bar charts showing proportion of the clustered FOXA1 binding sites in P/FOXA1 +Dox vs. −Dox cells that overlap with the unique FOXA1 binding sites in Tam-treated P and TamR cells. (G) Top enriched binding motifs at the FOXA1-gain and -loss regions in P/FOXA1 +Dox vs. −Dox cells. For (C) and (F), P value was determined using the chi-square test with the Bonferroni multi-comparison adjustment. See also Figure S3.
Figure 3.
Figure 3.. H-FOXA1 Induces a Core Gene Signature (CGS) that Distinguishes ER+ EndoR BC Cell
(A) Pie chart displaying the proportion of FOXA1-bound motif in MCF7-P/FOXA1 −/+Dox cells among the reservoir of the genome-wide scanned FOXA1 motif (JASPAR: MA0148.1). The motif sequence logo is shown on the bottom panel. (B) Heat maps showing intensity of the FOXA1-bound peaks at the FIMO-scanned FOXA1 motif in P/FOXA1 +Dox vs. −Dox cells. Representative peaks shown by the genome-browser tracks are included on the bottom panel. (C) Box plots showing correlation between the counted FOXA1 motif and the expression of nearby genes in MCF7-P/FOXA1 +Dox vs. −Dox cells. P value was determined using the one-way ANOVA test. (D) Volcano plot depicting the expression changes (x-axis) and the probability of H-FOXA1 targets (y-axis) predicted by the BETA algorithm. The FOXA1-CGS_downregulated (DN) and upregulated (UP) genes are colored in blue and red, respectively, based on the cut-off as indicated by the dashed lines. (E and F) GSEA plots showing the enrichment of the FOXA1-CGS_UP genes in the transcriptome of ZR75–1 and T47D cells with ectopic FOXA1 OE. NES: normalized enrichment score. (G) Western blots for FOXA1, ER, and PR proteins in four ER+ BC cell models with their EndoR derivatives. Also included is the FOXA1 densitometry after normalization using β-actin. (H) Bar charts showing the enrichment score (ES) of the FOXA1-CGS, calculated by single-sample (ss) GSEA using the RNA-seq data with duplicates for each cell model. FOXA1/ER/PR expression (positive or negative) and FOXA1 UP status (EndoR vs. P) based on the Western blots are shown on the upper panel. (I) Quantification of the z-centered ssGSEA ES of the FOXA1-CGS across three defined categories of cell models. Box was plotted by mean ± SEM with whiskers extended to the highest and lowest values. P value was determined using the pairwise t test with multiple test corrections. See also Figure S4 and S5.
Figure 4.
Figure 4.. The FOXA1-CGS Is Enriched for a H-FOXA1/ER-dependent Secretome in ER+ EndoR Cells
(A) Bar charts showing subcellular distribution of the proteins encoded by the FOXA1-CGS genes using the MCF7 proteome SubCellBarCode data. NC: no-change. (B) Bar charts showing actual and expected proportion of the FOXA1-CGS_UP genes encoding secretory proteins defined by the Plasma Proteome and the SPOCTOPUS. (C) Venn diagram depicting the FOXA1-CGS_Secretome annotated by the secretome pool merged by the MCF7 SubCellBarCode proteome and the secretome classified by the Human Protein Atlas Version 19 (https://www.proteinatlas.org). (D and E) GSEA plots showing the enrichment of the FOXA1-CGS_Secretome genes in the transcriptome of MCF7-TamR and P cells upon FOXA1 knockdown (KD). (F) Heat maps showing expression log2 fold change (FC) of the leading-edge gene (from (D)) in TamR and P cells upon ER or FOXA1 KD vs. the non-specific (NS) KD. The sub-panel of Secretome14 that is DN upon ER and FOXA1 KD in TamR cells is shaded in gray. (G and H) Density plots displaying the preferential changes in Secretome14 gene expression in TamR vs. P cells upon ER or FOXA1 KD. P value was determined using the two-sided Kolmogorov-Smirnov test. (I) Quantification of Secretome14 expression, assessed by the average modified Z-score (AveMZ), across MCF7 E2-treated and EndoR xenograft tumors. (J) Quantification of Secretome14 AveMZ across METABRIC HER2− BC with defined ER/PR status. (K) Dot plots showing Secretome14 AveMZ across four EndoR cell models (each in duplicates) with defined ER/PR status. P value was determined using the unpaired two-sample t test. For (A) and (B), P value was determined using the chi-square test with the Bonferroni multi-comparison adjustment. N.S., non-significant. For (I) and (J), box was plotted by mean ± SEM and P value was determined using the pairwise t test with multiple test corrections. See also Figure S6–S9.
Figure 5.
Figure 5.. Secretome14 Predicts Poor Outcomes of ER+ BC Treated with Endocrine Therapy (ET)
(A and B) Kaplan-Meier plots depicting BC-specific survival (BCSS) of ER+ BC patients treated with ET and no chemotherapy and of patients without ET, stratified by median level of Secretome14 expression. The 95% confidence interval (CI) was depicted in colors for point estimates hereafter. P value and hazard ratio (HR) were calculated hereafter using the likelihood ratio test and Wald estimates in the Cox proportional hazards model. (C) Forest plots for HR of Cox multivariate analyses. Factors contributing to BCSS within 5- and 15-year follow-up are indicated by the red boxes with P < 0.05. NPI: Nottingham Prognostic Index; LN: lymph node. (D and E) Kaplan-Meier plots depicting distant relapse-free survival (DRFS) of ER+ BC patients treated with ET and no chemotherapy and of patients without ET, stratified by median level of Secretome14 expression. (F) Forest plots for HR of Cox multivariate analyses. Factors contributing to DRFS within 5- and 15-year follow-up are indicated by the red boxes with P < 0.05. (G and H) Forest plots for HR of Cox multivariate analyses. Single Secretome14 genes and clinicopathologic factors contributing to BCSS and DRFS within 15-year follow-up are indicated by the red boxes with P < 0.05. See also Figure S10.
Figure 6.
Figure 6.. Secretome14 Correlates with FOXA1 Expression and Escalates in ER+ Mets
(A) Quantification of Secretome14 expression in ER+ mets vs. ER+ primary tumors. P value was determined using Welch’s t-test for samples with unequal variance. (B and C) Scatter plots depicting correlation between FOXA1 mRNA and Secretome14 expression levels in ER+ primary tumors and ER+ mets. P value was determined using the Pearson correlation coefficient test. Genetic status of FOXA1 and ESR1 are denoted on the right panel. (D) Quantification of Secretome14 expression in ER+ mets harboring amplified (Amp)/mutant (Mut) vs. wild-type (WT) FOXA1. (E) Quantification of Secretome14 expression in ER+ mets (stratified by the FOXA1 status on the upper and lower panels) harboring Mut vs. WT ESR1. (F) Changes in Secretome14 expression in ER+ mets (stratified by the FOXA1 and ESR1 status) vs. their matched ER+ primary tumors. Number of matched pairs in each group is indicated. P value was determined using the paired two-sample t test. (G) Expression changes of single Secretome14 genes in ER+ mets vs. ER+ primary tumors. Scaled color (split in white corresponding to P = 0.05) denotes transformed P value calculated by the unpaired two-sample t test. (H and I) Correlation between expression levels of FOXA1 and single Secretome14 genes in ER+ mets and ER+ primary tumors. Scaled color (split in white corresponding to P = 0.05) denotes transformed P value calculated by the Spearman correlation coefficient test. For (D) and (E), P value was determined using the Wilcoxon rank-sum test. See also Figure S11.
Figure 7.
Figure 7.. Enhanced ER Binding and Reprogramming Occurs at the Secretome14 Gene Loci in ER+ Cell Models and Clinical Tumors
(A) Average ER binding intensity at the Secretome14 gene enhancers in MCF7 cells upon E2 or E2 vs. ED in the presence of Dox inducing ectopic mutant ER (Y537S or D538G) OE. (B) Dot plots showing Secretome14 expression in MCF7 cells −/+Dox to induce ectopic mutant ER (Y537S or D538G) OE in full medium (FM), or upon E2 or ED treatment. (C) Schematic of the ChIP-seq experiments using MCF7 cells and clinical BC samples (as in ). (D and E) Average ER binding intensity at the Secretome14 gene enhancers in MCF7 cells treated with cocktail and in the BC cohort. (F) Heat map of hierarchical clustering of the aggregated ER binding intensity at the single Secretome14 gene enhancers across the ER+ mets, ER+ tumors with poor or good prognosis, and ER− tumors. (G) Model depicting ER-dependent (dep) reprogramming activated by the H-FOXA1/ER transcriptional axis to promote BC EndoR and metastasis. For (A), (D), and (E), P value was determined using the paired two-sample t test. See also Figure S12.

References

    1. Huang B, Warner M, and Gustafsson JA (2015). Estrogen receptors in breast carcinogenesis and endocrine therapy. Mol Cell Endocrinol 418 Pt 3, 240–244. 10.1016/j.mce.2014.11.015. - DOI - PubMed
    1. Brisken C, and O’Malley B (2010). Hormone action in the mammary gland. Cold Spring Harb Perspect Biol 2, a003178. 10.1101/cshperspect.a003178. - DOI - PMC - PubMed
    1. Reinert T, de Paula B, Shafaee MN, Souza PH, Ellis MJ, and Bines J (2018). Endocrine therapy for ER-positive/HER2-negative metastatic breast cancer. Chin Clin Oncol 7, 25. 10.21037/cco.2018.06.06. - DOI - PubMed
    1. Osborne CK, and Schiff R (2011). Mechanisms of endocrine resistance in breast cancer. Annu Rev Med 62, 233–247. 10.1146/annurev-med-070909-182917. - DOI - PMC - PubMed
    1. Nardone A, De Angelis C, Trivedi MV, Osborne CK, and Schiff R (2015). The changing role of ER in endocrine resistance. Breast 24 Suppl 2, S60–66. 10.1016/j.breast.2015.07.015. - DOI - PMC - PubMed

LinkOut - more resources