. 2023 Jul 19;15(705):eade3341.
doi: 10.1126/scitranslmed.ade3341. Epub 2023 Jul 19.

Nicotinamide enhances natural killer cell function and yields remissions in patients with non-Hodgkin lymphoma

Affiliations

Nicotinamide enhances natural killer cell function and yields remissions in patients with non-Hodgkin lymphoma

Frank Cichocki et al. Sci Transl Med. .

Abstract

Allogeneic natural killer (NK) cell adoptive transfer has shown the potential to induce remissions in relapsed or refractory leukemias and lymphomas, but strategies to enhance NK cell survival and function are needed to improve clinical efficacy. Here, we demonstrated that NK cells cultured ex vivo with interleukin-15 (IL-15) and nicotinamide (NAM) exhibited stable induction of l-selectin (CD62L), a lymphocyte adhesion molecule important for lymph node homing. High frequencies of CD62L were associated with elevated transcription factor forkhead box O1 (FOXO1), and NAM promoted the stability of FOXO1 by preventing proteasomal degradation. NK cells cultured with NAM exhibited metabolic changes associated with elevated glucose flux and protection against oxidative stress. NK cells incubated with NAM also displayed enhanced cytotoxicity and inflammatory cytokine production and preferentially persisted in xenogeneic adoptive transfer experiments. We also conducted a first-in-human phase 1 clinical trial testing adoptive transfer of NK cells expanded ex vivo with IL-15 and NAM (GDA-201) combined with monoclonal antibodies in patients with relapsed or refractory non-Hodgkin lymphoma (NHL) and multiple myeloma (MM) (NCT03019666). Cellular therapy with GDA-201 and rituximab was well tolerated and yielded an overall response rate of 74% in 19 patients with advanced NHL. Thirteen patients had a complete response, and 1 patient had a partial response. GDA-201 cells were detected for up to 14 days in blood, bone marrow, and tumor tissues and maintained a favorable metabolic profile. The safety and efficacy of GDA-201 in this study support further development as a cancer therapy.


Conflict of interest statement

Competing interests: F.C. and J.S.M. are paid consultants for Fate Therapeutics, and they receive research funds and stock options from this relationship. J.S.M. serves on the Scientific Advisory Board of ONK Therapeutics and Wugan and is a paid consultant for GT BioPharma and Vycellix (with research funds and stock options), all unrelated to the content of this manuscript. M.J. receives consulting fees from Jansen. B.G. is a paid consultant for Fate Therapeutics and MLM Diagnostics. R.S.O. receives equity from Nucleus Biologics, research support from NeoTx, and patent licensing from Novartis. These relationships are unrelated to the content of this manuscript. F.C. and V.B. receive research and clinical trial financial support from Gamida Cell Ltd. V.B. serves on the DSMB for Miltenyi Biotech and on advisory boards for AstraZeneca, Amgen, Kite, ADC Therapeutics, and Takeda. V.B. also receives research funding from Citius and Incyte. D.Y., R.S., and Y.G. are employees of Gamida Cell Ltd.

Figures

Fig. 1.
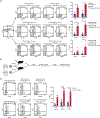
Fig. 1.. NK cells cultured ex vivo with NAM display elevated CD62L and CD44.
(A) CD3/CD19-depleted PBMCs were cultured for 14 days with IL-15 ± NAM and analyzed by flow cytometry. Representative flow cytometry plots of the indicated surface antigens on NK cells cultured in each condition are shown. Data are representative of two independent experiments. The frequency and density of CD62L (B) (n = 16) and (C) CD44 (n = 5) on NK cells cultured ex vivo with IL-15 ± NAM. Statistical significance was determined using Student’s t tests. ****P ≤ 0.0001. MFI, mean fluorescence intensity.
Fig. 2.
Fig. 2.. NAM promotes stable cell surface CD62L.
(A) The indicated NK cell subsets were sorted and cultured for 14 days with IL-15 ± NAM. Left: Flow cytometry plots of CD62L and CD57 at days 7 and 14 from a representative donor. Right: Cumulative data from four independent experiments. (B) Experimental design for xenogeneic adoptive transfer experiments testing the stability of CD62L after NAM withdrawal. CD3/CD19-depleted PBMCs were cultured for 14 days with IL-15 ± NAM and then injected intraperitoneally (i.p.) into NSG mice. Groups of mice were sacrificed at days 7 and 14. The peritonea of mice were washed, and cells were collected for analysis of CD62L on human NK cells by flow cytometry. (C) Left: Flow cytometry plots of CD62L and CD57 on NK cells from each culture condition on days 7 and 14 after adoptive transfer from a representative donor. Right: Cumulative data from six donors in two independent experiments. Statistical significance was determined using Student’s t tests. *P ≤ 0.05, **P ≤ 0.01, ***P ≤ 0.001, and ****P ≤ 0.0001.
Fig. 3.
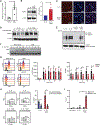
Fig. 3.. NAM prevents FOXO1 degradation for enhanced SELL expression.
(A) CD3/CD19-depleted PBMCs were cultured for 14 days with IL-15 ± NAM. FOXO1 and SELL mRNA were determined by quantitative real-time PCR (n = 5) in two independent experiments. All data were normalized against ACTB. (B) FOXO1 protein was assessed by Western blot. FOXO1 and β-actin blots from a representative donor (left) and cumulative data of the relative FOXO1 fold increases in NK cells cultured with NAM (right) are shown. Data are from four donors in two independent experiments. (C) FOXO1 protein (red) was analyzed by confocal microscopy. Nuclei are stained blue. Images are representative of two donors analyzed. (D) NK cells were isolated and cultured overnight with IL-15 ± NAM. The next day, cells were cultured for 0, 3, and 6 hours with cycloheximide (10 mg/ml). FOXO1 protein was determined by Western blot. Data from a representative experiment (n = 2) are shown. (E) NK cells were cultured overnight with IL-15 ± NAM. The next day, cells were cultured in the absence or presence of 10 mM MG132 for 6 hours. FOXO1 ubiquitination was assessed by coimmunoprecipitation. Data are representative of two independent experiments. (F) NK cells were cultured for 0, 3, 10, 30, or 60 min with IL-15. Cells were fixed and lysed at each time point for assessment of total and phosphorylated Akt. Data are representative of two independent experiments. (G) PBMCs were isolated and rested overnight in the absence of exogenous cytokines ± NAM. The next day, cells were cultured for 0, 5, 10, 20, or 30 min with IL-15. Phosphorylated STAT5 and Akt were analyzed by intracellular flow cytometry. Flow cytometry histogram plots from a representative donor (left) and cumulative data from four donors in two independent experiments (right) are shown. (H) NK cells were cultured for 14 days with IL-15 ± NAM ± 100 nM AS1842856. Flow cytometry plots of CD62L on NK cells from a representative donor (left) and cumulative data from four donors in two independent experiments (right) are shown. SSC, side scatter. (I) NK cells were cultured as described in (A). Lysates from these cells were used in ChIP assays to assess FOXO1 binding to the SELL promoter. All data were normalized to input. Statistical significance was determined using Student’s t tests. *P ≤ 0.05 and **P ≤ 0.01.
Fig. 4.
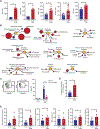
Fig. 4.. NAM affects multiple metabolic pathways and promotes NK cell resistance to oxidative stress.
(A) NK cells were cultured for 14 days with IL-15 ± NAM. Colorimetric assays were used to measure NAD+ (n = 6), NADH (n = 6), NADP+ (n = 14), NADPH (n = 14), and ATP (n = 3). (B) NK cells from 24 donors were cultured as described in (A), and global metabolic profiles were determined by mass spectrometry. Metabolic pathways that were altered by NAM supplementation are shown. Red indicates metabolites that were significantly higher in NK cells cultured with IL-15 and NAM, blue indicates metabolites that were significantly higher in NK cells cultured with IL-15 alone, and white indicates no statistically significant difference between groups. Light red and blue circles represent metabolites that approached statistical significance. The size of the circles reflects the magnitude of the difference. (C) NK cells were cultured as described in (A) and incubated with or without 100 mM H2O2 for 1 hour. Cells were then stained with MitoSOX dye and analyzed by flow cytometry. Representative flow cytometry plots (left) and cumulative data from eight donors in four independent experiments (right) are shown. (D) Enriched NK cells from three donors were cultured for 14 days with IL-15 ± NAM. Cells were then washed and put into media containing 13C6 glucose. Analysis of carbon-labeled acetyl-CoA was performed by mass spectrometry. (E) Real-time metabolic profiling of NK cells cultured for 14 days with IL-15 ± NAM was performed by Seahorse. Cumulative data from four donors in two independent experiments are shown. Statistical significance was determined using Student’s t tests. *P ≤ 0.05, **P ≤ 0.01, ***P ≤ 0.001, and ****P ≤ 0.0001.
Fig. 5.
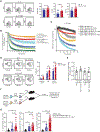
Fig. 5.. NAM enhances NK cell function and tissue retention.
(A) NK cells from 10 donors were cultured for 14 days with IL-15 ± NAM. NK cells were then cocultured with K562 cells at a 2:1 E:T ratio for 5 hours. NK cell degranulation, TNF production, and IFN-γ production were assessed by flow cytometry. Flow cytometry plots from a representative experiment (left) and cumulative data from four independent experiments (right) are shown. (B) Enriched NK cells and (C) sorted NK cell subsets were cultured as described above and then cocultured with K562 cells transduced with NucLight Red at the indicated E:T ratios. Cytotoxicity was assessed in real time by IncuCyte imaging. Data are representative of two independent experiments. Statistical significance was determined using Student’s t tests. (D) Enriched NK cells from five donors were cultured for 7 days with IL-15 ± NAM. NK cells were then cocultured with Raji cells alone or with rituximab (1 μg/ml) at a 2:1 E:T ratio and analyzed by flow cytometry. Frequencies of surface CD107a on NK cells from each condition for a representative donor (left) and cumulative graphed data (right) are shown. Statistical significance was determined using Student’s t tests. (E) Ratios of CD62L frequencies on the surface of CD107a+ and CD107a NK cells in the functional assay using Raji targets with and without rituximab for each culture condition. (F) Schematic illustrating the experimental design to assess NK cell frequencies in tissues after adoptive transfer. NK cells from five donors were cultured for 14 days with IL-15 ± NAM and labeled with CFSE dye. Cells (1.5 × 10⁷) were injected intravenously into each mouse. Control mice received injections of human serum albumin (HSA) buffer alone. Mice were sacrificed after 4 days, and blood, bone marrow, and spleen tissues were harvested. The frequencies of dye-labeled human NK cells were determined by flow cytometry. (G) Cumulative data from five independent experiments performed with 6 mice per group for a total of 90 mice. Statistical significance was determined by one-way ANOVA. *P ≤ 0.05, **P ≤ 0.01, ***P ≤ 0.001, and ****P ≤ 0.0001.
Fig. 6.
Fig. 6.. Complete remissions were observed after GDA-201 treatment.
(A) Schematic showing the steps used to generate NAM-expanded peripheral blood NK cells for immunotherapy in the GMP facility. (B) Schematic of the phase 1 clinical trial testing the safety and efficacy of GDA-201 in combination with monoclonal antibody (mAb) and IL-2. IV, intravenously; SC, subcutaneously. (C) Swimmer’s plot representing disease type and duration of response for the R/R NHL cohort (n = 19). NHL subtype, CR or PR, ongoing response, and progressive disease are indicated. (D) PFS and (E) overall survival at 2 years for the R/R NHL cohort censored for transplant. (F) Percentages of donor NK cells (as a fraction of total peripheral blood NK cells) after adoptive transfer for 15 patients for whom donor and host NK cells could be distinguished using fluorescently conjugated antibodies specific for HLA-A and HLA-B alleles.
Fig. 7.
Fig. 7.. Tumor regression is associated with dense host T cell infiltration into lymph node tissue after GDA-201 treatment.
(A) PET scan of patient 009 at baseline and 6 months after GDA-201 treatment. (B) Hematoxylin-eosin–stained section showing histology of a lymph node core biopsy sample from patient 009 before GDA-201 treatment. (C) CD20 and (D) CD3 staining of a pretreatment lymph node biopsy sample from patient 009. (E) Hematoxylin-eosin–stained section showing the histology of a lymph node biopsy sample from patient 009 at day 16 after GDA-201 treatment. (F) CD20 and (G) CD3 staining of simulated immunohistochemistry derived from immunofluorescence CODEX analysis of a lymph node biopsy sample from patient 009 at day 16 after GDA-201 treatment. (H) CODEX-stained section showing NK and T cell infiltration within a lymph node biopsy sample from patient 009 at day 16 after GDA-201 treatment. The same section of lymph node biopsy sample was also analyzed for the presence of (I) B cells and (J) CD4+ T cells and CD8+ T cells. (K) Flow cytometry analysis of NK cells within peripheral blood and lymph node biopsy tissue at the indicated time points after GDA-201. Donor cells were detected by differences in HLA (donor NK cells are HLA-A2, and host NK cells are HLA-A2+). Flow plots are gated on CD45+CD56+CD3 NK cells. FSC, forward scatter.
Fig. 8.
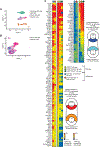
Fig. 8.. NK cells expanded ex vivo with IL-15 and NAM have a transcriptional profile similar to CD56bright NK cells.
NK cells were sorted from banked apheresis products used to generate GDA-201 NK cells to treat three patients and from the expanded GDA-201 NK cell products. GDA-201 and host NK cells were also sorted from peripheral blood collected 4 days after treatment. All sorted populations were assessed by scRNA-seq. (A) Cluster analysis of all four sorted populations from three sets of product and patient samples. (B) Cluster analysis comparing the day 4 GDA-201 and host NK cells only. (C) Heatmaps of transcripts with differential expression between GDA-201 and apheresis NK cells and between day 4 GDA-201 and host NK cells. Heatmaps of relative transcript expression of the same genes in a bulk RNA-seq comparison of CD56bright, CD56dimCD94high, and CD56dimCD94low/− NK cells sorted from four healthy donors are also shown.

References

    1. Narni-Mancinelli E, Ugolini S, Vivier E, Tuning the threshold of natural killer cell responses. Curr. Opin. Immunol. 25, 53–58 (2013). - PubMed
    1. Miller JS, Soignier Y, Panoskaltsis-Mortari A, McNearney SA, Yun GH, Fautsch SK, McKenna D, Le C, Defor TE, Burns LJ, Orchard PJ, Blazar BR, Wagner JE, Slungaard A, Weisdorf DJ, Okazaki IJ, McGlave PB, Successful adoptive transfer and in vivo expansion of human haploidentical NK cells in patients with cancer. Blood 105, 3051–3057 (2005). - PubMed
    1. Bachanova V, Cooley S, Defor TE, Verneris MR, Zhang B, McKenna DH, Curtsinger J, Panoskaltsis-Mortari A, Lewis D, Hippen K, McGlave P, Weisdorf DJ, Blazar BR, Miller JS, Clearance of acute myeloid leukemia by haploidentical natural killer cells is improved using IL-2 diphtheria toxin fusion protein. Blood 123, 3855–3863 (2014). - PMC - PubMed
    1. Bachanova V, Sarhan D, DeFor TE, Cooley S, Panoskaltsis-Mortari A, Blazar BR, Curtsinger JM, Burns L, Weisdorf DJ, Miller JS, Haploidentical natural killer cells induce remissions in non-Hodgkin lymphoma patients with low levels of immune-suppressor cells. Cancer Immunol. Immunother. 67, 483–494 (2018). - PMC - PubMed
    1. Peled T, Shoham H, Aschengrau D, Yackoubov D, Frei G, Rosenheimer GN, Lerrer B, Cohen HY, Nagler A, Fibach E, Peled A, Nicotinamide, a SIRT1 inhibitor, inhibits differentiation and facilitates expansion of hematopoietic progenitor cells with enhanced bone marrow homing and engraftment. Exp. Hematol. 40, 342–355.e1 (2012). - PubMed

Publication types

Associated data