. 2023 Jul 21;9(29):eadg2697.
doi: 10.1126/sciadv.adg2697. Epub 2023 Jul 19.

d-lactate modulates M2 tumor-associated macrophages and remodels immunosuppressive tumor microenvironment for hepatocellular carcinoma

Affiliations

d-lactate modulates M2 tumor-associated macrophages and remodels immunosuppressive tumor microenvironment for hepatocellular carcinoma

Shulan Han et al. Sci Adv. .

Abstract

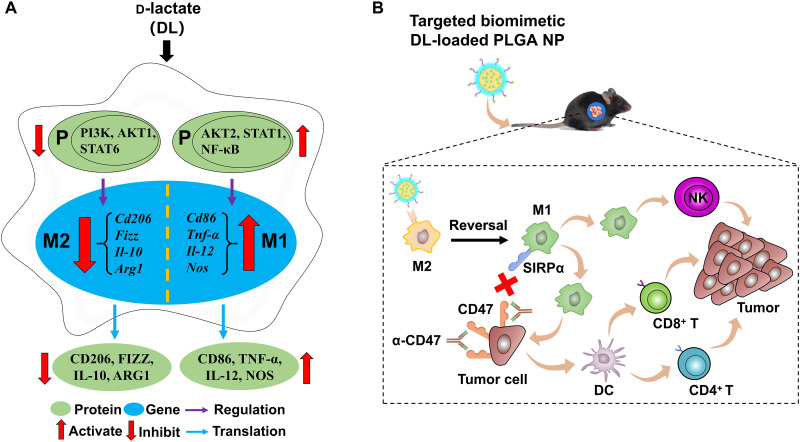
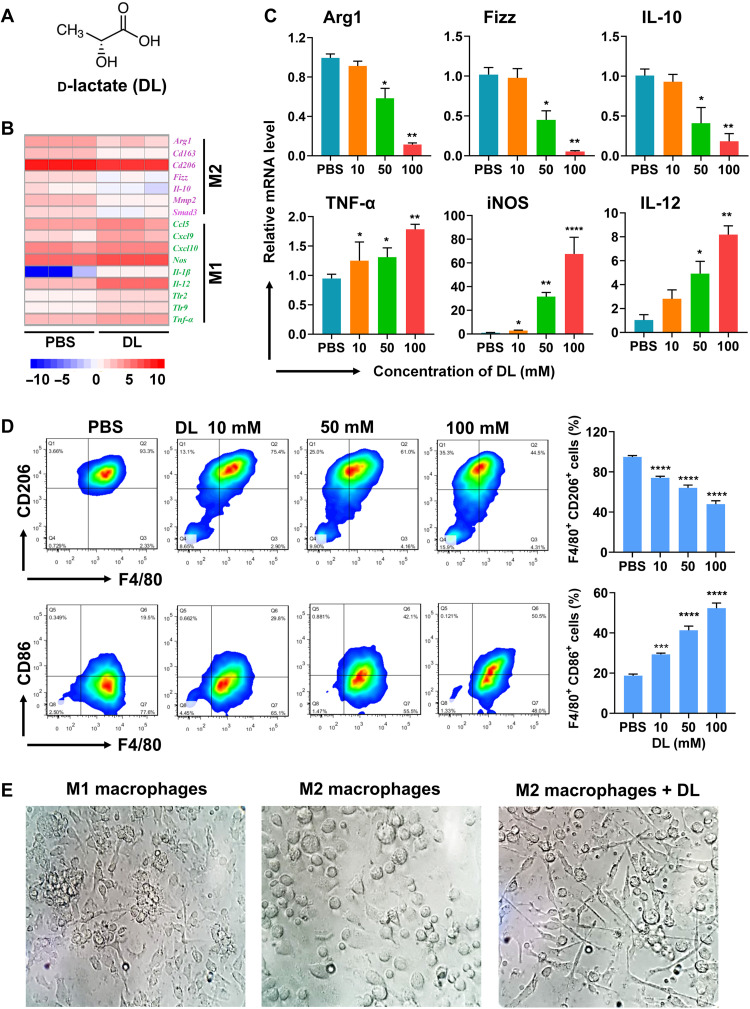
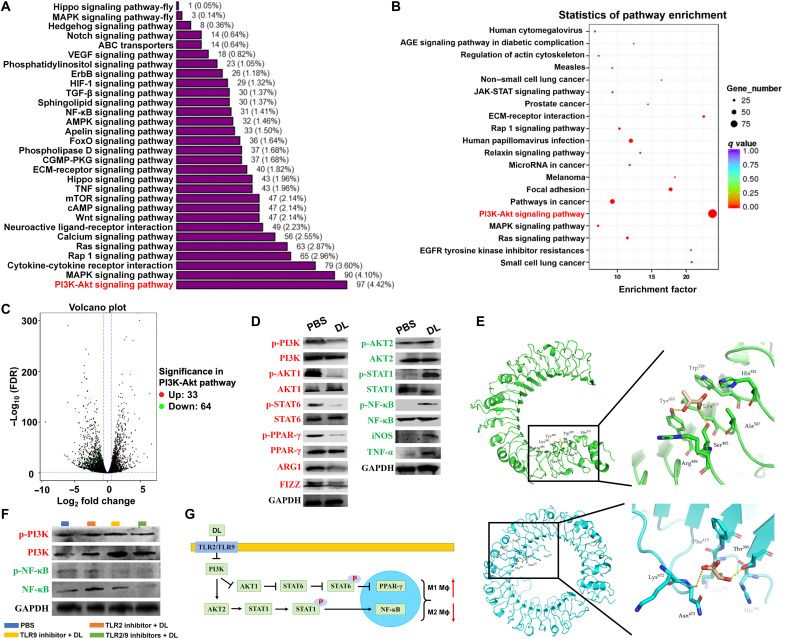
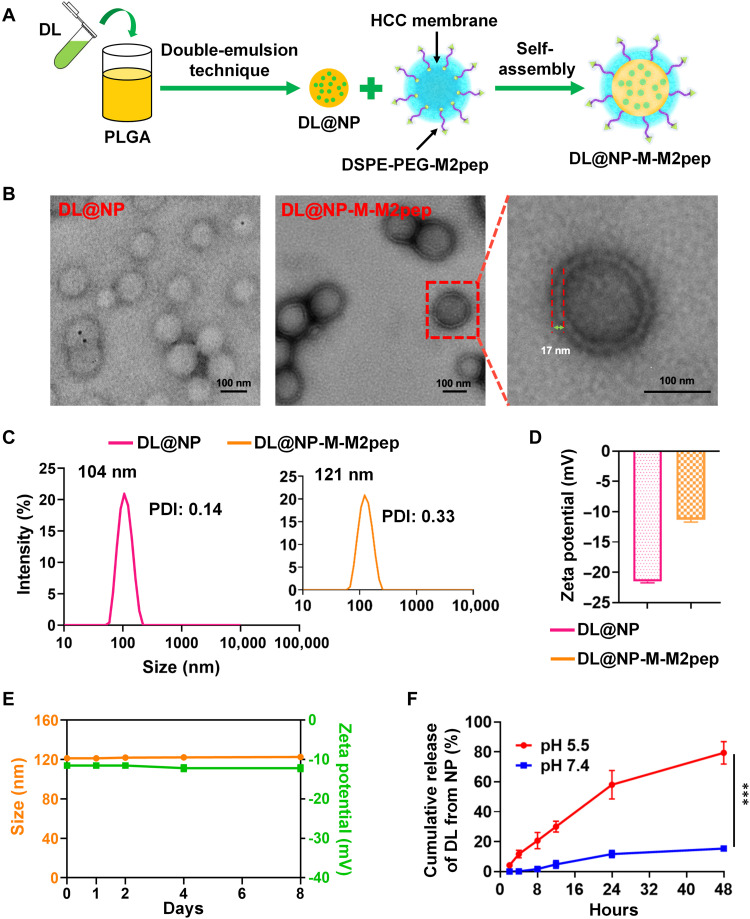
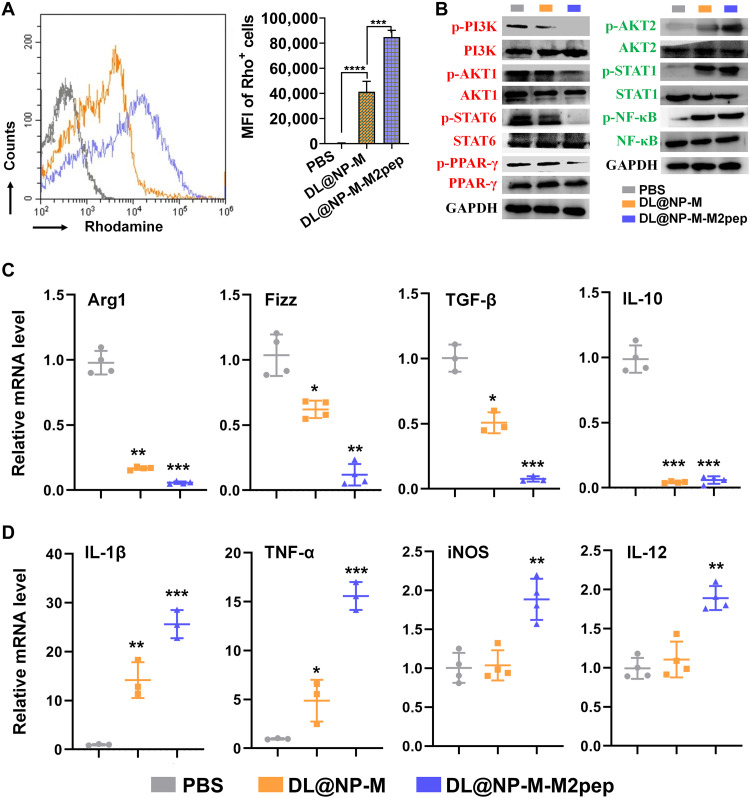
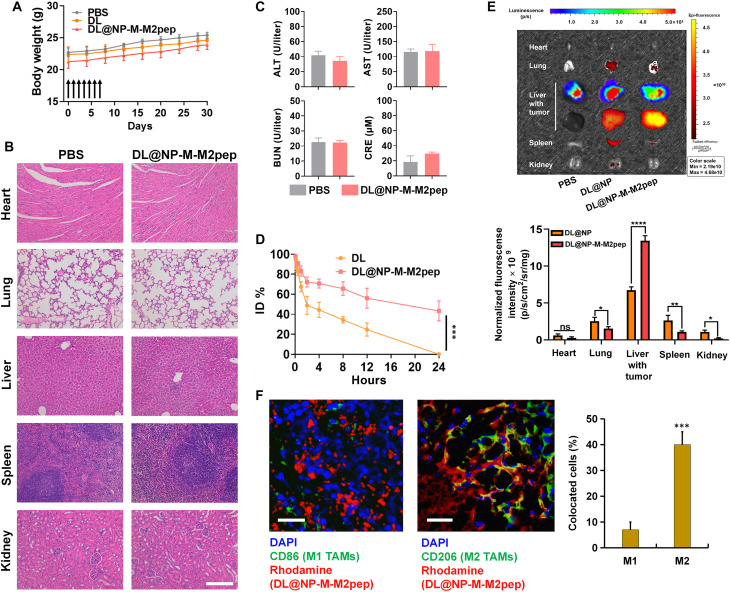
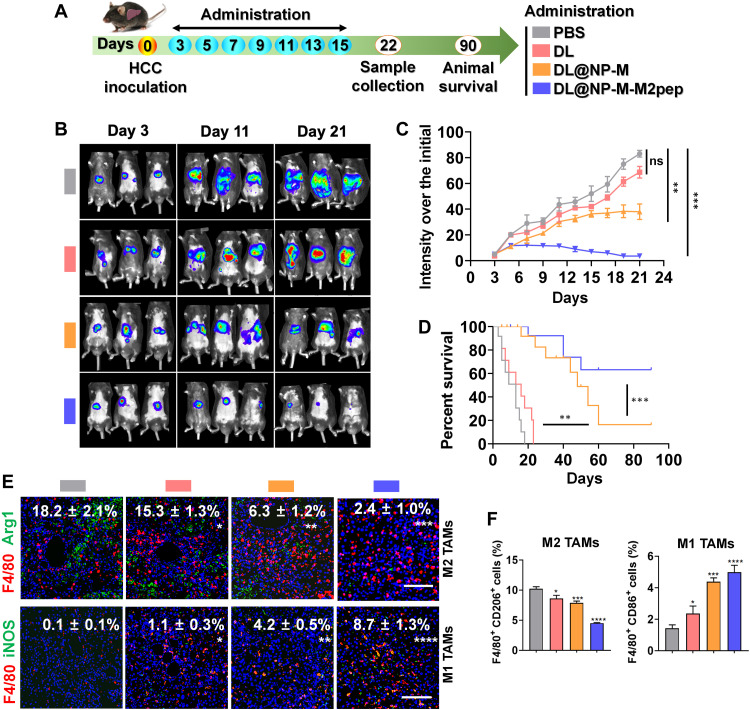
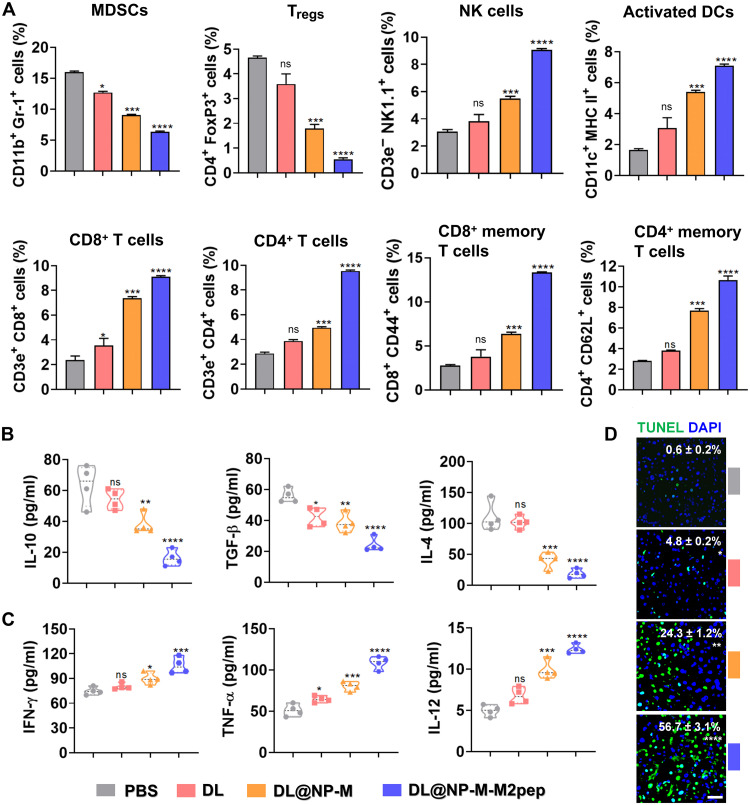
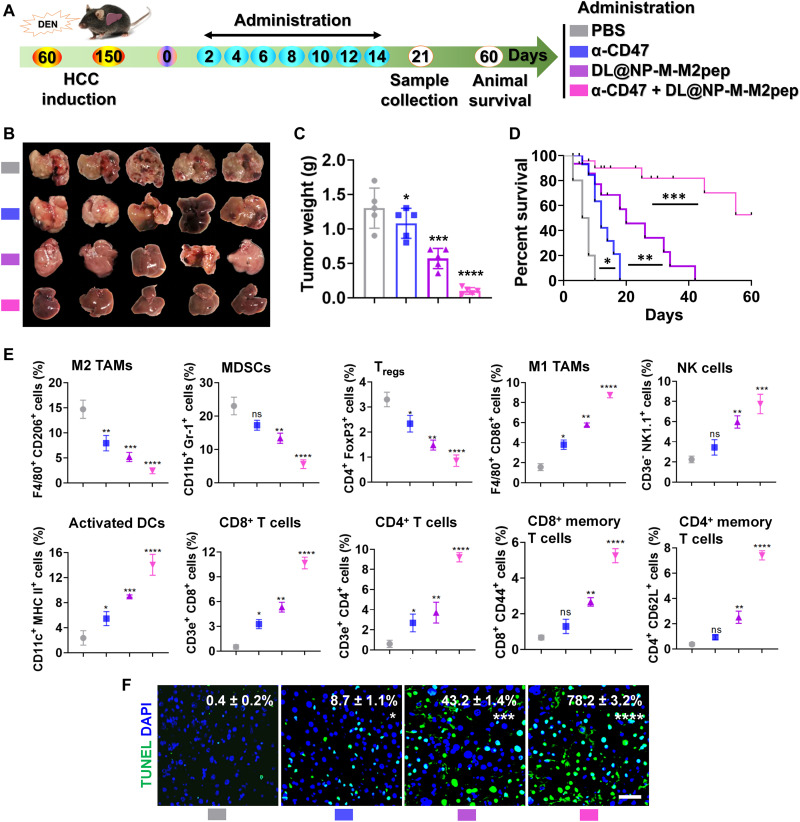
The polarization of tumor-associated macrophages (TAMs) from M2 to M1 phenotype demonstrates great potential for remodeling the immunosuppressive tumor microenvironment (TME) of hepatocellular carcinoma (HCC). d-lactate (DL; a gut microbiome metabolite) acts as an endogenous immunomodulatory agent that enhances Kupffer cells for clearance of pathogens. In this study, the potential of DL for transformation of M2 TAMs to M1 was confirmed, and the mechanisms underlying such polarization were mainly due to the modulation of phosphatidylinositol 3-kinase/protein kinase B pathway. A poly(lactide-co-glycolide) nanoparticle (NP) was used to load DL, and the DL-loaded NP was modified with HCC membrane and M2 macrophage-binding peptide (M2pep), forming a nanoformulation (DL@NP-M-M2pep). DL@NP-M-M2pep transformed M2 TAMs to M1 and remodeled the immunosuppressive TME in HCC mice, promoting the efficacy of anti-CD47 antibody for long-term animal survival. These findings reveal a potential TAM modulatory function of DL and provide a combinatorial strategy for HCC immunotherapy.


Figures

Fig. 1.
Fig. 1.. DL modulates TAMs and remodels the immunosuppressive TME for HCC.
(A) The proposed mechanisms of DL-mediated TAM modulation. (B) Delivery of DL using a targeted biomimetic PLGA NP achieves immunotherapy in combination with anti-CD47 antibody (α-CD47).
Fig. 2.
Fig. 2.. DL regulates the polarization of M2 macrophages to M1 ones.
(A) Chemical structure of DL. (B) The regulation of M1- and M2-associated genes in IL-4–stimulated bone marrow (BM)–derived macrophages (BMDMs) (M2 macrophages) with the treatment of phosphate-buffered saline (PBS) or DL (50 mM) was shown in the hierarchical cluster heatmap. (C) Quantitative reverse transcription polymerase chain reaction (RT-PCR) was performed to examine the mRNA expression in DL-treated M2 macrophages (n = 3; *P < 0.05, **P < 0.01, and ****P < 0.0001 to PBS). (D) Phenotypic change in M2 macrophages treated with PBS or DL was analyzed using flow cytometry (F4/80+ CD86+ for M1 and F4/80+ CD206+ for M2) (n = 3; ***P < 0.001 and ****P < 0.0001 to PBS). (E) The morphology of interferon-γ (IFN-γ) and lipopolysaccharide (LPS) costimulated BMDMs (M1 macrophages), M2 macrophages, and DL (50 mM)–treated M2 macrophages.
Fig. 3.
Fig. 3.. DL induces the polarization of M2 macrophages to M1 ones by inhibiting the PI3K/Akt pathway and activating the NF-κB pathway.
(A) Gene Ontology (GO) classification of expressed genes in DL (50 mM)–treated M2 macrophages. MAPK, mitogen-activated protein kinase. VEGF, vascular endothelial growth factor; ABC, adenosine 5′-triphosphate–binding cassette; HIF-1, hypoxia-inducible factor 1; ECM, extracellular matrix; cAMP, adenosine 3′,5′-monophosphate; AMPK, adenosine 5'-monophosphate-activated protein kinase; CGMP-PKG, cyclic guanosine monophosphate-protein kinase G; mTOR, mammalian target of rapamycin. (B) Signaling pathway enrichment analysis of Kyoto Encyclopedia of Genes and Genomes (KEGG) in DL (50 mmol)–treated M2 macrophages. (C) The up-regulated (red dots) and down-regulated (green dots) genes associated with the PI3K/Akt signaling pathway in DL (50 mM)–treated M2 macrophages were presented using the volcano plot. JAK-STAT, Janus kinase–signal transducer and activator of transcription; EGFR, epidermal growth factor receptor; AGE, advanced glycation end product. (D) The activity of PI3K/Akt and NF-κB signaling pathways in PBS- or DL (50 mM)–treated M2 macrophages was analyzed using Western blot assay. The quantification was shown in fig. S1. GAPDH, glyceraldehyde-3-phosphate dehydrogenase. (E) The binding of DL to macrophage surface receptors (TLR2 indicated in green; TLR9 indicated in blue) was analyzed using molecular docking technique. (F) After blocking TLR2/TLR9, the expression of PI3K and NF-κB in PBS- and DL (50 mM)–treated M2 macrophages was analyzed using Western blot assay. The quantification was shown in fig. S2. (G) The schematic of signaling pathways associated with DL-induced macrophage polarization from M2 to M1.
Fig. 4.
Fig. 4.. Preparation and physicochemical characterization of DL@NP-M-M2pep.
(A) Formulation schematic of DL@NP-M-M2pep. (B) TEM images of DL@NP and DL@NP-M-M2pep. (C) The size and PDI of DL@NP and DL@NP-M-M2pep (n = 3). (D) The charge of DL@NP and DL@NP-M-M2pep (n = 3). (E) The change in size and charge of DL@NP-M-M2pep incubated in PBS over 1 week (n = 3). (F) The in vitro DL release from DL@NP-M-M2pep when incubated in release medium (pH 5.5 and 7.4) (n = 3; ***P < 0.001).
Fig. 5.
Fig. 5.. DL@NP-M-M2pep induces the polarization of M2 macrophages to M1 ones.
(A) Cellular uptake of rhodamine-labeled DL@NP-M and DL@NP-M-M2pep (50 mM DL, same as below) was assessed using flow cytometry (n = 3; ***P < 0.001 and ****P < 0.0001). (B) The activity of PI3K/Akt and NF-κB pathways in M2 macrophages treated with PBS, DL@NP-M, and DL@NP-M-M2pep was analyzed using Western blot assay. The quantification was shown in fig. S5. (C) Quantitative RT-PCR was performed to examine the mRNA expression of M2-associated genes in M2 macrophages treated with PBS, DL@NP-M, and DL@NP-M-M2pep (n = 4; *P < 0.05, **P < 0.01, and ***P < 0.001 to PBS). (D) Quantitative RT-PCR was performed to examine the mRNA expression of M1-associated genes in M2 macrophages treated with PBS, DL@NP-M, and DL@NP-M-M2pep (n = 4; *P < 0.05, **P < 0.01, and ***P < 0.001 to PBS).
Fig. 6.
Fig. 6.. Toxicity, half-life, and biodistribution of DL@NP-M-M2pep.
(A) Body weight of healthy mice within a 30-day period following intravenous treatments (n = 6). (B) Major organs were assessed using hematoxylin and eosin staining assay on day 30 following intravenous treatments (scale bar, 100 μm). (C) The blood analysis for the liver/kidney functions including alanine aminotransferase (ALT), alanine aminotransferase (AST), blood urea nitrogen (BUN), and creatinine (CRE) was determined on day 30 following the treatments (n = 6). (D) The curve of injected drug concentration (ID %) versus time point was plotted in Hepa1-6-luc–derived orthotopic HCC mice (n = 4; ***P < 0.001). (E) Biodistribution of DiR-labeled nanoformulations in major organs and liver tumors at 24 hours after intravenous injection in Hepa1-6-luc–derived orthotopic HCC mice (n = 4; *P < 0.05, **P < 0.01, and ****P < 0.0001; ns, not significant). (F) Following the biodistribution as described above, the level of rhodamine-labeled DL@NP-M-M2pep inside M1 and M2 TAMs was detected in tumors using immunofluorescent staining assay (blue, cell nucleus; green, CD86+ or CD206+ cells; and red, rhodamine) (scale bars, 100 μm; n = 3; ***P < 0.001). DAPI, 4′,6-diamidino-2-phenylindole.
Fig. 7.
Fig. 7.. DL@NP-M-M2pep achieves antitumor effects by polarizing TAMs from M2 to M1 in Hepa1-6-luc–derived orthotopic HCC mice.
(A) Tumor inoculation and treatment scheme. (B) The representative images of animals with different treatments. (C) The HCC development over a 21-day period (n = 6). (D) Animal survival (n = 10). (E) The M2 and M1 TAMs were detected using immunofluorescent staining assay (scale bars, 100 μm; n = 4). (F) Flow cytometric analysis of M2 and M1 TAMs (fig. S8) (n = 4) (*P < 0.05, **P < 0.01, ***P < 0.001, ****P < 0.0001, and ns to PBS).
Fig. 8.
Fig. 8.. DL@NP-M-M2pep remodels the immunosuppressive TME in Hepa1-6-luc–derived orthotopic HCC.
(A) The immunosuppressive cells such as MDSCs and Tregs in tumors (fig. S9). The immunostimulatory cells as NK cells, activated DCs, and effector T cells in tumors (figs. S10 to S13) (n = 4). (B) The expression of immunosuppressive cytokines (IL-10, TGF-β, and IL-4) in tumors was measured using enzyme-linked immunosorbent assay (ELISA) (n = 4). (C) The expression of immunostimulatory cytokines (IFN-γ, TNF-α, and IL-12) in tumors was measured using ELISA (n = 4). (D) The average number of apoptotic cells per high-power field was detected by terminal deoxynucleotidyl transferase–mediated deoxyuridine triphosphate nick end labeling (TUNEL) and analyzed by ImageJ. (scale bar, 50 μm; n = 3) (*P < 0.05, **P < 0.01, ***P < 0.001, ****P < 0.0001, and ns to PBS).
Fig. 9.
Fig. 9.. The combination of anti-CD47 antibody and DL@NP-M-M2pep promotes antitumor efficacy in carcinogen-induced orthotopic HCC mice.
(A) Tumor induction and treatment scheme. (B) The representative images of HCC with different treatments. (C) Tumor weight after subtracting liver weight of healthy mice (n = 5). (D) Animal survival (n = 10). (E) Flow cytometric analysis of immune cells (n = 5) (figs. S14 to S19). MHC, major histocompatibility complex. (F) The average number of apoptotic cells per high-power field was detected by TUNEL staining and analyzed by ImageJ (scale bar, 50 μm; n = 3) (*P < 0.05, **P < 0.01, ***P < 0.001, ****P < 0.0001, and ns to PBS).

References

    1. H. Sung, J. Ferlay, R. L. Siegel, M. Laversanne, I. Soerjomataram, A. Jemal, F. Bray, Global cancer statistics 2020: GLOBOCAN estimates of incidence and mortality worldwide for 36 cancers in 185 countries. CA Cancer J. Clin. 71, 209–249 (2021). - PubMed
    1. P. J. Trivedi, D. H. Adams, Gut-liver immunity. J. Hepatol. 64, 1187–1189 (2016). - PubMed
    1. F. Heymann, F. Tacke, Immunology in the liver—From homeostasis to disease. Nat. Rev. Gastroenterol. Hepatol. 13, 88–110 (2016). - PubMed
    1. C. N. Jenne, P. Kubes, Immune surveillance by the liver. Nat. Immunol. 14, 996–1006 (2013). - PubMed
    1. Y. Yang, J. Guo, L. Huang, Tackling TAMs for cancer immunotherapy: It’s nano time. Trends Pharmacol. Sci. 41, 701–714 (2020). - PMC - PubMed

Publication types