

Fully printed and self-compensated bioresorbable electrochemical devices based on galvanic coupling for continuous glucose monitoring
- PMID: 37467335
- PMCID: PMC10355816
- DOI: 10.1126/sciadv.adi3839
Fully printed and self-compensated bioresorbable electrochemical devices based on galvanic coupling for continuous glucose monitoring
Abstract
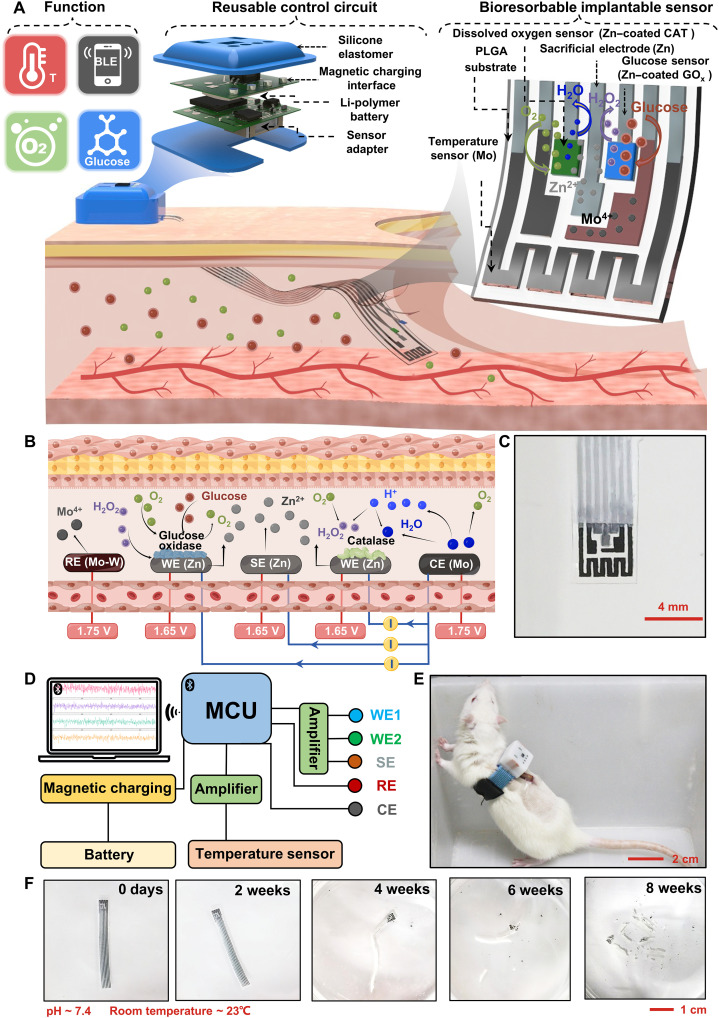
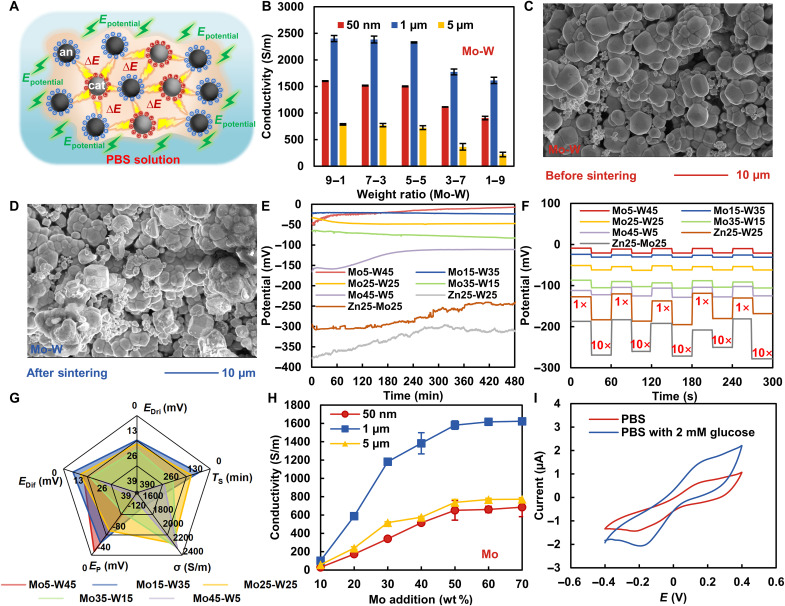
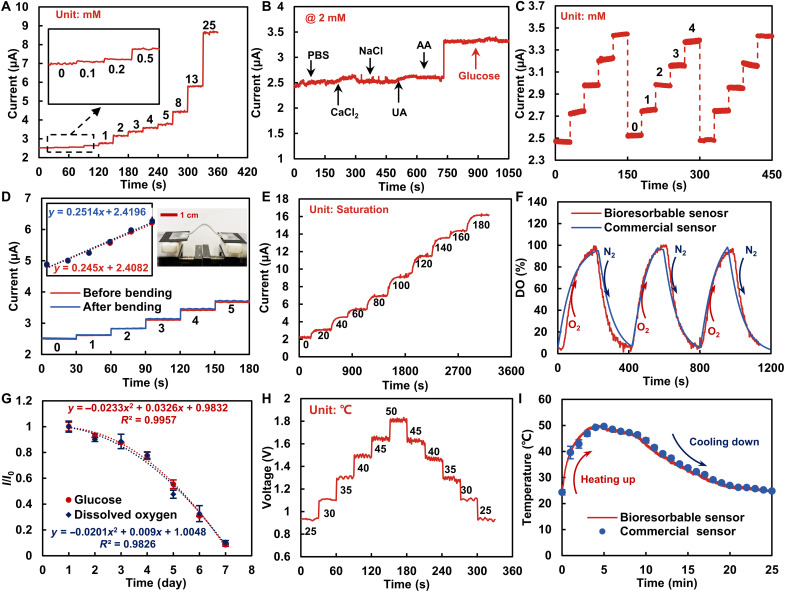
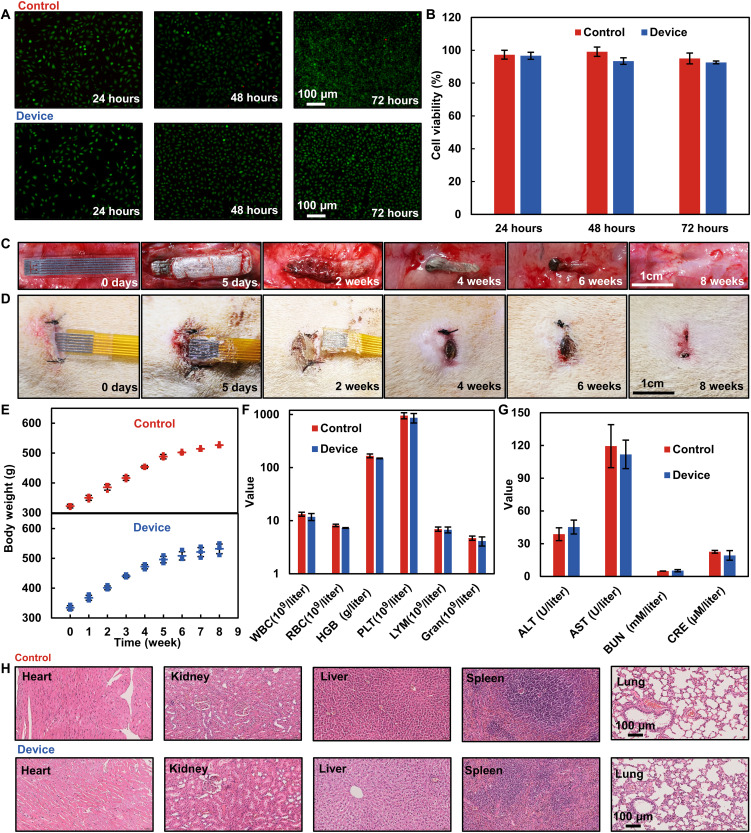
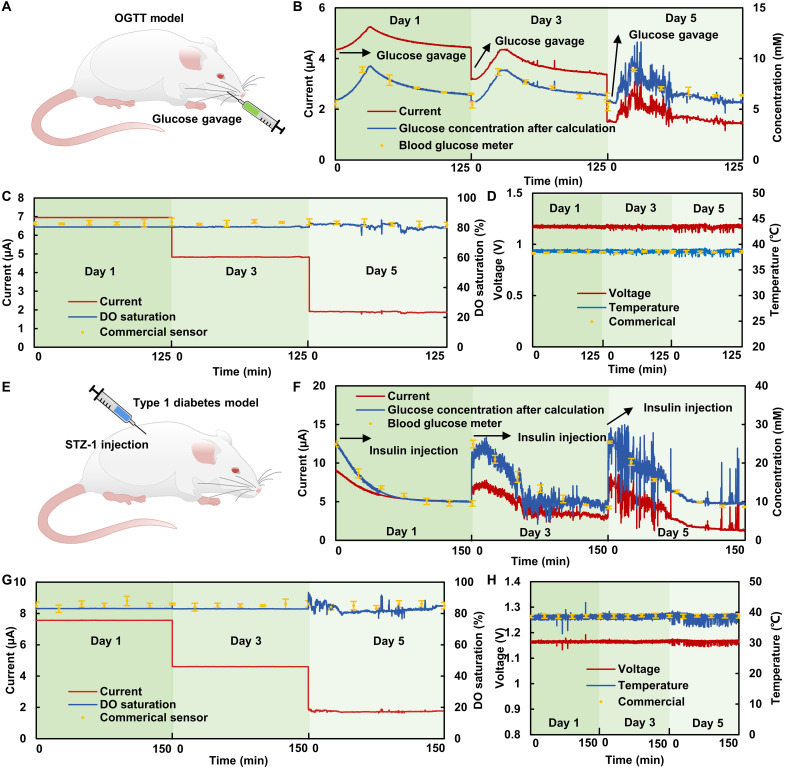
Real-time glucose monitoring conventionally involves non-bioresorbable semi-implantable glucose sensors, causing infection and pain during removal. Despite bioresorbable electronics serves as excellent alternatives, the bioresorbable sensor dissolves in aqueous environments with interferential biomolecules. Here, the theories to achieve stable electrode potential and accurate electrochemical detection using bioresorbable materials have been proposed, resulting in a fully printed bioresorbable electrochemical device. The adverse effect caused by material degradation has been overcome by a molybdenum-tungsten reference electrode that offers stable potential through galvanic-coupling and self-compensation modules. In vitro and in vivo glucose monitoring has been conducted for 7 and 5 days, respectively, followed by full degradation within 2 months. The device offers a glucose detection range of 0 to 25 millimolars and a sensitivity of 0.2458 microamperes per millimolar with anti-interference capability and biocompatibility, indicating the possibility of mass manufacturing high-performance bioresorbable electrochemical devices using printing and low-temperature water-sintering techniques. The mechanisms may be implemented developing more comprehensive bioresorbable sensors for chronic diseases.
Figures
Similar articles
-
Advanced Materials and Devices for Bioresorbable Electronics.Acc Chem Res. 2018 May 15;51(5):988-998. doi: 10.1021/acs.accounts.7b00548. Epub 2018 Apr 17. Acc Chem Res. 2018. PMID: 29664613
-
Real-time glucose monitoring system containing enzymatic sensor and enzymatic reference electrodes.Biosens Bioelectron. 2020 Sep 15;164:112338. doi: 10.1016/j.bios.2020.112338. Epub 2020 May 30. Biosens Bioelectron. 2020. PMID: 32553347
-
Materials, Processes, and Facile Manufacturing for Bioresorbable Electronics: A Review.Adv Mater. 2018 Jul;30(28):e1707624. doi: 10.1002/adma.201707624. Epub 2018 May 7. Adv Mater. 2018. PMID: 29736971 Review.
-
A Bioresorbable Dynamic Pressure Sensor for Cardiovascular Postoperative Care.Adv Mater. 2021 Oct;33(39):e2102302. doi: 10.1002/adma.202102302. Epub 2021 Aug 8. Adv Mater. 2021. PMID: 34369023
-
Bioresorbable Electronic Implants: History, Materials, Fabrication, Devices, and Clinical Applications.Adv Healthc Mater. 2019 Jun;8(11):e1801660. doi: 10.1002/adhm.201801660. Epub 2019 Apr 8. Adv Healthc Mater. 2019. PMID: 30957984 Review.
Cited by
-
A wearable device for continuous immunoassay-based monitoring of C-peptide in interstitial fluid.Sci Adv. 2025 Jul 18;11(29):eadw2182. doi: 10.1126/sciadv.adw2182. Epub 2025 Jul 18. Sci Adv. 2025. PMID: 40680118 Free PMC article.
-
Pressure-constrained sonication activation of flexible printed metal circuit.Nat Commun. 2024 Sep 27;15(1):8324. doi: 10.1038/s41467-024-52873-7. Nat Commun. 2024. PMID: 39333109 Free PMC article.
-
Gut-targeted therapies for type 2 diabetes mellitus: A review.World J Clin Cases. 2024 Jan 6;12(1):1-8. doi: 10.12998/wjcc.v12.i1.1. World J Clin Cases. 2024. PMID: 38292634 Free PMC article. Review.
-
In vivo and in situ monitoring of doxorubicin pharmacokinetics with an implantable bioresorbable optical sensor.Sci Adv. 2025 Apr 18;11(16):eads0265. doi: 10.1126/sciadv.ads0265. Epub 2025 Apr 16. Sci Adv. 2025. PMID: 40238874 Free PMC article.
-
Millimeter-scale magnetic implants paired with a fully integrated wearable device for wireless biophysical and biochemical sensing.Sci Adv. 2024 Mar 22;10(12):eadm9314. doi: 10.1126/sciadv.adm9314. Epub 2024 Mar 20. Sci Adv. 2024. PMID: 38507494 Free PMC article.
References
-
- X. Xie, J. C. Doloff, V. Yesilyurt, A. Sadraei, J. J. McGarrigle, M. Omami, O. Veiseh, S. Farah, D. Isa, S. Ghani, I. Joshi, A. Vegas, J. Li, W. Wang, A. Bader, H. H. Tam, J. Tao, H.-J. Chen, B. Yang, K. A. Williamson, J. Oberholzer, R. Langer, D. G. Anderson, Reduction of measurement noise in a continuous glucose monitor by coating the sensor with a zwitterionic polymer. Nat. Biomed. Eng. 2, 894–906 (2018). - PMC - PubMed
-
- G. Slaughter, T. Kulkarni, Detection of human plasma glucose using a self-powered glucose biosensor. Energies 12, 825 (2019).
-
- World Health Organization, “World Health Organization Global Report on Diabetes”ISBN 9789241565257 (World Health Organization, 2016).
Publication types
MeSH terms
Substances
LinkOut - more resources
Full Text Sources
Medical
