. 2023 Aug 3;66(8):2950-2966.
doi: 10.1044/2023_JSLHR-23-00013. Epub 2023 Jul 19.

Descriptive Characterization of High-Frequency Distortion Product Otoacoustic Emission Source Components in Children

Affiliations

Descriptive Characterization of High-Frequency Distortion Product Otoacoustic Emission Source Components in Children

Laura Dreisbach et al. J Speech Lang Hear Res. .

Abstract

Purpose: Distortion product otoacoustic emissions (DPOAEs) provide an objective assessment of cochlear function and are used for serial ototoxicity monitoring in pediatric cancer patients. DPOAEs are modeled as having distortion (near f2) and reflection (near 2f1-f2) component sources, and developmental changes are observed in these components' relative strengths in infants compared with adults. However, little is known about source component strengths in childhood or at extended high frequencies (EHFs; > 8 kHz). Thus, the purpose of this study was to describe the effects of age and stimulus frequency on DPOAE components in children.

Method: DPOAEs were collected with varied frequency ratios (f2/f1 = 1.1-1.25) for a wide range of frequencies (2-16 kHz) in 39 younger (3-6 years) and 41 older (10-12 years) children with constant levels (L1/L2) of 65/50 dB SPL. A depth-compensated simulator sound pressure level method of calibration was employed. A time waveform representation of the results across various ratios was created to estimate peak pressures and latencies of each DPOAE component.

Results: Estimated peak pressures of DPOAE components revealed the greatest differences in DPOAE sources between children occurring at the highest frequencies tested, where the peak pressure of both components was largest for younger compared with older children. Latency differences between the children were only noted at higher frequencies for the distortion component.

Conclusions: These results suggest that DPOAE levels decrease with age and reflection emissions are vulnerable to cochlear change. This work guides optimization of protocols for pediatric ototoxicity monitoring, whereby including EHF otoacoustic emissions is clearly warranted and choosing to isolate DPOAE sources may prove beneficial.

Supplemental material: https://doi.org/10.23641/asha.23669214.


Figures

Figure 1.
Figure 1.
Distortion product otoacoustic emission (DPOAE) level and phase plotted across varied DPOAE frequencies (bottom x-axis) and frequency ratios (top x-axis). Mean DPOAE level (top row) and phase (bottom row) are represented by the solid black lines plotted for an f2 of 14 kHz with f1 varied from 1.1 to 1.25 for young children (YC, left column), older children (OC, middle column), and young adults (YA, right column). Spread of the data is indicated by the vertical bars (± 1 SD) for each mean value and the dashed line in the top row represents the average noise floor.
Figure 2.
Figure 2.
Pressure of the Inverse Fast Fourier Transform as a function of derived time for an individual from each participant group. Multiple peaks in the envelope represent multiple group delay components extracted from ratio sweep data. Rows indicate the different extended high frequencies tested with f2 = 16 kHz in the top row, followed by 14 and 12 kHz in the middle rows, and 10 kHz in the bottom row for an individual young child (YC, left column), older child (OC, middle column), and young adult (YA, right column). YAs did not have enough data points at f2 = 16 kHz to derive an analytic waveform. The leftmost circle in each plot represents the chosen distortion component peak, whereas the rightmost circle represents the reflection component peak.
Figure 3.
Figure 3.
Same as Figure 2 except for conventional frequencies with an f2 of 8, 4, and 2 kHz in the top, middle, and bottom row, respectively. Young children were not tested at conventional frequencies. OC = older children; YA = young adults.
Figure 4.
Figure 4.
Mean (solid symbols) and individual data (open symbols) are shown for the distortion product otoacoustic emission distortion (left panel) and reflection (right panel) component peak pressures across frequency. Black circles, gray squares, and dark-gray diamonds represent data from young children (YC), older children (OC), and young adults (YA), respectively. YC only are tested at the extended high frequencies and YA did not have sufficient data at 16 kHz for evaluation. Significant differences determined from contrast analyses are indicated with gray asterisks.
Figure 5.
Figure 5.
Mean (solid symbols) and individual data (open symbols) are shown for the log of the distortion/reflection component peak pressures across frequency. Black circles, gray squares, and dark-gray diamonds represent data from young children (YC), older children (OC), and young adults (YA), respectively. Only OC and YA were tested at the conventional frequencies. Higher values indicate a greater distortion component compared with the reflection component in the composite distortion product otoacoustic emission. Significant differences determined from contrast analyses are indicated with gray asterisks.
Figure 6.
Figure 6.
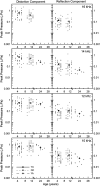
Mean (solid symbols) and individual data (open symbols) are shown for the distortion product otoacoustic emission distortion (left panels) and reflection (right panels) component peak pressures across age. Rows indicate the different extended high frequencies tested with f2 = 16 kHz in the top row, followed by 14 and 12 kHz in the middle rows, and 10 kHz in the bottom row. Black circles, gray squares, and dark-gray diamonds represent data from young children (YC), older children (OC), and young adults (YA), respectively. YA did not have sufficient data at 16 kHz for evaluation.
Figure 7.
Figure 7.
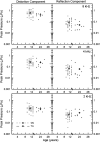
Same as Figure 6 except for conventional frequencies with an f2 of 8, 4, and 2 kHz in the top, middle, and bottom row, respectively. Young children were not tested at conventional frequencies. OC = older children; YA = young adults.
Figure 8.
Figure 8.
Mean (solid symbols) and individual data (open symbols) are shown for peak latency of the distortion (left panel) and reflection (right panel) component across frequency. Black circles, gray squares, and dark-gray diamonds represent data from young children (YC), older children (OC), and young adults (YA), respectively. Significant differences determined from contrast analyses are indicated with gray asterisks.
Figure 9.
Figure 9.
Mean air-conduction behavioral thresholds measured in SPL for older children (OC; gray squares) and young adults (YA; dark-gray diamonds) are plotted from 1 through 16 kHz. Data are offset for better visualization. Spread of the data is indicated by the vertical bars (± 1 SD) for each mean value. Audiogram data were not obtained for young children. Significant differences determined from contrast analyses are indicated with gray asterisks.

References

    1. Abdala, C., & Dhar, S. (2010). Distortion product otoacoustic emission phase and component analysis in human newborns. The Journal of the Acoustical Society of America, 127(1), 316–325. 10.1121/1.3268611 - DOI - PMC - PubMed
    1. Abdala, C., & Dhar, S. (2012). Maturation and aging of the human cochlea: A view through the DPOAE looking glass. Journal of the Association for Research in Otolaryngology, 13(3), 403–421. 10.1007/s10162-012-0319-2 - DOI - PMC - PubMed
    1. Abdala, C., Luo, P., & Shera, C. A. (2015). Optimizing swept-tone protocols for recording distortion-product otoacoustic emissions in adults and newborns. The Journal of the Acoustical Society of America, 138(6), 3785–3799. 10.1121/1.4937611 - DOI - PMC - PubMed
    1. Abdala, C., Luo, P., & Shera, C. A. (2022). Characterizing the relationship between reflection and distortion otoacoustic emissions in normal-hearing adults. Journal of the Association for Research in Otolaryngology, 23(5), 647–664. 10.1007/s10162-022-00857-z - DOI - PMC - PubMed
    1. Brown, A. M., & Gaskill, S. A. (1990). Measurement of acoustic distortion reveals underlying similarities between human and rodent mechanical responses. The Journal of the Acoustical Society of America, 88(2), 840–849. 10.1121/1.399733 - DOI - PubMed

Publication types

LinkOut - more resources