. 2023 Dec 1;146(12):5153-5167.
doi: 10.1093/brain/awad245.

SCN1A-deficient excitatory neuronal networks display mutation-specific phenotypes

Affiliations

SCN1A-deficient excitatory neuronal networks display mutation-specific phenotypes

Eline J H van Hugte et al. Brain. .

Abstract

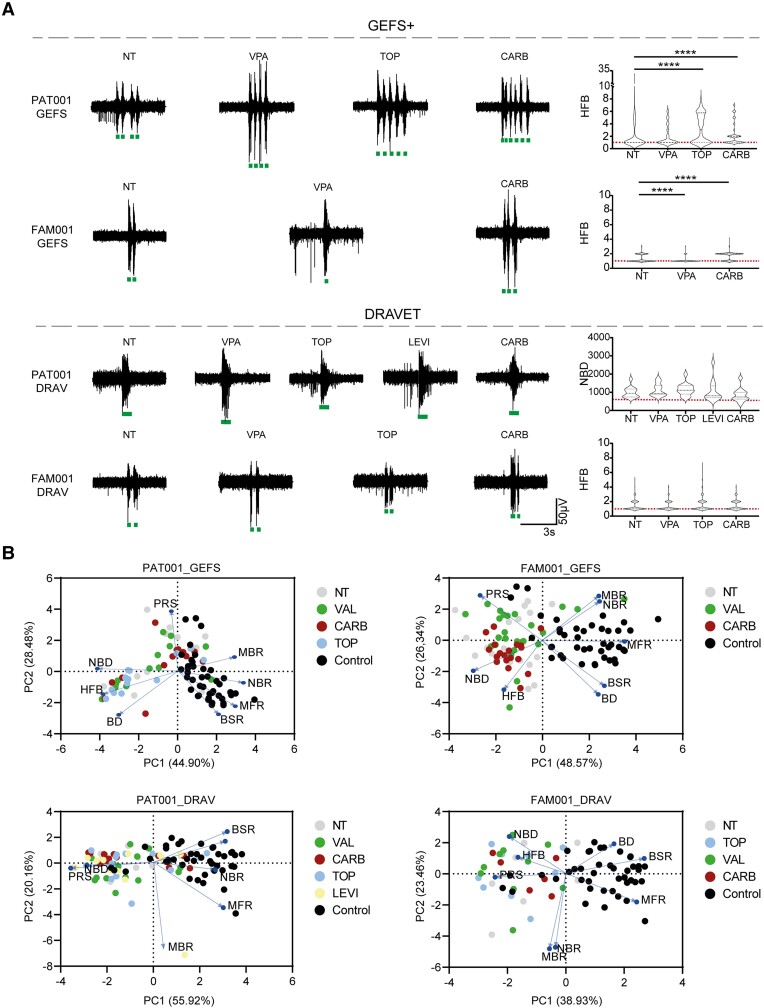
Dravet syndrome is a severe epileptic encephalopathy, characterized by (febrile) seizures, behavioural problems and developmental delay. Eighty per cent of patients with Dravet syndrome have a mutation in SCN1A, encoding Nav1.1. Milder clinical phenotypes, such as GEFS+ (generalized epilepsy with febrile seizures plus), can also arise from SCN1A mutations. Predicting the clinical phenotypic outcome based on the type of mutation remains challenging, even when the same mutation is inherited within one family. This clinical and genetic heterogeneity adds to the difficulties of predicting disease progression and tailoring the prescription of anti-seizure medication. Understanding the neuropathology of different SCN1A mutations may help to predict the expected clinical phenotypes and inform the selection of best-fit treatments. Initially, the loss of Na+-current in inhibitory neurons was recognized specifically to result in disinhibition and consequently seizure generation. However, the extent to which excitatory neurons contribute to the pathophysiology is currently debated and might depend on the patient clinical phenotype or the specific SCN1A mutation. To examine the genotype-phenotype correlations of SCN1A mutations in relation to excitatory neurons, we investigated a panel of patient-derived excitatory neuronal networks differentiated on multi-electrode arrays. We included patients with different clinical phenotypes, harbouring various SCN1A mutations, along with a family in which the same mutation led to febrile seizures, GEFS+ or Dravet syndrome. We hitherto describe a previously unidentified functional excitatory neuronal network phenotype in the context of epilepsy, which corresponds to seizurogenic network prediction patterns elicited by proconvulsive compounds. We found that excitatory neuronal networks were affected differently, depending on the type of SCN1A mutation, but did not segregate according to clinical severity. Specifically, loss-of-function mutations could be distinguished from missense mutations, and mutations in the pore domain could be distinguished from mutations in the voltage sensing domain. Furthermore, all patients showed aggravated neuronal network responses at febrile temperatures compared with controls. Finally, retrospective drug screening revealed that anti-seizure medication affected GEFS+ patient- but not Dravet patient-derived neuronal networks in a patient-specific and clinically relevant manner. In conclusion, our results indicate a mutation-specific excitatory neuronal network phenotype, which recapitulates the foremost clinically relevant features, providing future opportunities for precision therapies.

Keywords: Dravet syndrome; MEA; epilepsy; hiPSC.


Conflict of interest statement

The authors report no competing interests.

Figures

Figure 1
Figure 1
Seizure liability screening reveals two distinctive seizure prediction patterns. (A) Schematic overview of a multi-electrode array (MEA) culture, raw recording from a representative electrode and raster plot, including the measured MEA parameters on both single channel and network levels. Scale bar = 100 µm (B) Representative raster plots of MEA recordings from control networks and control networks acutely treated with different compounds: NMDA (100 µM), 4-aminopyridine (4-AP,10 µM), kainic acid (KA, 10 µM), linopirdine (Lino, 1.5 µM) and phenytoin (Pheny, 25 µM) with an 8 s closer view (right) of the activity of one electrode. Quantification of network parameters normalized to pretreatment baseline including: (C) mean firing rate (MFR), (D) percentage of random spikes (PRS), (E) mean burst rate (MBR), (F) burst duration (BD), (G) network burst rate (NBR), (H) network burst duration (NBD) and (I) number of high frequency bursts (HFB). (J) Heat map of all MEA parameters for all compound-treated recordings, normalized to pretreatment baseline, including MFR, MBR, NBR, PRS, BD, NBD, HFB, burst spike rate (BSR), inter-burst interval (IBI) and network inter-burst interval (NIBI). For all MEA data, NMDA n = 7, KA n = 8, 4-AP n = 8, Lino n = 8 and Pheny n = 10 (number of pre-and post-treatment wells). All wells were derived from CTRL2. *P = 0.05, **P = 0.01, ***P = 0.001, ****P < 0.0001; repeated measures ANOVA with Dunn–Šidák multiple comparisons correction. All means, SEM and test statistics are listed in Table 1.
Figure 2
Figure 2
SCN1A +/−-deficient neurons depict hyperactive, desynchronized and irregular firing patterns. (A) Representative raster plots of MEA recordings at DIV49 from control and SCN1A+/−-deficient neuronal networks, with a 6 s closer view (right) of the activity of one electrode. (B) Quantification of network parameters, including percentage of random spikes (PRS), mean burst rate (MBR), network burst rate (NBR) and number of high frequency bursts (HFB), quantified as the number of HFBs inside an NB period. Dashed line represents median, dotted line represents quartiles. Mann–Whitney test. (C) PCA plot of eight MEA parameters, including mean firing rate (MFR), MBR, NBR, PRS, burst duration (BD), NBD, HFB, burst spike rate (BSR), showing parameters that explain the differences in network behaviour between control and SCN1A+/−-deficient neuronal networks. Blue arrows indicate loadings. For all MEA data, n = number of wells/independent differentiations: control n = 33/5 (CTRL2) and SCN1A+/−n = 24/2 (SCN1A+/− C3: 8/2, SCN1A+/− C7:16/2). (D) Representative Na+-current traces of control and SCN1A+/−-deficient neurons at DIV49. Stimulation paradigm (inset): stepwise protocol from a −90 mV holding potential to a maximum test-pulse of 60 mV in increments of 10 mV, Na+-currents were tetrodotoxin (TTX)-sensitive. (E) Current-density plot of Na+-current recordings from n = cells/batches Control n = 18/3 (CTRL2) and SCN1A+/−n = 22/3 (SCN1A+/− C3: 11/3, SCN1A+/− C7:11/3). Repeated measures ANOVA with Dunnett’s multiple comparisons test. (F) Representative firing patterns of control and SCN1A+/− neurons, measured by a step-wise current injection protocol. (G) Analysis of active and passive membrane properties, including peak amplitude, threshold, half-width, after hyper polarization time (AHP), ΔAHP, defined as the difference between the AHP of the first action potential and the second action potential in the same sweep, rise slope, rise time, maximum rise slope, decay slope, decay time, max decay slope, rheobase. (H) Quantification of the number of action potentials per current injection in a 2-s time window. (I) Representative plots depicting control action potential amplitude and time course, dV/dt versus time and a phase plot of dV/dt versus V. (J) Representative plots depicting SCN1A+/−-deficient action potential amplitude and time course, dV/dt versus time and a phase plot of dV/dt versus V. Red dotted line represents the action potential threshold. For all action potential properties, n = cells/independent differentiations: control n = 24/3 (CTRL2) and SCN1A+/−n = 39/3, (SCN1A+/− C3: 21/3, SCN1A+/− C7:18/3). Mann–Whitney test. Data represented as mean ± SEM. *P = 0.05, **P = 0.01, ***P = 0.001, ****P < 0.0001. All means, SEM and P-values of significant differences are listed in Supplementary Table 1. Data from separate SCN1A+/−-deficient lines are listed in Supplementary Table 2.
Figure 3
Figure 3
Dravet syndrome patient-derived neuronal networks show mutation-specific network fingerprints. (A) Schematic overview of patient inclusion, including pedigree of one family, where the same SCN1A mutation is inherited via the paternal line. Filled black symbol represents Dravet syndrome (DS), three quarters black symbol represents GEFS+ syndrome, one quarter black symbol represents febrile seizures (FS). (B) Overview of affected locations in the Nav1.1 protein. (C) Representative raster plots of multi-electrode array (MEA) recordings from control and patient-derived networks, with a 6 s closer view (right) of the activity of one electrode. (D) Quantification of network parameters, including percentage of random spikes (PRS), network burst rate (NBR), number of high frequency bursts (HFB) quantified as the number of HFBs inside a network burst period and network burst duration (NBD). Dashed line represents median, dotted line represents quartiles. (E) Heat map of all MEA parameters for all compound-treated recordings, normalized to pretreatment baseline, and all SCN1A -deficient lines normalized to control. Parameters include mean firing rate (MFR), mean burst rate (MBR), NBR, PRS, burst duration (BD), NBD, HFB, burst spike rate (BSR), inter-burst interval (IBI) and network inter-burst interval (NIBI). (F) PCA plot of eight MEA parameters, including MFR, MBR, NBR, PRS, BD, NBD, BSR and HFB, showing parameters that explain the differences in network behaviour between control and patient lines. Blue arrows indicate loadings. For all MEA data, n = number of wells/independent differentiations: CTRL1 n = 9/2, CTRL2 n = 36/5, PAT001_GEFS n = 22/4, PAT001_DRAV n = 33/6, FAM001_FS n = 9/2, FAM001_GEFS n = 11/3, FAM001_DRAV n = 11/3, SCN1A+/−n = 23/3; one way ANOVA with Kruskal–Wallis test with Dunn’s correction for multiple comparisons. *P = 0.05, **P = 0.01, ***P = 0.001, ****P < 0.0001. All means, SEM and P-values of significant differences are listed in Supplementary Table 1.
Figure 4
Figure 4
Febrile temperatures lead to altered neuronal network organization. (A) Schematic stimulation paradigm for febrile temperature recordings. (B) Representative raster plots from multi-electrode array (MEA) recordings of control neuronal networks, recorded at 37°C and 40°C. (C) Network burst rate (NBR) from control neuronal networks, normalized to the basal recording at 37°C. Data is shown as mean ± SEM. Repeated measures ANOVA with Friedmans correction for multiple testing. (D) Representative burst shapes of control and patient lines green lines indicate high frequency burst (HFB) detection. (E) Number of HFB, quantified as the number of HFBs inside a network burst period, during basal (37°C), febrile (40°C) and recovery (37°C) recordings. Dashed line represents median, dotted line represents quartiles, Kruskall–Wallis test. (F) Representative raster plots from MEA recordings of control and patient neuronal networks, recorded at 37°C and 40°C. (G) NBR from control and patient neuronal networks, normalized to the basal recording at 37°C. Data are shown as mean ± SEM, Kruskall–Wallis test. (H) NBR from control and PAT001_DRAV neuronal networks over developmental days in vitro (DIV), normalized to the basal recording at 37°C, two-way ANOVA. For all MEA data, n = number of wells/independent differentiations: control n = 20/3 (CTRL2), PAT001_GEFS n = 12/2, PAT001_DRAV n = 22/3 FAM001_FS n = 5/1, FAM001_GEFS n = 9/2, FAM001_DRAV n = 8/2, all data were recorded at DIV49. *P = 0.05, **P = 0.01, ***P = 0.001, ****P < 0.0001. All means, SEM and P-values of significant differences are listed in Supplementary Table 1.
Figure 5
Figure 5
GEFS+, but not Dravet syndrome-derived neuronal networks, respond to anti-seizure medication. (A) Representative burst traces of GEFS+ patients (top) and Dravet syndrome (DS) patients (bottom), including quantification of number of high frequency bursts (HFB) for PAT001_GEFS, FAM001_GEFS and FAM001_DRAV lines, and network burst duration (NBD) for PAT001_DRAV in non-treated (NT) patients or those treated with 10 µM topiramate (TOP), valproic acid (VPA), levetiracetam (LEVI) or carbamazepine (CARB). HFB quantification for PAT001_DRAV was not included, since this line does not show HFB. Dashed line represents median, dotted line represents quartiles. Red dashed line represents control median. (B) Principal component analysis (PCA) plot of eight multi-electrode array (MEA) parameters, including mean firing rate (MFR), mean burst rate (MBR), network burst rate (NBR), percentage of random spikes (PRS), burst duration (BD), NBD, burst spike rate (BSR) and HFB, showing parameters that explain the differences in network behaviour between control and patient lines, in either non-treated patients or those treated with anti-seizure medication. Blue arrows indicate loadings. For all MEA data, n = number of wells/independent differentiations: PAT001_GEFSNTn = 13/5, PAT001_GEFSVALn = 13/5, PAT001_GEFSTOPn = 13/5, PAT001_GEFSCARBn = 13/5, PAT001_DRAVNTn = 13/5, PAT001_DRAVVALn = 15/5, PAT001_DRAVTOPn = 14/6, PAT001_DRAVLEVIn = 12/5, PAT001_DRAVCARBn = 13/4, FAM001_GEFSNTn = 18/6, FAM001_GEFSVALn = 24/6, FAM001_GEFSCARBn = 19/4, FAM001_DRAVNTn = 7/3, FAM001_DRAVTOPn = 9/3, FAM001_DRAVVALn = 10/3 FAM001_DRAVCARBn = 6/1. Significance calculated using ANOVA with Kruskal–Wallis test and Dunn’s correction for multiple comparisons. *P = 0.05, **P = 0.01, ***P = 0.001, ****P < 0.0001. All means, SEM and P-values of significant differences are listed in Supplementary Table 1.

References

    1. Dravet C. The core Dravet syndrome phenotype. Epilepsia. 2011;52:3–9. - PubMed
    1. Deprez L, Jansen A, De Jonghe P. Genetics of epilepsy syndromes starting in the first year of life. Neurology. 2009;72:273–281. - PubMed
    1. Wolff M, Cassé-Perrot C, Dravet C. Severe myoclonic epilepsy of infants (Dravet syndrome): natural history and neuropsychological findings. Epilepsia. 2006;47:45–48. - PubMed
    1. Jansen FE, Sadleir LG, Harkin LA, et al. Severe myoclonic epilepsy of infancy (Dravet syndrome): recognition and diagnosis in adults. Neurology. 2006;67:2224–2226. - PubMed
    1. Escayg A, Goldin AL. Sodium channel SCN1A and epilepsy: mutations and mechanisms. Epilepsia. 2010;51:1650–1658. - PMC - PubMed

Publication types

Substances