. 2023 Aug:258:21-35.
doi: 10.1016/j.schres.2023.06.004. Epub 2023 Jul 18.

Learning without contingencies: A loss of synergy between memory and reward circuits in schizophrenia

Affiliations

Learning without contingencies: A loss of synergy between memory and reward circuits in schizophrenia

Sazid M Hasan et al. Schizophr Res. 2023 Aug.

Abstract

Motivational deficits in schizophrenia may interact with foundational cognitive processes including learning and memory to induce impaired cognitive proficiency. If such a loss of synergy exists, it is likely to be underpinned by a loss of synchrony between the brains learning and reward sub-networks. Moreover, this loss should be observed even during tasks devoid of explicit reward contingencies given that such tasks are better models of real world performance than those with artificial contingencies. Here we applied undirected functional connectivity (uFC) analyses to fMRI data acquired while participants engaged in an associative learning task without contingencies or feedback. uFC was estimated and inter-group differences (between schizophrenia patients and controls, n = 54 total, n = 28 patients) were assessed within and between reward (VTA and NAcc) and learning/memory (Basal Ganglia, DPFC, Hippocampus, Parahippocampus, Occipital Lobe) sub-networks. The task paradigm itself alternated between Encoding, Consolidation, and Retrieval conditions, and uFC differences were quantified for each of the conditions. Significantly reduced uFC dominated the connectivity profiles of patients across all conditions. More pertinent to our motivations, these reductions were observed within and across classes of sub-networks (reward-related and learning/memory related). We suggest that disrupted functional connectivity between reward and learning sub-networks may drive many of the performance deficits that characterize schizophrenia. Thus, cognitive deficits in schizophrenia may in fact be underpinned by a loss of synergy between reward-sensitivity and cognitive processes.

Keywords: Functional connectivity; Reward and learning; Schizophrenia; fMRI.


Conflict of interest statement

Declaration of competing interest The authors have no conflicts of interest to report.

Figures

Figure 1.
Figure 1.
The experimental paradigm is depicted. Across eight cycles (one of which is depicted in the figure), participants learned the associations between nine mono-syllabic pictures and nine unique grid locations. During each Encoding epoch, objects were presented in their associated location (in randomized order) for naming (3 s per object; 27 s). A brief post-consolidation epoch followed (27 s), which is characterized by covert rehearsal of associations. During the subsequent Retrieval epoch (27 s), each of the nine locations were cued (in random order), and participants were required to verbally name the associated object. A post-Retrieval Re-consolidation period (27 s) followed that is typically associated with the covert strengthening of retrieved memory traces.
Figure 2.
Figure 2.
The Figure depicts the significantly co-activated clusters (see Methods) projected to lateral, medial and dorsal cortical surfaces. Overlaid on the clusters are nodes representing the a priori network of interest (see Introduction and Methods), presented in their precise anatomical locations (in stereotactic space). Black spheres are used to denote nodes representing the Memory sub-circuit (Hippo, BG, dPFC, FG, PHG, Occ). Grey spheres are used to denote nodes representing the Reward sub-circuit (NAcc and VTA). This node-denoting color scheme is maintained for subsequent Figures 4–7.
Figure 3.
Figure 3.
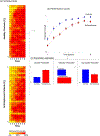
(a) The heat maps present data from all the healthy controls (top) and patients from whom fMRI data were acquired and analyzed. The colors represent percent correct retrieval performance on each of the eight epochs. (b) The performance curves summarize the individual participant data (± sem)(see Results for statistical analyses). Subsequently, fraction correct performance in each participant was modeled using the non-linear least-square fitting three-parameter Gompertz function (FractionCorrect=a×e(e(bc×time))). In each fit, a represents the asymptote (most generally representing learning capacity), b represents the growth rate constant, and c represents the inflection point (time at which the performance transitions from linear to asymptotic). All three parameters significantly differed between groups (see Results). Group means (± sem) are depicted in (c).
Figure 4.
Figure 4.
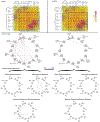
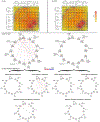
The adjacency matrices represent the symmetric smoothed heat maps of uFC values for healthy controls (a) and patients (b) during the Encoding phase of the task. The connectivity measures are provided for all pairs in the network of interest formed from the eight bilateral nodes in the network (see Methods). Nodes are distinguished based on their membership in Reward (gray inset) or Memory sub-networks (black inset). This distinction and the spatial arrangement is maintained throughout Figures 5 – 7 (and in the associated Supplementary figures). The connectivity maps are smoothed (Gaussian radius multiplier: 0.6; Contour smoothness: 96; Babicki et al., 2016). This smoothing accentuates variations in connectivity through sub-areas of the matrix, highlighting salient uFC patterns. The dark band along the diagonal represents maximum uFC intensities (resulting from the auto-correlation of the Z-values). As is generally seen, the connectivity terrain in healthy controls is darker. This reflects a higher amplitude of uFC in the connectivity terrain of controls (see Supplementary Figure 1a and 1b for connectivity coefficients). However, the topography of the connectivity terrains (based on the contour lines) is similar, albeit with local differences in peaks and iso-contour lines. (c) The connectivity data are reduced to statistically significant (pFDR<.05) differences (HC ≠ SCZ) in uFC. Any observed significant differences are represented as edges in the connectomic rings (the nodes form the vertices on the periphery). For ease of access, the two tails of the effects HC > SCZ (red, left) and SCZ > HC (blue, right) are separately depicted. (d) Next, to assess where these effects lay, edges were classified into one of three rings. These successively represent differences within the Reward sub-network, within the Memory sub-network, or between the Reward and Memory sub-network. As seen, patterns of reduced uFC are particularly notable between nodes like the NAcc and the VTA, and nodes in the memory sub-network, in addition to a loss of connectivity within the memory sub-network.
Figure 5.
Figure 5.
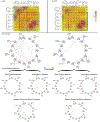
The adjacency matrices represent the symmetric smoothed heat maps of uFC values for healthy controls (a) and patients (b) during the Post-Encoding Consolidation phase of the task (see Supplementary Figure 2a and 2b for connectivity coefficients). The scheme follows conventions from Figure 4. As can be seen in (c) and (d), even I the absence of overt sensory processing, the condition evoked reduced uFC between nodes like the NAcc and the VTA, and nodes in the Memory sub-network, and between nodes within the Memory sub-network. By comparison, increased uFC was distributed within and between sub-networks.
Figure 6.
Figure 6.
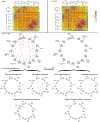
The adjacency matrices represent the symmetric smoothed heat maps of uFC values for healthy controls (a) and patients (b) during the Retrieval phase of the task and are depicted using previously noted conventions (Figures 4–5). As can be seen in (c) and (d) retrieval induced significantly reduced uFC in SCZ within the Memory-, and between Reward and Memory sub-networks. These effects partially overlap with dysconnection observed during Encoding, with the loss of connectivity between the NAcc and nodes in the Memory sub-network being notably amplified.
Figure 7.
Figure 7.
The adjacency matrices represent the symmetric smoothed heat maps of uFC values for healthy controls (a) and patients (b) during the Post-Retrieval Reconsolidation phase of the task and are depicted using previously noted conventions (Figures 4–6). As seen in (c) and (d), Post Retrieval Reconsolidation induced reduced uFC in SCZ within the Memory, and between the Reward and Memory sub-networks. Again, the involved of the NAcc in the loss of inter-network connectivity is highly notable. As with Post-Encoding Consolidation, this “task-free” phase also induced a substantial loss of connectivity between Reward and Memory sub-networks.

References

    1. Achim AM, Bertrand MC, Sutton H, Montoya A, Czechowska Y, Malla AK, Joober R, Pruessner JC, Lepage M, 2007. Selective abnormal modulation of hippocampal activity during memory formation in first-episode psychosis. Archives of general psychiatry 64(9), 999–1014. - PubMed
    1. Addington J, Addington D, 1993. Premorbid functioning, cognitive functioning, symptoms and outcome in schizophrenia. J Psychiatry Neurosci 18(1), 18–23. - PMC - PubMed
    1. Addington J, Addington D, 1998. Visual attention and symptoms in schizophrenia: a 1-year follow-up. Schizophrenia research 34(1–2), 95–99. - PubMed
    1. Alberini CM, LeDoux JE, 2013. Memory reconsolidation. Current Biology 23(17), R746–R750. - PubMed
    1. Amodio A, Quarantelli M, Mucci A, Prinster A, Soricelli A, Vignapiano A, Giordano GM, Merlotti E, Nicita A, Galderisi S, 2018. Avolition-Apathy and White Matter Connectivity in Schizophrenia: Reduced Fractional Anisotropy Between Amygdala and Insular Cortex. Clin EEG Neurosci 49(1), 55–65. - PubMed

Publication types