. 2023 Jul 18;4(7):101110.
doi: 10.1016/j.xcrm.2023.101110.

A target discovery pipeline identified ILT3 as a target for immunotherapy of multiple myeloma

Affiliations

A target discovery pipeline identified ILT3 as a target for immunotherapy of multiple myeloma

Francesco Di Meo et al. Cell Rep Med. .

Abstract

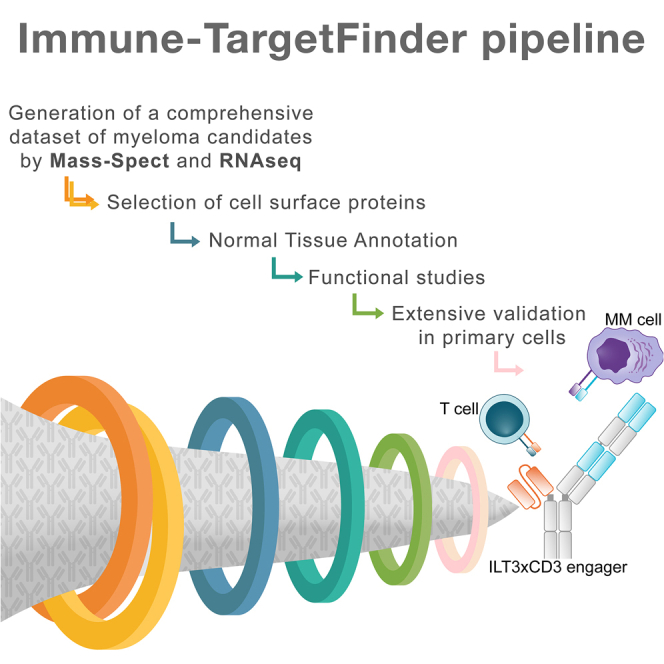
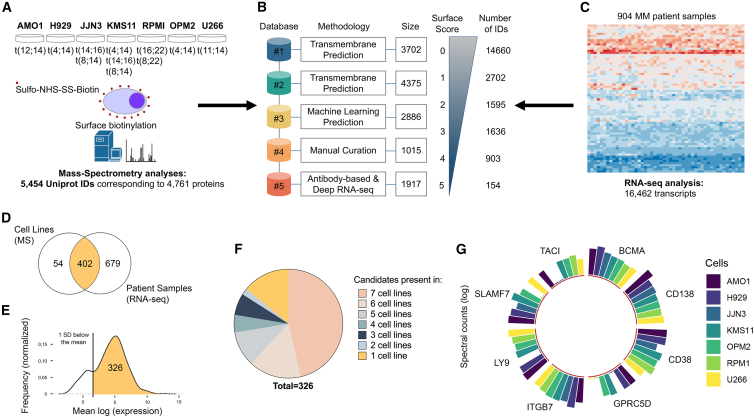
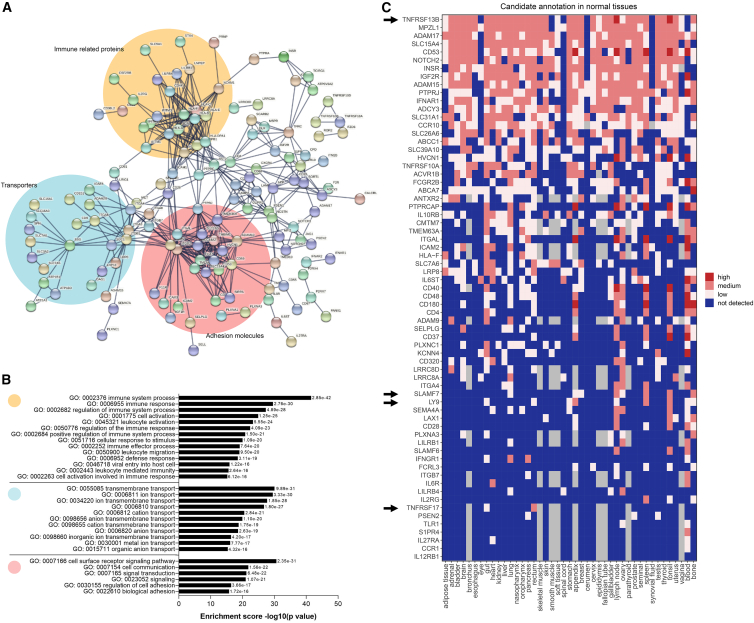
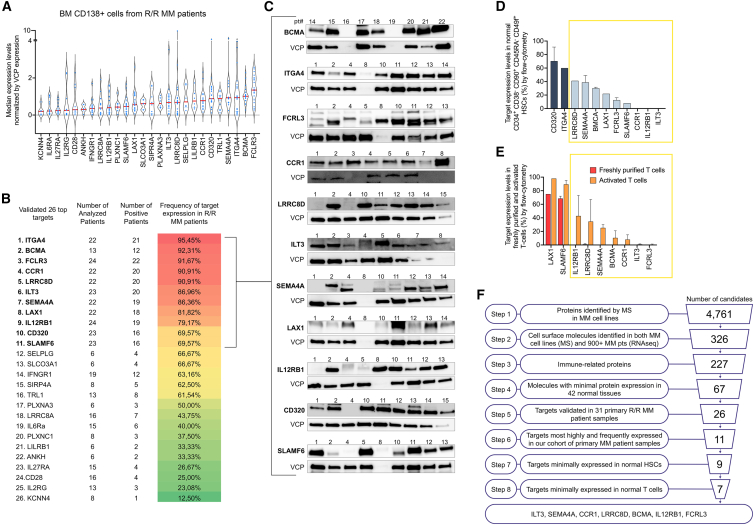
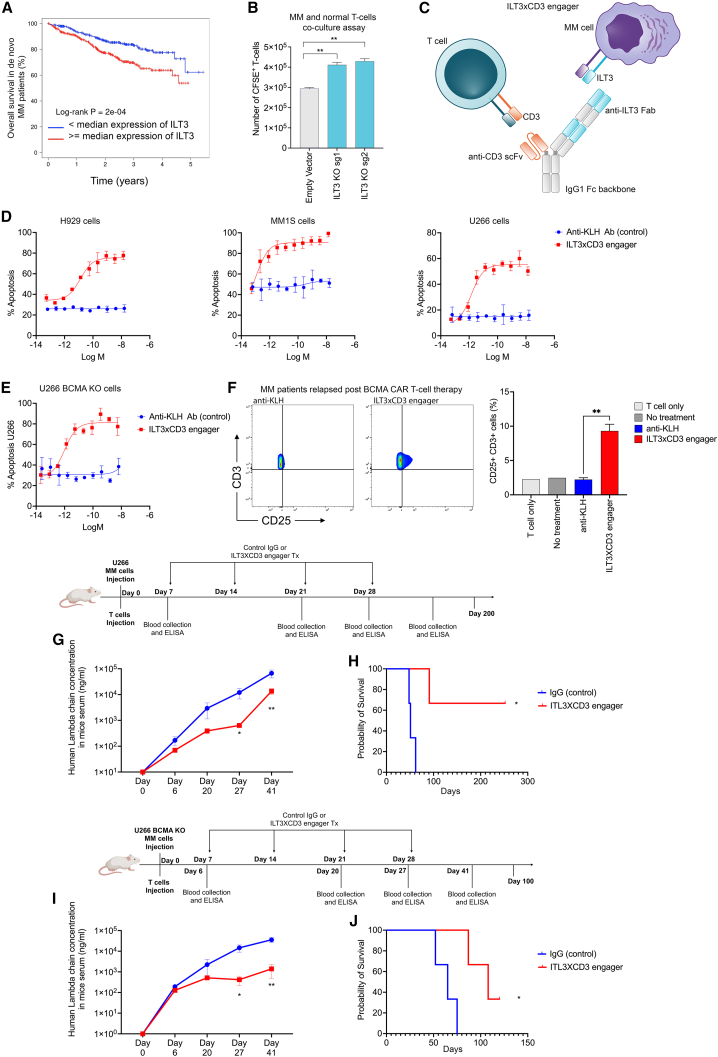
Multiple myeloma (MM) is an incurable malignancy of plasma cells. To identify targets for MM immunotherapy, we develop an integrated pipeline based on mass spectrometry analysis of seven MM cell lines and RNA sequencing (RNA-seq) from 900+ patients. Starting from 4,000+ candidates, we identify the most highly expressed cell surface proteins. We annotate candidate protein expression in many healthy tissues and validate the expression of promising targets in 30+ patient samples with relapsed/refractory MM, as well as in primary healthy hematopoietic stem cells and T cells by flow cytometry. Six candidates (ILT3, SEMA4A, CCR1, LRRC8D, FCRL3, IL12RB1) and B cell maturation antigen (BCMA) present the most favorable profile in malignant and healthy cells. We develop a bispecific T cell engager targeting ILT3 that shows potent killing effects in vitro and decreased tumor burden and prolonged mice survival in vivo, suggesting therapeutic relevance. Our study uncovers MM-associated antigens that hold great promise for immune-based therapies of MM.

Keywords: BCMA; CCR1; FCRL3; IL12RB1; ILT3; Immune-TargetFinder pipeline; LRRC8D; Mass-Spectrometry; SEMA4A; Target discovery strategy; bi-specific T cell engager; immunotherapy; multiple myeloma; primary patient samples; target antigens; validation.


Conflict of interest statement

Declaration of interests F.P. has a patent related to this work: WO2021195536A1 - PCT/US2021/024431.

Figures

None
Graphical abstract
Figure 1
Figure 1
Mapping the multiple myeloma cell surface proteome (A) Experimental design showing 7 multiple myeloma (MM) cell lines and relative genetic aberrations, biotin labeling to enrich cell surface proteins, and number of protein IDs obtained from MS analysis. (B) Our integrated scoring system for cell surface molecule annotation. Each repository with relative methodology and size is shown. 0 denotes that the protein was not found in any repository, and 5 denotes that the protein was found in all five repositories. Size, the numbers in the squares indicate the number of molecules contained in that dataset. Number of IDs, the number of molecules that have the score shown on the side. (C) Integrated RNA-seq data from the CoMMpass database of patients with MM. Number of transcripts scored for genes coding for cell surface proteins is shown. (D) Venn diagram showing the overlap between cell surface candidates (score equal or higher than 3) identified with MS analysis in MM cell lines and RNA-seq in patients with MM. (E) Selection of 326 candidates out of 402 that are more highly expressed in patients by excluding molecules with an expression 1 SD below the average gene expression. (F) Protein distribution of selected 326 candidates across 7 MM cells by MS. (G) Circular bar plot graph showing the expression of current MM immunotherapeutic targets in the 7 MM cell lines by MS and ggplot2 in R. Height of column indicates label-free quantification (LFQ) intensity from MaxQuant averaged across replicate samples.
Figure 2
Figure 2
Identification of biologically and therapeutically relevant targets (A) Identification of three protein networks from the list of 326 candidate targets. 490 edges (expected number of edges is 109) with average node degree of 3. Average local clustering coefficient is 0.326. Protein-protein interaction (PPI) enrichment p value is <1.0e−16. (B) Results of the Gene Ontology enrichment analysis (biological process) of the selected 326 candidate targets. (C) Heatmap showing the protein expression levels of 67 selected candidates in a large panel of healthy tissues. Blue indicates expression below the level of MS sensitivity, light pink means low expression, pink means medium expression, and red means high expression. Cutoff parameters for low, high, and medium expression were described in Perna et al. Arrows indicate common targets in current clinical and pre-clinical developments.
Figure 3
Figure 3
Validation step in primary patient samples (A) Target expression levels normalized by the loading control (VCP) based on western blot validation in 31 MM patient samples. (B) Frequency of target expression in primary MM patient samples by western blot. (C) Representative western blot (WB) data of 11 top candidate targets in MM primary patient samples. Numbers refer to patient samples used. VCP serves as loading control. Complete set of data in Figure S2A. (D) Target expression in purified healthy hematopoietic stem cells by flow cytometry. Data representing the results of three independent biological experiments in primary healthy CD34+CD38CD45RACD90+CD49f+ HSCs by flow cytometry. Gating strategy is shown in Figure S2C. Data represent means ± SD. (E) Target expression in freshly purified and activated T cells by flow cytometry. T cell activation is confirmed by measuring CD25 and HLADR upon treatment with CD3/CD28 beads at days 0, 4, and 5 (see Figure S2D). Data represent the results of three independent biological experiments. Data represent means ± SD. (F) Schematic representation of the stepwise pipeline utilized for target discovery and relative numbers of candidates obtained per step.
Figure 4
Figure 4
ILT3 × CD3 bispecific T cell engager antibody for MM (A) Overall survival of patients with de novo MM based on ILT3 expression. Patients with an ILT3 expression above the median gene expression present a statistically significant worse survival. Survival analysis was performed using the R package Survival with log rank test and hazard ratio statistical tests and the MMRF cohort, as we previously described. (B) T cells isolated from healthy donors were activated with CD3/CD28 beads and co-cultured with U266 MM cells expressing an empty vector (controls) or ILT3 knockout (KO) U266 MM cells for 48 h at a target:effector 1:2 ratio. CFSE-positive T cells were counted by flow cytometry. ∗∗p ≤ 0.01. Data represent the results of three independent biological experiments. Statistical analyses were performed using Student’s t test. (C) Schematic representation of the bivalent anti-ILT3 × CD3 bispecific antibody that we developed. T cell engager was designed on a human IgG1 backbone. The bivalent tandem anti-ILT3 Fabs are positioned on the Knob Fc, and the anti-CD3 scFv is positioned on the Hole Fc. The anti-ILT3 Fab targeting arm contains humanized variable heavy (vH) and variable light (vL) sequences that were selected from an antibody campaign against the extracellular domain of human ILT3. Data represent the results of three independent biological experiments. (D) Killing assays of 3 RFP-labeled MM cell lines (U266, H929, and MM1.S cells). Cells are co-cultured with T cells (target:effector [T:E] ratio 1:5) and treated with ILT3 × CD3 antibody or control antibody (anti-KLH). A caspase cleavage domain coupled to a green DNA-binding fluorescent label is released upon cleavage by activated caspase 3/7 and quantified. (E) We generated a BCMA-KO U266 cell line and determined the killing ability of the ILT3 × CD3 antibody in co-culture with healthy T cells. The cell line was RFP labeled as described for (D). (F) T cells isolated from healthy donors were co-cultured with primary samples from patients who relapsed post-BCMA-CAR T cell therapy. The ILT3 × CD3 antibody was added to the culture, and T cell activation was measured by CD25 expression with flow cytometry. Percentage of CD3+CD25+ T cells was compared between the group treated with the ILT3 × CD3 antibody and the group treated with the control antibody (anti-KLH). Untreated cells and T cells alone served as additional controls. ∗∗p ≤ 0.01. Statistical analyses were performed using Student’s t test. (G) In vivo treatment with ILT3 × CD3 antibody (1 mpk). NSG mice were injected with MM U266 cells and healthy T cells from healthy volunteers and treated with 4 weekly doses of ILT3 × CD3 antibody or control IgG. Lambda chain concentration in mice serum by ELISA at multiple time points served as measurement of the tumor burden. ∗p ≤ 0.05, ∗∗p ≤ 0.01. Data represent the results of two technical replicates. Statistical analyses were performed using Student’s t test. (H) Overall mice survival from the experiment described in (G). ∗p ≤ 0.05. Statistical analyses were performed using log rank (Mantel-Cox) test. (I) NSG mice were injected with BCMA-KO MM U266 cells and healthy T cells from healthy volunteers and treated with 4 weekly doses of ILT3 × CD3 antibody (1 mpk) or control IgG. Lambda chain concentration in mice serum by ELISA at multiple time points served as measurement of tumor burden. ∗p ≤ 0.05, ∗∗p ≤ 0.01. Data represent the results of two technical replicates. Statistical analyses were performed using Student’s t test. (J) Overall mice survival from the experiment described in (I). ∗p ≤ 0.05. Statistical analyses were performed using log rank (Mantel-Cox) test. Data in (D)–(G) and (I) represent means ± SD.

References

    1. Kumar S.K., Rajkumar V., Kyle R.A., van Duin M., Sonneveld P., Mateos M.V., Gay F., Anderson K.C. Multiple myeloma. Nat. Rev. Dis. Prim. 2017;3:17046. doi: 10.1038/nrdp.2017.46. - DOI - PubMed
    1. Friedman K.M., Garrett T.E., Evans J.W., Horton H.M., Latimer H.J., Seidel S.L., Horvath C.J., Morgan R.A. Effective Targeting of Multiple B-Cell Maturation Antigen-Expressing Hematological Malignances by Anti-B-Cell Maturation Antigen Chimeric Antigen Receptor T Cells. Hum. Gene Ther. 2018;29:585–601. doi: 10.1089/hum.2018.001. - DOI - PMC - PubMed
    1. Brudno J.N., Maric I., Hartman S.D., Rose J.J., Wang M., Lam N., Stetler-Stevenson M., Salem D., Yuan C., Pavletic S., et al. T Cells Genetically Modified to Express an Anti-B-Cell Maturation Antigen Chimeric Antigen Receptor Cause Remissions of Poor-Prognosis Relapsed Multiple Myeloma. J. Clin. Oncol. 2018;36:2267–2280. doi: 10.1200/JCO.2018.77.8084. - DOI - PMC - PubMed
    1. Da Vià M.C., Dietrich O., Truger M., Arampatzi P., Duell J., Heidemeier A., Zhou X., Danhof S., Kraus S., Chatterjee M., et al. Homozygous BCMA gene deletion in response to anti-BCMA CAR T cells in a patient with multiple myeloma. Nat. Med. 2021;27:616–619. doi: 10.1038/s41591-021-01245-5. - DOI - PubMed
    1. Coquery C.M., Erickson L.D. Regulatory roles of the tumor necrosis factor receptor BCMA. Crit. Rev. Immunol. 2012;32:287–305. doi: 10.1615/critrevimmunol.v32.i4.10. - DOI - PMC - PubMed

Publication types