. 2023 Jul 18;4(7):101109.
doi: 10.1016/j.xcrm.2023.101109.

Plasma metabolic fingerprints for large-scale screening and personalized risk stratification of metabolic syndrome

Affiliations

Plasma metabolic fingerprints for large-scale screening and personalized risk stratification of metabolic syndrome

Yifan Chen et al. Cell Rep Med. .

Abstract

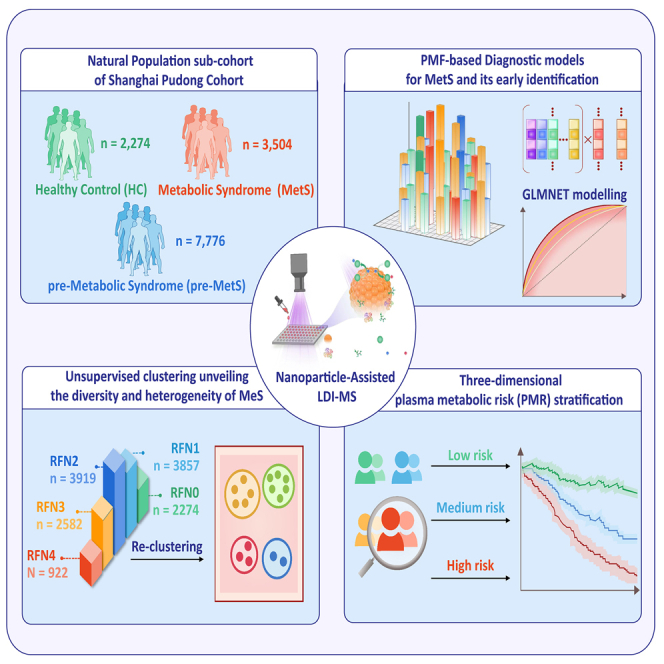
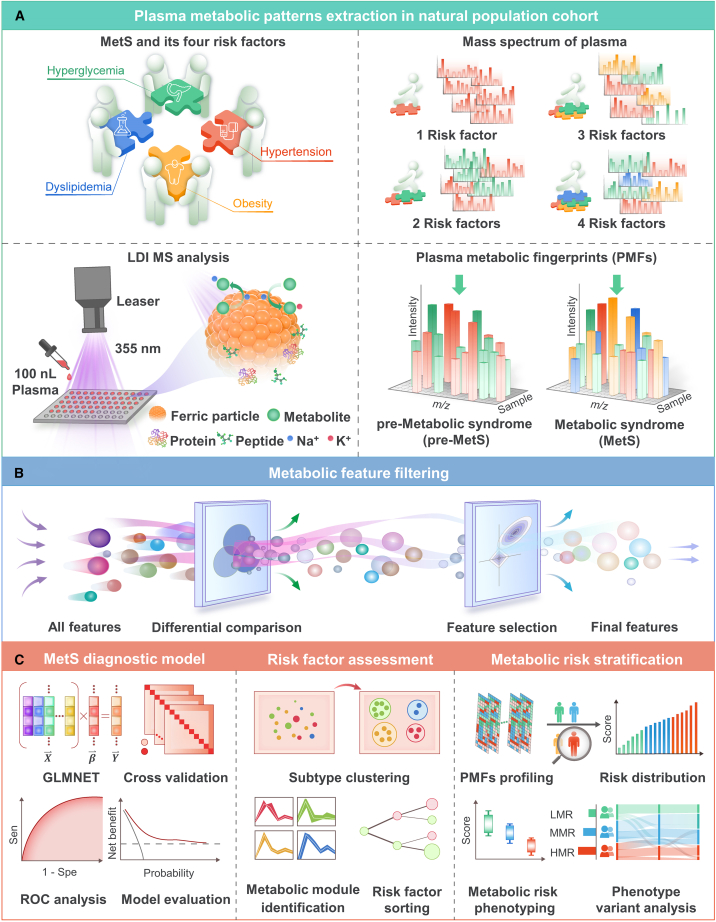
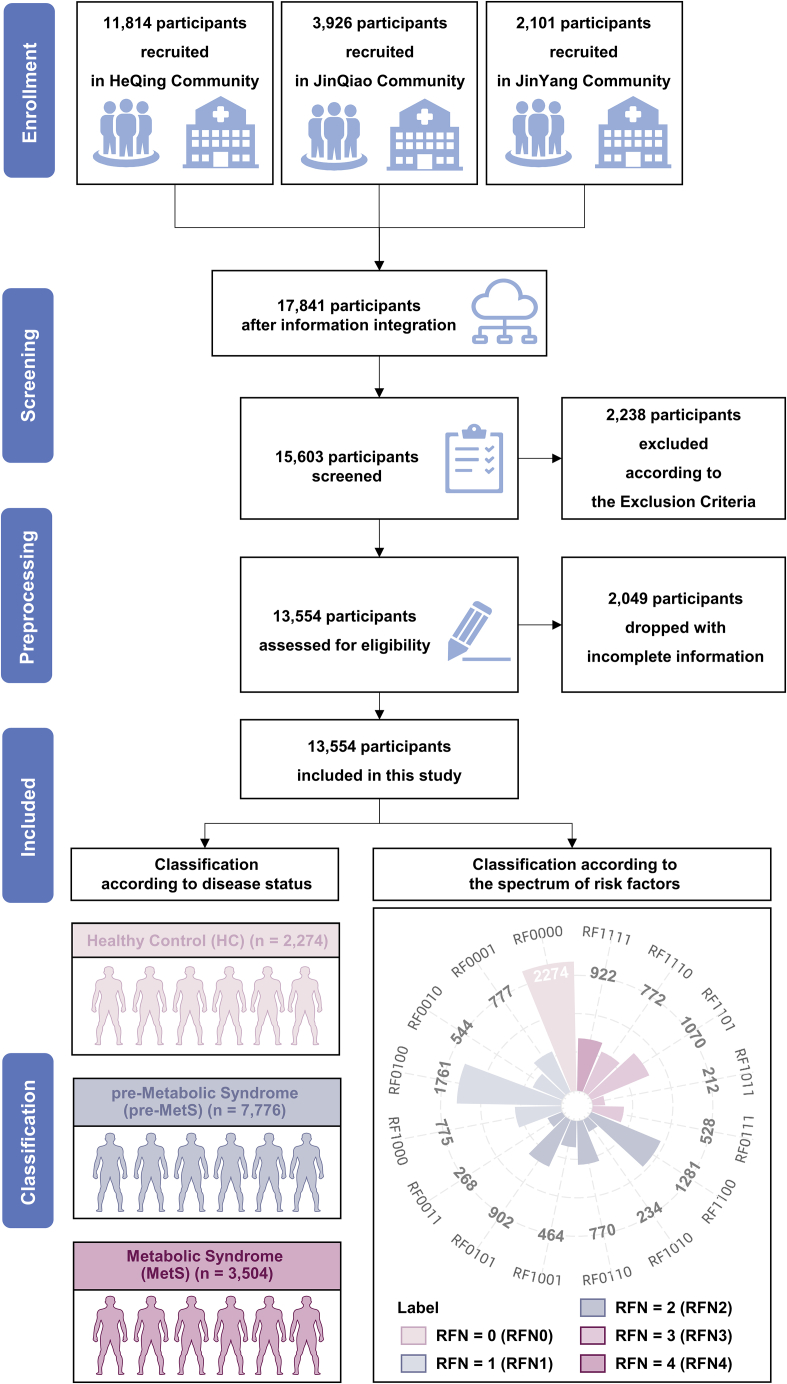
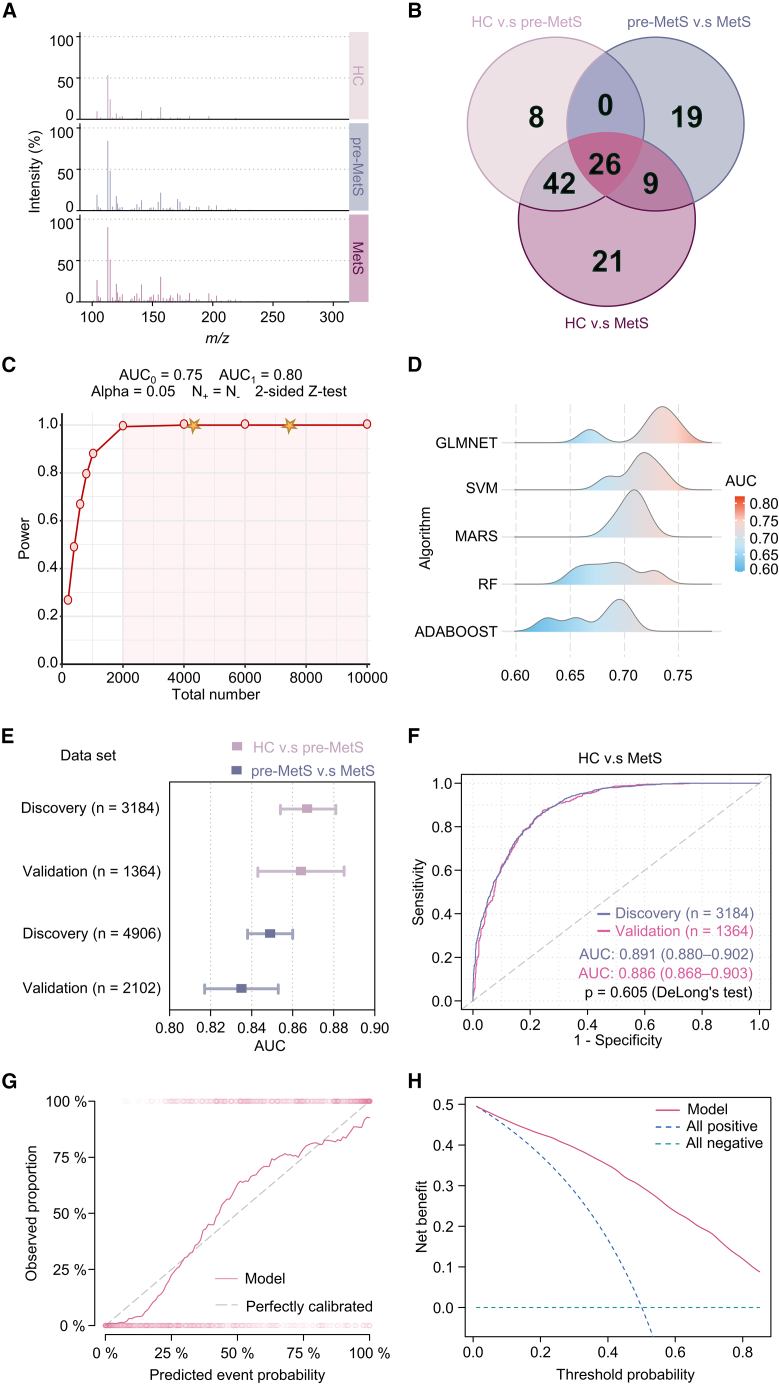
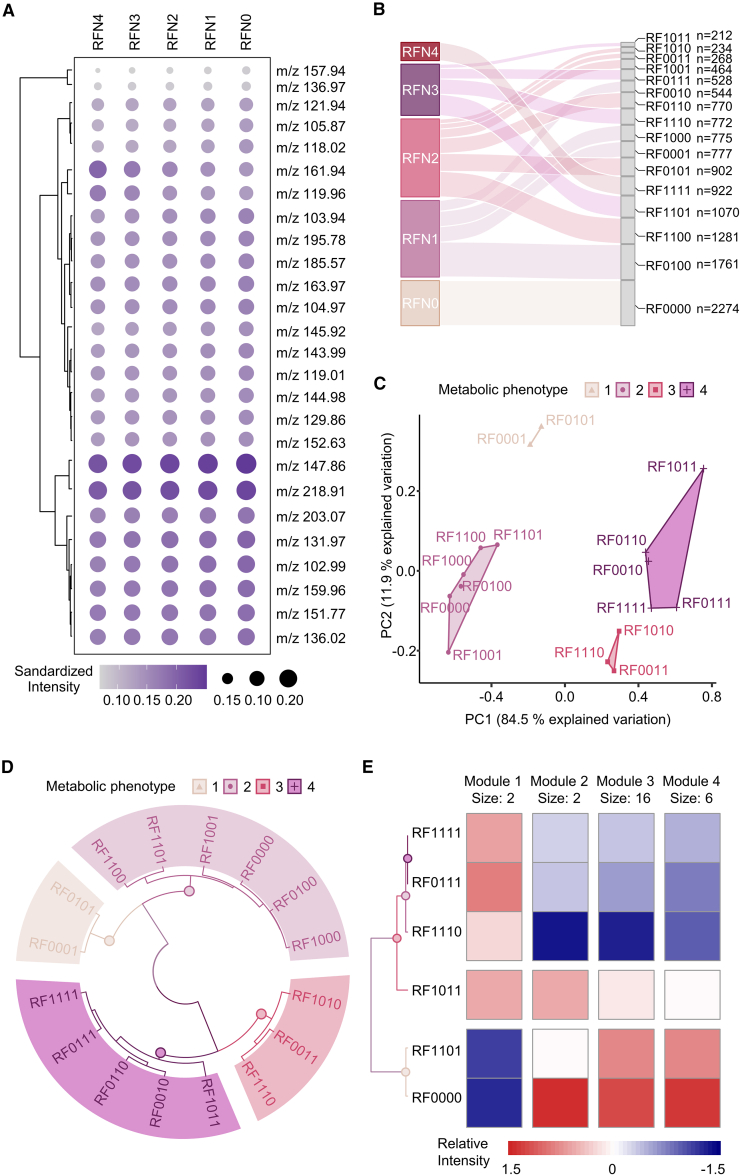
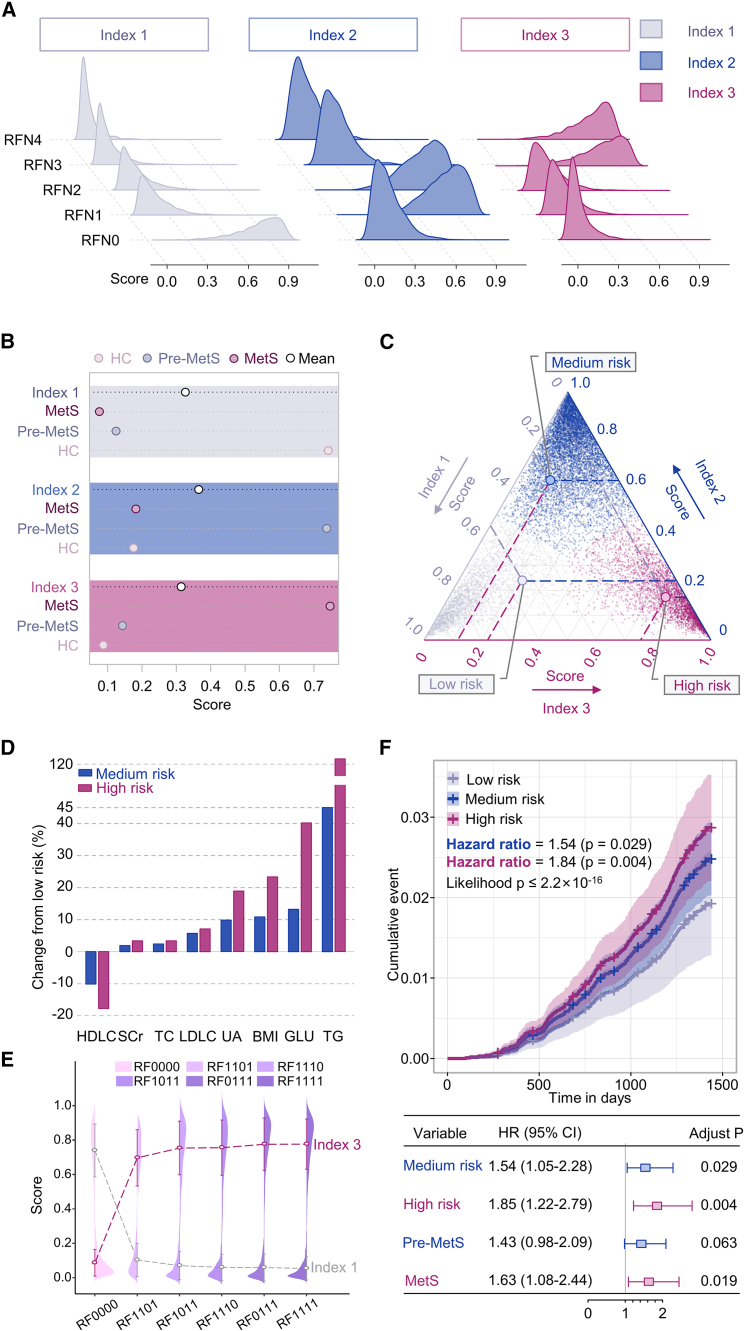
Direct diagnosis and accurate assessment of metabolic syndrome (MetS) allow for prompt clinical interventions. However, traditional diagnostic strategies overlook the complex heterogeneity of MetS. Here, we perform metabolomic analysis in 13,554 participants from the natural cohort and identify 26 hub plasma metabolic fingerprints (PMFs) associated with MetS and its early identification (pre-MetS). By leveraging machine-learning algorithms, we develop robust diagnostic models for pre-MetS and MetS with convincing performance through independent validation. We utilize these PMFs to assess the relative contributions of the four major MetS risk factors in the general population, ranked as follows: hyperglycemia, hypertension, dyslipidemia, and obesity. Furthermore, we devise a personalized three-dimensional plasma metabolic risk (PMR) stratification, revealing three distinct risk patterns. In summary, our study offers effective screening tools for identifying pre-MetS and MetS patients in the general community, while defining the heterogeneous risk stratification of metabolic phenotypes in real-world settings.

Keywords: LDI-MS; machine learning; metabolic syndrome; plasma metabolic fingerprint; risk stratification.


Conflict of interest statement

Declaration of interests The authors have filed patents for both the technology and the use of the technology to analyze biofluid samples.

Figures

None
Graphical abstract
Figure 1
Figure 1
Overall schematics for evaluating MetS among the general aging population based on the combination of PMFs and ML (A) Schematic workflow for the extraction of PMFs using ferric particle-assisted laser desorption/ionization mass spectrometry (LDI-MS). One hundred nanoliters of native plasma was used for direct analysis without pretreatment procedures. Only Na+- and K+-adducted metabolites can be selectively detected with the coexistence of high concentrations of peptides and proteins. (B) Feature filtering for hub PMFs was carried out according to difference comparisons among the healthy control (HC), pre-MetS, and MetS groups. (C) PMF-based diagnostic models were constructed for HC vs. pre-MetS, pre-MetS vs. MetS, and HC vs. MetS. Traditional risk factors were assessed by unsupervised clustering of various subtypes of MetS. Finally, PMF-based metabolic risk stratification was computed to define three metabolic risk patterns: low metabolic risk (LMR), moderate metabolic risk (MMR), and high metabolic risk (HMR).
Figure 2
Figure 2
Overview flow chart of the study design and enrollment The complete study design consisted of five steps, including enrollment, screening, preprocessing, inclusion, and classification. For enrollment, 11,814, 3,926, and 2,101 individuals were initially recruited in the HeQing, JinQiao, and JinYang communities based on the prospective Shanghai Community Cohort Establishment and Follow-up (NCT04517513). For screening, 2,238 participants were excluded according to the exclusion criteria (see STAR Methods). For preprocessing, 2,049 participants with incomplete information were excluded. Finally, 13,554 participants were included in this study. Participants were classified into the HC (n = 2,274; no use of lipid-lowering, antidiabetic, or antihypertensive drugs), pre-MetS (n = 7,776; clustering of <3 traditional risk factors, including obesity, hypertension, dyslipidemia, and dyslipidemia), and MetS (n = 3,504; clustering of ≥3 traditional risk factors) groups according to the statement of the Chinese Diabetes Society 2004. Participants were also classified into five subgroups (RFN1–5) according to the present number of four MetS risk factors or into 16 subclusters (RF0000–RF111) considering a combination of risk factors (0/1 = absence/presence of each risk factor). For more details, see Table 2. RFN indicates the number of traditional MetS risk factors.
Figure 3
Figure 3
Diagnostic models for pre-MetS and MetS by 26 hub PMFs adjusted for age and gender using ML (A) Typical mass spectrometry spectra within an m/z range of 100–300 obtained by ferric particle-assisted LDI-MS of plasma samples from the HC, pre-MetS, and MetS groups. (B) The final 26 hub PMFs were filtered out by comparison of differential PMFs among HC vs. pre-MetS, pre-MetS vs. MetS, and HC vs. MetS groups using Kruskal-Wallis rank-sum test and Bonferroni/Dunnett correction in the discovery cohorts. (C) Power analysis of the diagnosis of pre-MetS and MetS using a two-sided Z test. AUC0 and AUC1 are the areas under the receiver operating characteristic (ROC) curves (AUCs) for the null and alternative hypotheses, respectively. N+ and N are the numbers of items sampled from cases and controls, respectively. The stars indicate the numbers in our datasets (n = 4,548, 4,548, and 7,008) for classification among HC vs. pre-MetS, HC vs. MetS, and pre-MetS vs. MetS, respectively. (D) Distribution of the AUC using generalized linear models via least absolute shrinkage and selection operator and elastic-net regularization (GLMNET), support vector machine (SVM), multivariate adaptive regression splines (MARS), random forest (RF), and adaptive boosting (ADABOOST) to distinguish between HC and MetS groups in the validation cohort (n = 1,364). (E) Distribution of the AUCs of HC vs. pre-MetS and pre-MetS vs. MetS in both the discovery and validation sets (HC vs. pre-MetS in pink and pre-MetS vs. MetS in purple). (F) ROC curves for the PMF-based MetS diagnostic model using the GLMNET algorithm to distinguish between MetS and HC in the discovery (n = 3,184) and validation sets (n = 1,364). (G) Calibration curves for our model showed good correlation between predicted and observed outcomes. The calibration curve was close to the 45° perfectly calibrated line. (H) DCA plot depicting the standardized net benefit of our model.
Figure 4
Figure 4
PMF-based unsupervised ML revealed the heterogeneity of MetS (A) The standardized intensity of all hub PMFs among five subgroups (RFN0–RFN4) according to the number of risk factors. (B) The distribution of five subgroups (RFN0–RFN4) and 16 subclusters (RF0000–RF1111) classified according to traditional risk factors in the general population. (C) K-means clustering analysis scatter diagram regrouping 16 subclusters into four metabolic phenotypes (MPs) based on the results of PCA. Each point represents a subcluster condition containing (or not) the risk factor according to Table 2. MPs are indicated by colored shading. (D) Circular hierarchical cluster analysis dendrogram grouping 16 subclusters into the same four MPs based on phenotypic similarity. Colors of subcluster names based on the MPs. (E) Relative risk assessment among the five MetS subgroups (RF0111, RF1011, RF1101, RF1110, RF1111) and HC group through K-means clustering analysis based on the relative intensity of all 26 hub PMFs. These PMFs were divided into four metabolic feature modules (modules 1–4).
Figure 5
Figure 5
Construction of the three-dimensional PMR stratification for evaluating individual metabolic heterogeneity (A) Distribution of the three PMR indexes (index 1–3) among the five subgroups (RFN0–RFN4) classified according to the present number of traditional risk factors. (B) Mean scores of these three indexes (index 1–3) in the HC, pre-MetS, and MetS groups. (C) Specific PMR patterns for all participants in the general population cohort. Gray, blue, and purple dots indicate individual status ranked by LMR, MMR, and HMR patterns, respectively. (D) The relative changes in high-density lipoprotein cholesterol (HDLC), serum creatinine (SCr), serum total cholesterol (TC), low-density lipoprotein cholesterol (LDLC), uric acid (UA), body mass index (BMI), glucose (GLU), and triglycerides (TGs) in the MMR and HMR groups compared with those in the LMR group. (E) Mean scores for index 1 (in gray) and index 3 (in purple) in the five MetS subtypes (RF1110, RF1011, RF1101, RF0111, and RF1111) and the HC group (RF0000). (F) Cumulative curves and forest plots of the 4-year mortality events for 13,554 patients with three PMR statuses stratified by gender and age. The p value for multivariate Cox regression analysis models was calculated by the likelihood test. The p value for variables was obtained by a log-rank test and hazard ratio (HR).

References

    1. Hirode G., Wong R.J. Trends in the Prevalence of Metabolic Syndrome in the United States, 2011-2016. JAMA. 2020;323:2526–2528. doi: 10.1001/jama.2020.4501. - DOI - PMC - PubMed
    1. Lu J., Wang L., Li M., Xu Y., Jiang Y., Wang W., Li J., Mi S., Zhang M., Li Y., et al. Metabolic Syndrome Among Adults in China: The 2010 China Noncommunicable Disease Surveillance. J. Clin. Endocrinol. Metab. 2017;102:507–515. doi: 10.1210/jc.2016-2477. - DOI - PubMed
    1. Gurka M.J., Golden S.H., Musani S.K., Sims M., Vishnu A., Guo Y., Cardel M., Pearson T.A., DeBoer M.D. Independent associations between a metabolic syndrome severity score and future diabetes by sex and race: the Atherosclerosis Risk In Communities Study and Jackson Heart Study. Diabetologia. 2017;60:1261–1270. doi: 10.1007/s00125-017-4267-6. - DOI - PMC - PubMed
    1. Wang Y., Li J., Zheng X., Jiang Z., Hu S., Wadhera R.K., Bai X., Lu J., Wang Q., Li Y., et al. Risk Factors Associated With Major Cardiovascular Events 1 Year After Acute Myocardial Infarction. JAMA Netw. Open. 2018;1 doi: 10.1001/jamanetworkopen.2018.1079. - DOI - PMC - PubMed
    1. Esposito K., Chiodini P., Colao A., Lenzi A., Giugliano D. Metabolic syndrome and risk of cancer: a systematic review and meta-analysis. Diabetes Care. 2012;35:2402–2411. doi: 10.2337/dc12-0336. - DOI - PMC - PubMed

Publication types