

Fast and low-dose medical imaging generation empowered by hybrid deep-learning and iterative reconstruction
- PMID: 37467726
- PMCID: PMC10394257
- DOI: 10.1016/j.xcrm.2023.101119
Fast and low-dose medical imaging generation empowered by hybrid deep-learning and iterative reconstruction
Abstract
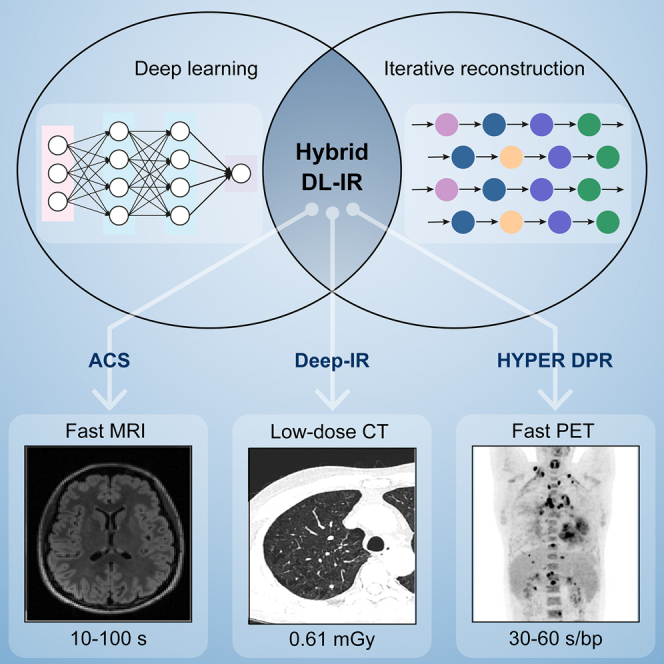
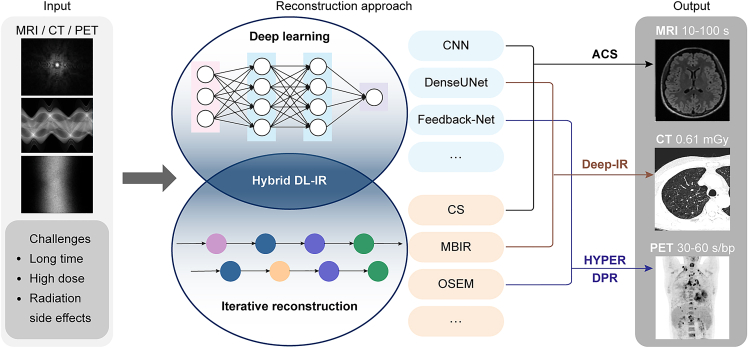
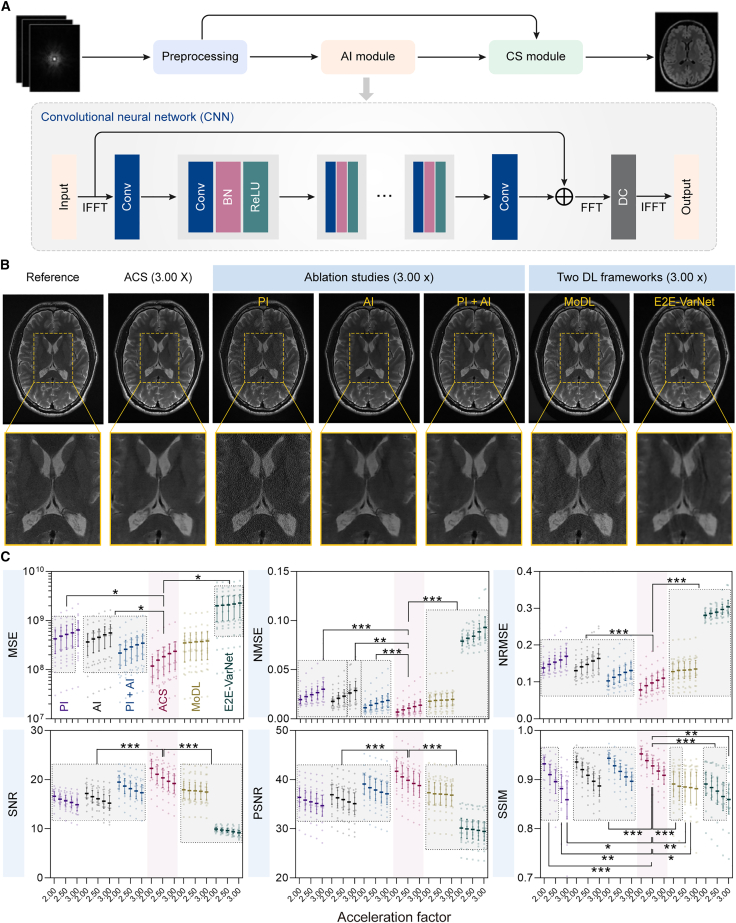
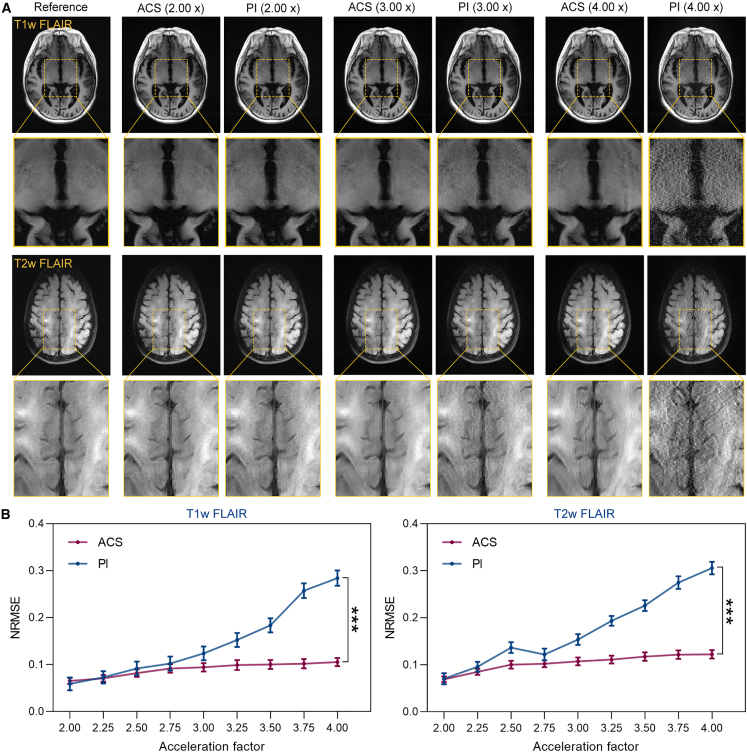
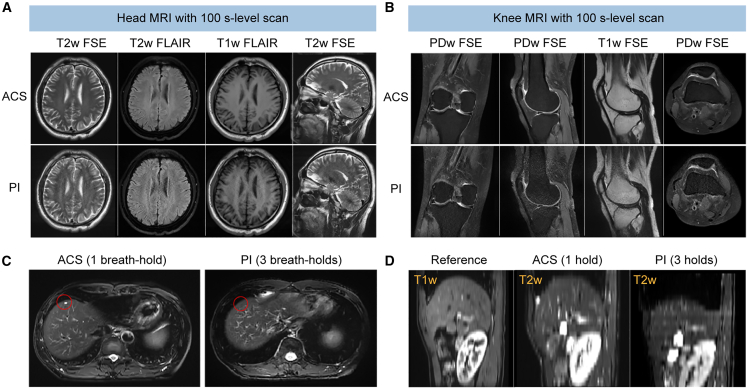
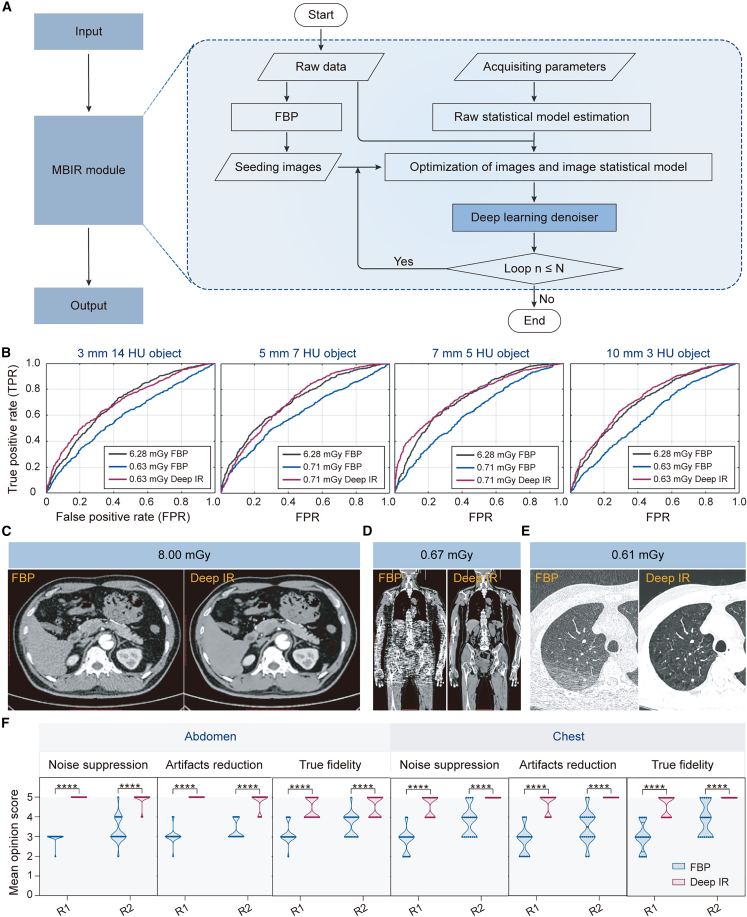
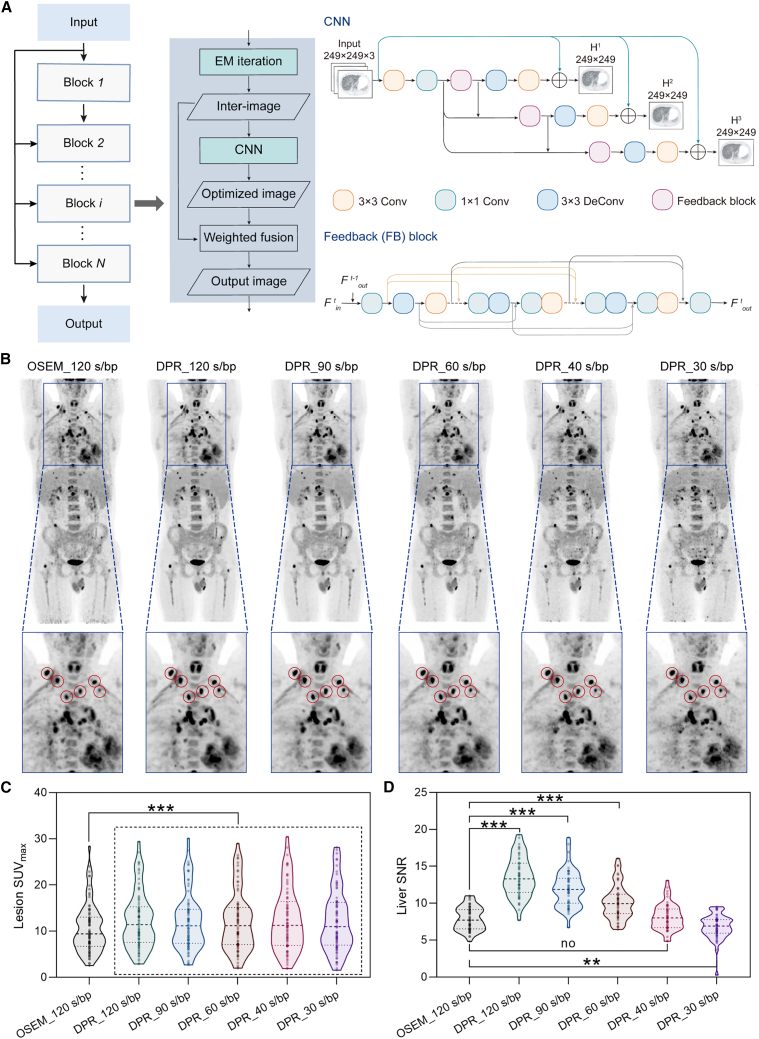
Fast and low-dose reconstructions of medical images are highly desired in clinical routines. We propose a hybrid deep-learning and iterative reconstruction (hybrid DL-IR) framework and apply it for fast magnetic resonance imaging (MRI), fast positron emission tomography (PET), and low-dose computed tomography (CT) image generation tasks. First, in a retrospective MRI study (6,066 cases), we demonstrate its capability of handling 3- to 10-fold under-sampled MR data, enabling organ-level coverage with only 10- to 100-s scan time; second, a low-dose CT study (142 cases) shows that our framework can successfully alleviate the noise and streak artifacts in scans performed with only 10% radiation dose (0.61 mGy); and last, a fast whole-body PET study (131 cases) allows us to faithfully reconstruct tumor-induced lesions, including small ones (<4 mm), from 2- to 4-fold-accelerated PET acquisition (30-60 s/bp). This study offers a promising avenue for accurate and high-quality image reconstruction with broad clinical value.
Keywords: deep learning; fast MRI; fast PET; iterative reconstruction; low-dose CT.
Copyright © 2023 The Author(s). Published by Elsevier Inc. All rights reserved.
Conflict of interest statement
Declaration of interests S.L., J.W., X.W., X.H., Y. Zhang, Y.W., Q.Z., Y.X., Y. Zhan, X.S.Z., F.S., and D.S. are employees of Shanghai United Imaging Intelligence Co., Ltd.; G.L., G.Q., Y.L., W.C., and Y.D. are employees of Shanghai United Imaging Healthcare Co., Ltd. The companies have no role in designing and performing the surveillance and analyzing and interpreting the data.
Figures
Similar articles
-
High quality imaging from sparsely sampled computed tomography data with deep learning and wavelet transform in various domains.Med Phys. 2019 Jan;46(1):104-115. doi: 10.1002/mp.13258. Epub 2018 Nov 28. Med Phys. 2019. PMID: 30362117
-
Deep learning-based attenuation map generation with simultaneously reconstructed PET activity and attenuation and low-dose application.Phys Med Biol. 2023 Jan 24;68(3). doi: 10.1088/1361-6560/acaf49. Phys Med Biol. 2023. PMID: 36584395
-
Low-dose whole-body CT using deep learning image reconstruction: image quality and lesion detection.Br J Radiol. 2021 May 1;94(1121):20201329. doi: 10.1259/bjr.20201329. Epub 2021 Feb 22. Br J Radiol. 2021. PMID: 33571010 Free PMC article.
-
Deep learning-based image reconstruction and post-processing methods in positron emission tomography for low-dose imaging and resolution enhancement.Eur J Nucl Med Mol Imaging. 2022 Jul;49(9):3098-3118. doi: 10.1007/s00259-022-05746-4. Epub 2022 Mar 21. Eur J Nucl Med Mol Imaging. 2022. PMID: 35312031 Free PMC article. Review.
-
Improvement of image quality at CT and MRI using deep learning.Jpn J Radiol. 2019 Jan;37(1):73-80. doi: 10.1007/s11604-018-0796-2. Epub 2018 Nov 29. Jpn J Radiol. 2019. PMID: 30498876 Review.
Cited by
-
Innovations in clinical PET image reconstruction: advances in Bayesian penalized likelihood algorithm and deep learning.Ann Nucl Med. 2025 Sep;39(9):875-898. doi: 10.1007/s12149-025-02088-7. Epub 2025 Jul 18. Ann Nucl Med. 2025. PMID: 40681770 Free PMC article. Review.
-
Automatic segmentation and diameter measurement of deep medullary veins.Magn Reson Med. 2025 Mar;93(3):1380-1393. doi: 10.1002/mrm.30341. Epub 2024 Oct 31. Magn Reson Med. 2025. PMID: 39481043
-
State-of-the-Art Deep Learning CT Reconstruction Algorithms in Abdominal Imaging.Radiographics. 2024 Dec;44(12):e240095. doi: 10.1148/rg.240095. Radiographics. 2024. PMID: 39612283 Review.
-
Deep Learning Denoising Improves CT Perfusion Image Quality in the Setting of Lower Contrast Dosing: A Feasibility Study.AJNR Am J Neuroradiol. 2024 Oct 3;45(10):1468-1474. doi: 10.3174/ajnr.A8367. AJNR Am J Neuroradiol. 2024. PMID: 38844370
-
Deep learning-based PET image denoising and reconstruction: a review.Radiol Phys Technol. 2024 Mar;17(1):24-46. doi: 10.1007/s12194-024-00780-3. Epub 2024 Feb 6. Radiol Phys Technol. 2024. PMID: 38319563 Free PMC article. Review.
References
-
- Gull S.F., Daniell G.J. Image reconstruction from incomplete and noisy data. Nature. 1978;272:686–690.
-
- Zafar W., Masood A., Iqbal B., Murad S. Resolution, SNR, signal averaging and scan time in MRI for metastatic lesion in spine: a case report. J. Radiol. Med. Imaging. 2019;2:1014.
-
- Payne J.T. CT radiation dose and image quality. Radiol. Clin. North Am. 2005;43 953-962, vii. - PubMed
-
- Goldman L.W. Principles of CT: radiation dose and image quality. J. Nucl. Med. Technol. 2007;35 213-225; quiz 226-8. - PubMed
-
- Geyer L.L., Schoepf U.J., Meinel F.G., Nance J.W., Jr., Bastarrika G., Leipsic J.A., Paul N.S., Rengo M., Laghi A., De Cecco C.N. State of the art: iterative CT reconstruction techniques. Radiology. 2015;276:339–357. - PubMed
Publication types
MeSH terms
LinkOut - more resources
Full Text Sources
