. 2023 Sep;621(7978):267-270.
doi: 10.1038/s41586-023-06413-w. Epub 2023 Jul 19.

Carbonaceous dust grains seen in the first billion years of cosmic time

Affiliations

Carbonaceous dust grains seen in the first billion years of cosmic time

Joris Witstok et al. Nature. 2023 Sep.

Abstract

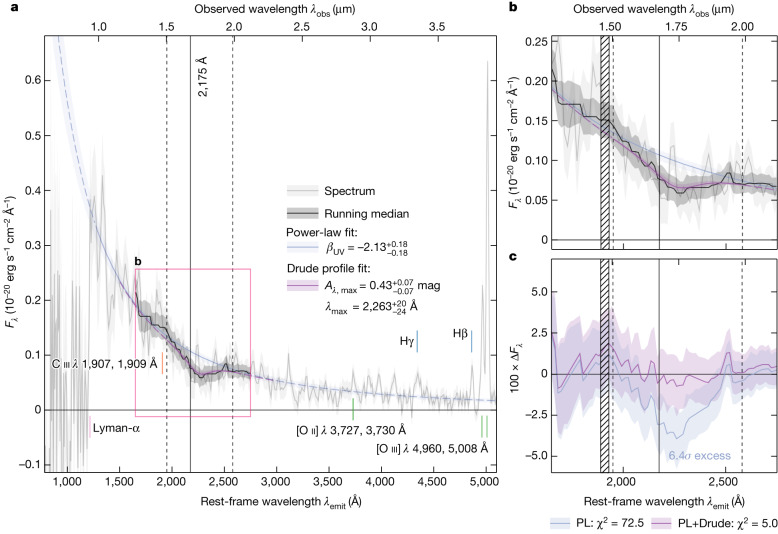
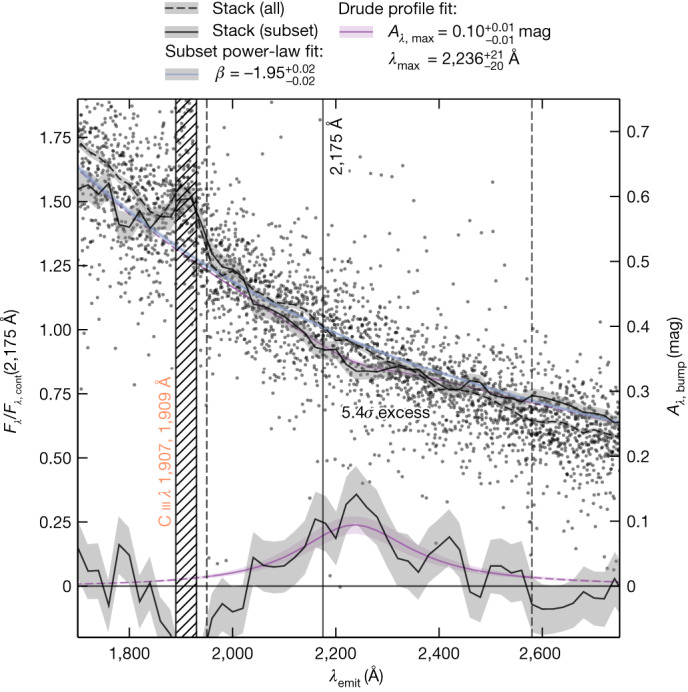
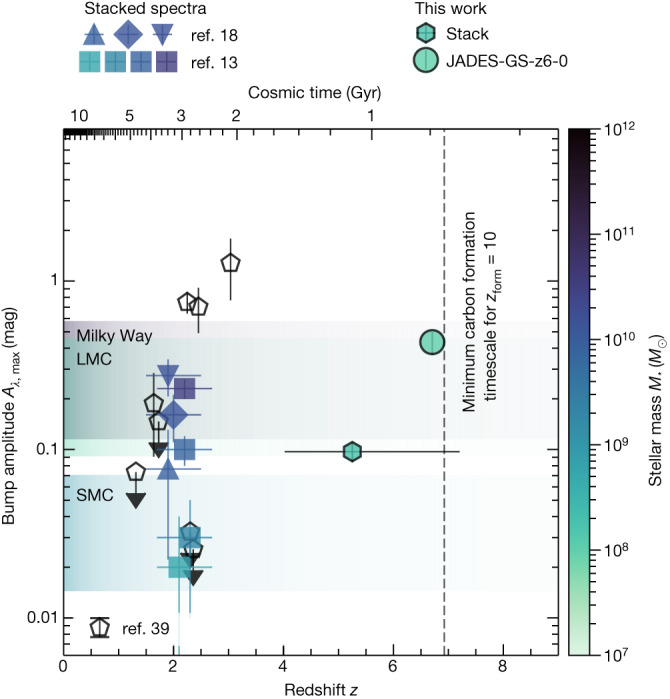
Large dust reservoirs (up to approximately 108 M) have been detected1-3 in galaxies out to redshift z ≃ 8, when the age of the Universe was only about 600 Myr. Generating substantial amounts of dust within such a short timescale has proven challenging for theories of dust formation4,5 and has prompted the revision of the modelling of potential sites of dust production6-8, such as the atmospheres of asymptotic giant branch stars in low-metallicity environments, supernova ejecta and the accelerated growth of grains in the interstellar medium. However, degeneracies between different evolutionary pathways remain when the total dust mass of galaxies is the only available observable. Here we report observations of the 2,175 Å dust attenuation feature, which is well known in the Milky Way and galaxies at z ≲ 3 (refs. 9-11), in the near-infrared spectra of galaxies up to z ≃ 7, corresponding to the first billion years of cosmic time. The relatively short timescale implied for the formation of carbonaceous grains giving rise to this feature12 suggests a rapid production process, possibly in Wolf-Rayet stars or supernova ejecta.


Conflict of interest statement

The authors declare no competing interests.

Figures

Fig. 1
Fig. 1. Spectrum taken by JWST/NIRSpec of JADES-GS-z6-0 at redshift z = 6.71.
a, Overview of the spectrum (grey solid line) with a power-law fit to the UV continuum (blue solid line). Several spectral features used to confirm the spectroscopic redshift are indicated, including the Lyman-α break, the [O ii] λ 3,727, 3,730 Å doublet, and the Hβ, Hγ and [O iii] λ 4,960, 5,008 Å lines. b, Zoom-in of the UV bump region around λemit = 2,175 Å, where a running median (solid black line), representing the attenuated stellar continuum, reveals a deep localized absorption profile. A Drude profile fit within the vertical dashed lines (purple solid line) with respect to the smooth power law (blue solid line) yields an amplitude of 0.430.07+0.07 mag and a central wavelength λmax=2,26324+20 Å. The hatched region indicates the C iii λ 1,907, 1,909 Å doublet. c, The residuals (∆Fλ) show that the power-law (PL) fit alone has a significant negative flux excess between approximately 2,000 and 2,400 Å (6.4σ), whereas the power-law fit and Drude profile combined (PL+Drude; purple line) provides a significantly better fit (χ2 = 72.5 versus χ2 = 5.0 for PL and PL+Drude, respectively). All shading represents 1σ uncertainty. Source data
Fig. 2
Fig. 2. Normalized and stacked spectra around the UV bump of z > 4 JADES galaxies observed by JWST/NIRSpec.
Spectra of all galaxies (small black dots) are shifted to the rest frame and normalized to the predicted continuum level at a rest-frame wavelength of λemit = 2,175 Å in the absence of a UV bump (Methods). The dashed black line (shading represents 1σ uncertainty) is a stacked spectrum obtained by combining all 49 objects in wavelength bins of Δλemit = 20 Å. The hatched region clearly shows emission from the C iii λ 1,907, 1,909 Å doublet. The stacked spectrum of ten galaxies selected to have a bump signature (solid black line, shading as 1σ uncertainty), in addition to appearing to have a mildly redder UV slope, shows the presence of the UV bump around 2,175 Å. This bump has an excess with respect to a power-law continuum (solid blue line; see Methods) at a significance of 5.4σ. The excess attenuation Aλ,bump (curve at the bottom, corresponding to the axis on the right) is fitted with a Drude profile (shown in purple with shading as 1σ uncertainty), which gives an amplitude of 0.100.01+0.01 mag and a central wavelength λmax=2,23620+21 Å. Source data
Fig. 3
Fig. 3. Redshift evolution of UV bump strength.
Amplitude of the excess attenuation Aλ,max is shown for JADES-GS-z6-0 individually as well as for the stack of ten z ≃ 4–7 JADES galaxies. Points are coloured according to their (average) stellar mass. Error bars along the y axis represent 1σ uncertainty. At z ≃ 2, measurements from γ-ray burst absorbers (ref.  and references therein) and from stacked spectra in various bins of stellar mass or shape of the UV continuum as a whole and in the bump region are shown (see Methods for details),,. Error bars of the stacked spectra along the x axis represent the full redshift range, their central values slightly shifted for visualization purposes. The bump amplitudes in the average Milky Way (MW), Large Magellanic Cloud (LMC) and Small Magellanic Cloud (SMC) dust extinction curves,, converted to an attenuation for a visual extinction range of 0.1 mag < AV < 0.5 mag, are indicated with light shading. The age of the Universe is indicated at the top. The vertical dashed line indicates the minimum timescale required for carbon production by AGB stars (that is, 300 Myr) if the galaxy formed at zform = 10. Source data
Extended Data Fig. 1
Extended Data Fig. 1. SED modelling and false-colour image of JADES-GS-z6-0.
a, Spectrum observed with NIRSpec (grey solid line and light-grey shading as 1σ uncertainty), overlaid with NIRCam photometry (grey points; error bars show the filter widths along the wavelength direction and 1σ uncertainty along the y-axis) of JADES-GS-z6-0. A calibration correction is applied to the spectrum to match the photometry (see the Stellar population synthesis modelling section). The running median around 2175 Å is shown as a solid black line. The best-fit bagpipes SED model (Stellar population synthesis modelling section) is shown as a light green solid line (predicted spectrum; darker and lighter shading represents the 1σ and 2σ uncertainty, respectively) and points (predicted photometry; error bars show 1σ uncertainty). b, Colour-composite 1′′ × 1′′ image constructed from inverse-variance weighted combinations of NIRCam filters, with the F115W and F150W filters as the blue channel, the F200W filter as green, and three medium-band filters not contaminated by strong emission lines (F430M, F460M, and F480M) as red. The position of the NIRSpec MSA shutters in the central nodding position (shown for all three separate observing visits, which however are nearly identical) are overlaid in white. A scale of 1 kpc is indicated in the bottom right.
Extended Data Fig. 2
Extended Data Fig. 2. Sample characteristics.
Top row (panels a to f): spectral slope change around λemit = 2175 Å (γ34) as a function of the physical properties of the galaxy sample. JADES-GS-z6-0 is highlighted as an enlarged point. Error bars represent 1σ uncertainty. The median values of galaxies belonging to the sample with (coloured points) and without (black points) a UV bump signature (see the Sample selection section) are indicated respectively with coloured and black dashed lines. The Spearman’s rank correlation coefficient, ρS, is reported at the top of each panel along with its p-value and the completeness (i.e. for which percentage of the sample the metric was measured). Bottom row (panels g to l): median of the full sample (large black square), the sample with (coloured square) and without (small black square) bump signatures. The error bars show uncertainties on the median obtained with bootstrapping. Quantities shown are the absolute UV magnitude (MUV; panels a and g), UV spectral slope (βUV; b and h), Balmer decrement Hα/Hβ (c and i), stellar mass (M; d and j), star formation rate averaged over the last 30 Myr (SFR30; e and k), and mass-weighted stellar age (t; f and l).
Extended Data Fig. 3
Extended Data Fig. 3. Normalised and stacked rest-frame optical spectra of z > 4 JADES galaxies observed by JWST/NIRSpec.
Similar to Fig. 2, spectra of all galaxies (small black dots) are shifted to the rest frame but normalised to the flux density at the rest-frame wavelength of Hβ, λ = 4862.7 Å. The dashed black line (shading represents 1σ uncertainty) shows a stacked spectrum obtained by combining all 49 objects in wavelength bins of ∆λemit = 10 Å. The main rest-frame optical emission lines are labelled. The stacked spectrum of ten galaxies selected to have a bump signature (solid black line, shading as 1σ uncertainty) exhibits stronger [O III] and Hα emission relative to the full sample, while having a consistent [O III]/[O II] line ratio. This is quantified by the integrated flux ratios of the fitted Gaussian line profiles (respectively shown as red and blue solid lines with shading as 1σ uncertainty), indicating differences in oxygen abundance as well as dust obscuration.
Extended Data Fig. 4
Extended Data Fig. 4. Exploration of signatures from substantially evolved stellar populations.
a, The age-sensitive spectral region around the 4000 Å (Balmer) break of JADES-GS-z6-0. Similar to Extended Data Fig. 1, the (photometry-corrected) NIRSpec spectrum is shown as the grey solid line (light-grey shading as 1σ uncertainty), NIRCam photometry as grey points (error bars show the filter widths along the wavelength direction and 1σ uncertainty along the y-axis). The BAGPIPES SED model with best-fit parameters (see Stellar population synthesis modelling) is shown as a black solid line (spectrum) and points (photometry). Two-component models are shown by the blue (age of 100 Myr), green (250 Myr), and red (500 Myr) solid (107.5 M) and dashed (108.5 M) lines. b, The difference in reduced chi-squared values, Δχν2, is shown as a function of the stellar mass of the evolved population, Mevolved. A dashed horizontal line indicates the value above which the new model is in 2σ tension with respect to the single-component model (Δχν2=4).
Extended Data Fig. 5
Extended Data Fig. 5. Rest-frame UV continuum of JADES-GS-z6-0.
a, The one-dimensional spectrum of JADES-GS-z6-0 (smoothed with a 15-pixel median filter as in Fig. 1) is normalised to the predicted continuum level in the absence of a UV bump, modelled as a power law with index βUV (purple line; shading as 1σ uncertainty). The median signal-to-noise ratio (SNR) and γ34 are reported in the bottom-left corner. Coloured lines show data from individual observing visits, while the solid black line and grey shading represent the combined spectra and their 1σ uncertainty, respectively. A dashed black line indicates the spectrum from a 3-pixel aperture extraction. b, Two-dimensional spectrum of JADES-GS-z6-0 (not scaled to the predicted continuum level).

References

    1. Watson D, et al. A dusty, normal galaxy in the epoch of reionization. Nature. 2015;519:327–330. doi: 10.1038/nature14164. - DOI - PubMed
    1. Tamura Y, et al. Detection of the far-infrared [O iii] and dust emission in a galaxy at redshift 8.312: early metal enrichment in the heart of the reionization era. Astrophys. J. 2019;874:27. doi: 10.3847/1538-4357/ab0374. - DOI
    1. Witstok J, et al. Dual constraints with ALMA: new [O iii] 88-μm and dust-continuum observations reveal the ISM conditions of luminous LBGs at z ∼ 7. Mon. Not. R. Astron. Soc. 2022;515:1751–1773. doi: 10.1093/mnras/stac1905. - DOI
    1. Ferrara A, Viti S, Ceccarelli C. The problematic growth of dust in high-redshift galaxies. Mon. Not. R. Astron. Soc. 2016;463:L112–L116. doi: 10.1093/mnrasl/slw165. - DOI
    1. Leśniewska A, Michałowski MJ. Dust production scenarios in galaxies at z ∼ 6–8.3. Astron. Astrophys. 2019;624:L13. doi: 10.1051/0004-6361/201935149. - DOI