. 2023 Oct:187:109813.
doi: 10.1016/j.radonc.2023.109813. Epub 2023 Jul 17.

Radiation nephropathy: Mechanisms of injury and recovery in a murine model

Affiliations

Radiation nephropathy: Mechanisms of injury and recovery in a murine model

Anis Ahmad et al. Radiother Oncol. 2023 Oct.

Abstract

Background: Radiation nephropathy (RN) can be a severe late complication for patients treated with radiotherapy (RT) targeting abdominal and paraspinal tumors. Recent studies investigating the mechanisms of RT-mediated injury in the kidney have demonstrated that RT disrupts the cellular integrity of renal podocytes leading to cell death and loss of renal function.

Aim: To determine if RT-induced renal dysfunction is associated with alterations in podocyte and glomerular function, and whether RT-induced podocyte alterations were associated with changes in the glomerular basement membrane (GBM).

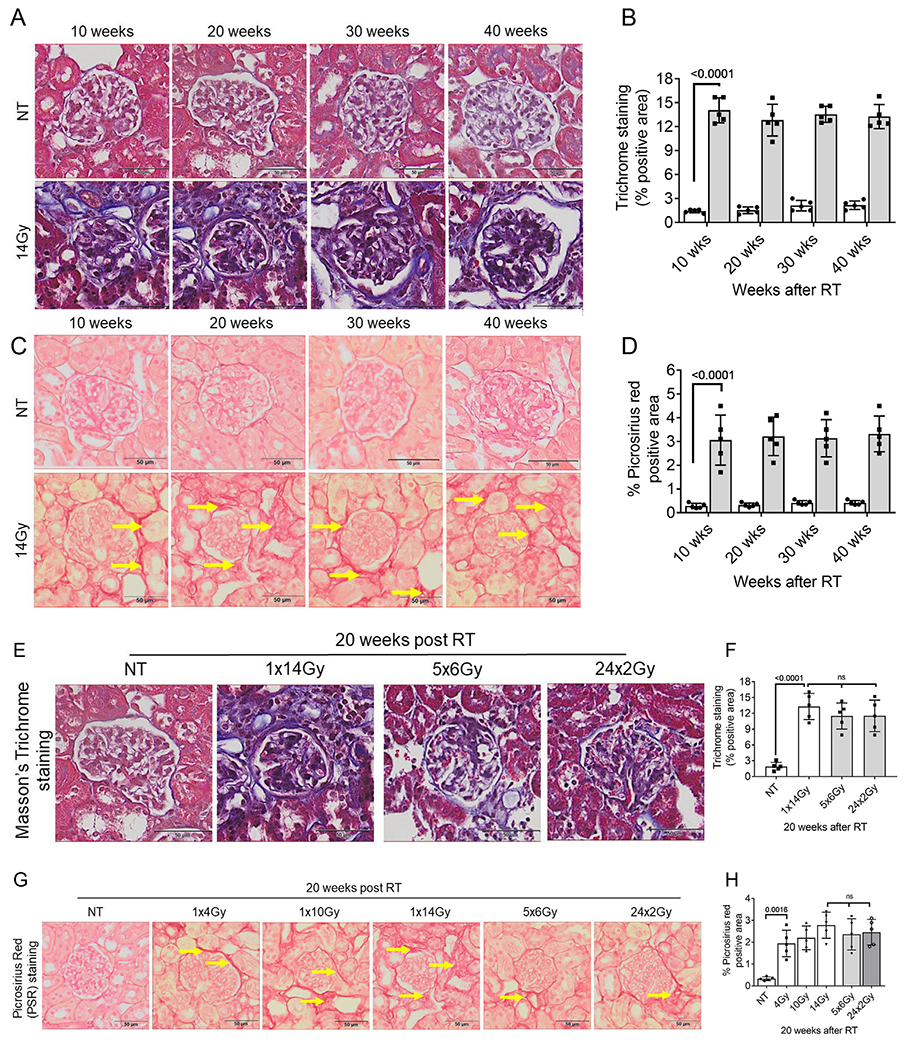
Methods: C57BL/6 mice were treated with focal bilateral X-irradiation using a single dose (SD) of 4 Gy, 10 Gy, or 14 Gy or fractionated dosing (FD) of 5x6Gy or 24x2Gy. Then, 10-40 weeks after RT parameters of renal function were measured, along with glomerular filtration rate (GFR) and glomerular histology, as well as ultrastructural changes in GBM by transmission electron microscopy.

Results: RT treatment resulted in persistent changes in renal function beginning at 10 weeks with little recovery up to 40 weeks post RT. Dose dependent changes were seen with increasing SD but no functional sparing was evident after FD. RT-induced loss of renal function was associated with expansion of the GBM and significant increases in foot process width, and associated with significant reduction in GFR, podocyte loss, and renal fibrosis.

Conclusion: For the first time, these data show that expansion of the GBM is one consequence of radiation injury, and disarrangement of the GBM might be associated with the death of podocytes. These data shed new light on the role podocyte injury and GBM in RT-induced renal dysfunction.

Keywords: Glomerular basement membrane; Ionizing radiation; Podocyte foot process; Podocytes; Radiation therapy.


Conflict of interest statement

Declaration of Competing Interest The authors declare that they have no known competing financial interests or personal relationships that could have appeared to influence the work reported in this paper.

Figures

Fig. 1.
Fig. 1.
RT induces podocyte injury and reduces nephrin expression. C57BL/6 mice received bilateral kidney irradiation (14Gyx1 or 5x6Gy). The mice were sacrificed along with their control littermates 10- and 20-weeks post-RT. (A) Representative immunostaining (63x or 20x) for anti-desmin (podocyte injury marker) and WT-1 (podocyte marker) in 4 μm kidney sections. (B) shows the mean fluorescence intensity (MFI) of Laminin desmin. (C) shows the number of podocytes per glomeruli (D) Representative immunostaining (20x) for anti-nephrin in 4 μm kidney sections. (E) shows the glomerular % nephrin positive area. (N = 5 per group, p-value by one-way ANOVA followed by Tukey’s multiple comparisons test.
Fig. 2.
Fig. 2.
Change in renal fibrosis over the time post-RT. C57BL/6 mice received bilateral kidney irradiation (14Gyx1), the mice were sacrificed along with their control littermates 24 h, 10–40 weeks post-RT. (A) representative trichrome staining (B) quantification of trichrome staining in the kidney cortex. (C) picrosirius red (PSR) staining (D) shows the quantification of picrosirius red staining in the kidney cortex. (N = 5 per group, by two-way ANOVA followed by Sidak’s multiple comparisons test. Values are mean ± SD. NT = No treatment, RT = radiation therapy. Change in renal fibrosis over the different doses of RT. (E) representative trichrome staining (F) quantification of trichrome staining in the kidney cortex. (G) representative picrosirius red staining (H) shows quantification of picrosirius red staining in the kidney cortex. (N = 5 per group, by one-way ANOVA followed by Tukey’s multiple comparisons. Values are mean ± SD. N = No treatment, RT = radiation therapy.
Fig. 3.
Fig. 3.
Kidney functional parameters decreased with time post bilateral kidney radiation. C57BL/6 mice received bilateral kidney irradiation (14Gyx1), the mice were sacrificed along with their control littermates 24 h, 10–40 weeks post-RT. (A) Serum creatinine levels (B) serum BUN (C) kidney weight (D) body weight (E) kidney weight body ratio (F) urine albumin to creatinine ratio (ACR). N = 5 per group, p-value by two-way ANOVA followed by Sidak’s multiple comparisons test. Values are mean ± SD. NT = No treatment, RT = radiation therapy. Alb = albumin. Kidney functions decreased in an RT dose dependent manner. C57BL/6 mice received various singe, and fractionated bilateral kidney irradiation doses and mice were sacrificed along with their control littermates 20 weeks RT. (G) Serum creatinine levels (H) serum BUN (I) urine albumin to creatinine ratio (ACR) (J) body weight (K) kidney weight (L) kidney weight body ratio. N = 5 per group, p-value by one-way ANOVA followed by Tukey’s multiple comparisons test. Values are mean ± SD. NT = No treatment, RT radiation therapy.
Fig. 4.
Fig. 4.
Estimated glomerular filtration rate (e-GFR) decreased with time post-RT. C57BL/6 mice received a single dose (4 Gy, 10 Gy, and 14 Gy) or fractionated dose (5x6Gy and 24x2Gy) bilateral kidney irradiation glomerular filtration rate was estimated at 10–40 weeks after RT. (A) estimated glomerular filtration rate decreases in a time-dependent manner post-RT (B) estimated glomerular filtration rate decreases in a dose-dependent manner post-RT (N = 5 per group, by two-way ANOVA followed by Sidak’s multiple comparisons test. Values are mean ± SD. NT = No treatment, RT = radiation therapy.
Fig. 5.
Fig. 5.
Glomerular basement membrane (GBM) thickness increases with time post-radiation therapy (RT). C57BL/6 mice received bilateral kidney irradiation (14Gyx1). The mice were sacrificed along with their control littermates 10–40 weeks post-RT. (A-D) Representative Periodic Acid Schiff (PAS) and transmission electron microscope (TEM) images from kidney sections. (E-H) shows quantification of PAS and TEM images. (N = 3 per group, p-values by two-way ANOVA followed by Sidak’s multiple comparisons test. Solid bars are irradiated animals and open bars are age-matched controls. Values are mean ± SD. NT = No treatment. Glomerular basement membrane (GBM) thickness increases with the dose of RT. C57BL/6 mice received bilateral kidney irradiation and were sacrificed along with their control littermates 20 weeks post-RT. (I-M) show representative Periodic Acid Schiff (PAS) and Transmission electron microscope (TEM) images from kidney sections and quantification of PAS and TEM images. (N = 3 per group, by one-way ANOVA followed by Tukey’s multiple comparisons test. Values are mean ± SD. CL = Capillary lumen, FP = Foot process, F = Fenestration barrier, MC = mesangial cells, P = Podocytes, RBC = Red blood cells,
Fig. 6.
Fig. 6.
Correlation of glomerular basement membrane (GBM) thickness with kidney functional parameters, mesangial expansion score, and podocyte number. GBM thickness correlates with (A) blood urea nitrogen (BUN). (N = 55, p < 0.0001, R = 0.68). (B) serum creatinine levels (N = 55, p < 0.0001, R2 = 0.84). (C) urine albumin to creatinine ratio (N = 55, p < 0.0001, R2 = 0.88). (D) mesangial expansion score N = 55, p < 0.0001, R2 = 0.77). (D) mesangial expansion score, N 55, p < 0.0001, R2 = 0.77). (E) glomerular filtration rate (GFR) N = 55, p < 0.0001, R2 = 0.42). F) Podocyte number (N = 55, p < 0.0001, R2 = 0.66).
Fig. 7.
Fig. 7.
Comprehensive Nanostring data analysis 10, 20, and 40 weeks after RT vs. untreated controls. (A) Hierarchical clustering and heat map of differentially expressed genes based on the expression levels compared to non-treated (NT) controls. Genes in red and blue represent highly and lowly expressed genes, respectively, in mouse kidney cortex 10, 20, and 40 weeks after 14 Gy. (B) The volcano plot shows the significantly differentially upregulated and downregulated genes in mouse kidney cortex 10, 20, and 40 weeks after 14 Gy vs. non-treated control (C) heat map of TOP 41 differentially upregulated genes based on the expression levels compared to non-treated (NT) controls. (D) Differential expression of the renal fibrosis-related genes.
Fig. 8.
Fig. 8.
Cisplatin with or without RT causes renal damage. C57BL/6 mice received 5x6Gy followed by Cisplatin treatment (6 mg/kg, IP on day 1 and day 22). Mice were sacrificed 20 weeks post-treatment, and kidney sections were stained with H&E staining and Masson’s Trichrome (A) Photomicrograph of H&E staining, and Masson’s Trichrome stain of kidney sections. Note: The condensation of the cell necrosis (black arrow) and protein cast (yellow arrow) in Cisplatin and Cisplatin + RT mice. The red arrows refer to vacuolization of the renal cortex, and the blue arrow refers to dilated tubules. Black arrowhead refers to fibrosis (original magnification ×40). (B) Quantification of the renal injury score (C) Quantification of the Trichrome positive area (a marker for fibrosis) (D) Quantification of serum BUN. Renal injury was scored from 0 to 5 by two independent investigators. All values were expressed as mean ± S.D. *p < 0.05 vs. normal group. DT = Distal tubule, PT = Proximal tubule, Glome = glomeruli, CP = Cisplatin.

Similar articles

References

    1. De Ruysscher D, Niedermann G, Burnet NG, Siva S, Lee AWM, Hegi-Johnson F. Radiotherapy toxicity. Nat Rev Dis Primers 2019;5:13. - PubMed
    1. Dawson LA, Kavanagh BD, Paulino AC, Das SK, Miften M, Li XA, et al. Radiation-associated kidney injury. Int J Radiat Oncol Biol Phys 2010;76:S108–15. - PubMed
    1. Cassady JR. Clinical radiation nephropathy. Int J Radiat Oncol Biol Phys 1995;31:1249–56. - PubMed
    1. Tarbell NJ, Guinan EC, Chin L, Mauch P, Weinstein HJ. Renal insufficiency after total body irradiation for pediatric bone marrow transplantation. Radiother Oncol 1990;18:139–42. - PubMed
    1. Emami B, Lyman J, Brown A, Coia L, Goitein M, Munzenrider JE, et al. Tolerance of normal tissue to therapeutic irradiation. Int J Radiat Oncol Biol Phys 1991;21:109–22. - PubMed

Publication types